DEVELOPMENT AND VALIDATION OF SYSTEM FOR MEASURING POLING FORCES
DURING NORDIC WALKING
Jakub Krejčí*, Aleš Jakubec, Martin Pšurný, Miroslav Janura
Faculty of Physical Culture, Palacký University, Olomouc, Czech Republic
Submitted in June, 2013
BACKGROUND: Recently, the popularity of Nordic walking (NW) has been rising steadily. Many scientific studies researched the promising and beneficial effects of this form of physical activity. However, only a few studies provided data about the forces acting on the poles. We did not find a commercially available system that enables the measure-ment of the poling forces.
OBJECTIVE: The objective of this paper was to develop and validate a system for measuring the poling forces dur-ing NW.
METHODS: Strain gauge force tranducers were mounted below the grips of standard NW poles. The transducer signals were amplified and converted to digital form for transmitting to a personal computer. Special software was developed for processing the measured data and the calculation method of output variables was described. Validation of the system was performed using a Kistler force plate. Poling cycles with peak force of about 150 N were imitated by pressing the pole over a force plate.
RESULTS: A function sample of the measurement system was constructed. Validation yielded the mean absolute error of 1.1 N in case of poling cycles without pole impacts or 3.0 N in case of poling cycles with impacts.
CONCLUSIONS: The validation result of our system is comparable to the results of similar systems used for mea-surements during cross-country skiing. The system enables independent measurement of the poling forces on both poles and the duration of measurement can be up to one hour. The system provides a tool that can be used to answer a number of questions that researches raise about NW. Understanding of the biomechanical and physiological aspects of poling action can constitute a scientific basis for promoting, teaching and training of NW.
Keywords:Strain gauge, validation, force-time curve, data processing.
For biomechanical or physiological studies, it is important to measure the poling forces produced by the upper body musculature. The measured poling force data enables the interpretation and comparison of results within one study as well as among various studies. To our knowledge, there are two studies con-cerning poling forces during NW (Jensen et al., 2011; Schiffer, Knicker, Dannöhl, & Strüder, 2009). There are also several studies concerning poling forces dur-ing cross-country skidur-ing (Holmberg, Linddur-inger, Stöggl, Eitzlmair, & Müller, 2005; Lindinger, & Holmberg, 2011; Lindinger, Stöggl, Müller, & Holmberg, 2009; Millet, Hoffman, Candau, & Clifford, 1998; Nilsson, Tinmark, Halvorsen, & Arndt, 2012; Pellegrini, Bor-tolan, & Schena, 2011; Stöggl, & Holmberg, 2011; Vähäsöyrinki et al., 2008). From the technical point of view, the measurement systems for NW are similar to the systems for cross-country skiing. All previously cited studies used various kinds of custom developed measurement systems. However, we did not find a com-mercially available system intended for such purpose. INTRODUCTION
Nordic walking (NW), grouped as an endurance physi-cal activity, has been gaining popularity. NW, when performed regularly, provides an array of health ben-efits for the young, the elderly, or for persons with vari-ous health problems, especially those suffering from chronic diseases such as diabetes mellitus, obesity, and hypertension (Morgulec-Adamowicz, Marszałek, & Ja-gustyn, 2011; Tschentscher, Niederseer, & Niebauer, 2013). The increased metabolic and cardiovascular demands during NW compared with normal walking has been often explained by the additional recruitment of the upper body musculature for propulsion (Church, Earnest, & Morss, 2002; Schiffer et al., 2006).
The objective of this paper was to develop and vali-date a system intended for measuring the poling forces during NW.
METHODS
Development of a system for measuring poling forces The system consists of parts as follows – two pieces of a force transducer, a signal conditioning unit, a data acquisition device (AD converter) and a personal com-puter with a special software (Figure 1). The system en-ables measuring the poling forces in both poles (right and left) simultaneously.
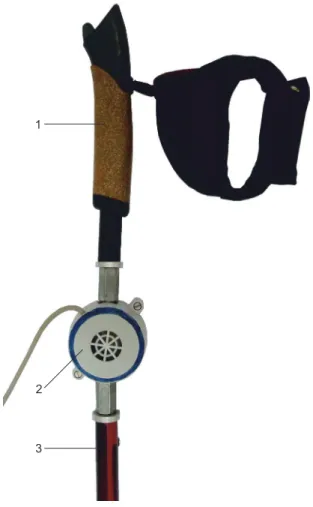
Aluminium NW poles (BIRKI, Jeseník, Czech Re-public) were modified so that force transducers can be mounted below the grips (Figure 2). Each pole was cut and an aluminium fitting with female thread was riv-eted into the pole. The fittings enabled changing the lower part of the pole of different lengths. Seven sets of poles with different lengths (range 105–135 cm, step 5 cm) were available for the subject to choose.
A custom-made single axial strain gauge force trans-ducer (Uničovské strojírny, Uničov, Czech Republic)
was composed of a circular steel deformation element of 45 mm in diameter and four wire strain gauges. The strain gauges were glued to the element and wired to compose the full bridge circuit. The sensitive axis of the transducer was aligned with the longitudinal axis of the pole. The measuring range of the tranducer was ± 1000 N. Such a large range was necessary because the transducer must be able to withstand impact shock. The mounting of the tranducer added an additional mass of 140 g to the original pole weight.
Differential voltage signals from the tranducers were amplified by means of a signal conditioning unit. Its base was composed of the instrumentation amplifier AD623 (Analog Devices, Norwood, MA, USA). The unit was built in a small plastic casing (10 × 8 × 4 cm) and had to be carried by subjects on a waist belt. This solution did not increase the weight of the poles and enabled using short wires between tranducers and am-plifier, aiding in reduced noise. Amplified signals were sampled by a data acquisition device USB-1608FS (Measurement Computing, Norton, MA, USA) and the data was transferred to a personal computer via USB interface. Data was recorded at a sampling
quency of 1,000 Hz and at 16-bit resolution. Setting the zero level of the force transducers was performed in the field before each measurement. The poles were erected vertically without touching the transducers or the grips and the actual measured voltage was used as a refer-ence for force of 0 N.
A special menu driven software was developed us-ing the MATLAB computus-ing language (MathWorks, Natick, MA, USA). The programme makes possible the online display of the force-time curves and the storing of the measured data in the internal database. The of-fline calculation of variables (see below) and export in comma-separated-values file format are also possible.
Figure 2 Detailed view of strain gauge force trans-ducer mounted below the grip of NW pole. 1 – grip, 2 – strain gauge force transducer, 3 – lower part of the pole (seven different lengths were available)
Calibration and validation of the system
The force transducers were calibrated using a cus-tom-made calibration apparatus with eight different weights (range 5–40 kg, step 5 kg). A regression line for conversion of the measured voltage to units of force (N) was obtained for each transducer.
The force transducers mounted inside the poles were validated (Holmberg et al., 2005). The pole grip was holded in a hand and at least 30 poling cycles
were imitated on a force plate, type 9286AA (Kistler Instrumente AG, Winterthur, Switzerland). The plate lay on the floor and pole tip was placed on the plate. The imitated poling action was not exactly the same as real poling action during NW because the subject did not move forward. The signals from the force trans-ducer and the force plate were recorded simultaneously at a sampling frequency of 1,000 Hz. The difference between force transducer output xt and total force plate output xp was expressed as mean absolute error EMean and maximum absolute error EMax according the for-mulas:
where n is the total number of samples in one record and was of about 30,000. Calculation was performed using the Statistics Toolbox of MATLAB 7.6 (Math-Works, Natick, MA, USA).
Calculation of variables derived from force-time curve The data obtained from the force transducers consist-ed of right pole force (FR) and of left pole force (FL) sampled at 1,000 Hz frequency. The data was first smoothed by a digital finite-impulse-response lowpass filter with a passband of 0–100 Hz and stopband of 200–500 Hz. The filtration cut the high frequency sig-nal component that carried no useful information and consequently the signal to noise ratio increased.
Data was processed separately for right and left pole. The series of beginnings of pole ground contact and the series of ends of pole ground contact were identified on the force-time curve (Figure 3). The beginning of pole ground contact tb was determined as the first posi-tive force sample after a non-posiposi-tive sample, expressed mathematically as F(tb – 0.001 s) ≤ 0 ∧ F(tb) > 0. The end of pole ground contact te was determined as the last positive force sample followed by a non-pos-itive sample, expressed mathematically as F(te) > 0 ∧ F(te + 0.001 s) ≤ 0. One poling cycle was defined as the phase from contact beginning to the subsequent contact beginning and was further split into a poling phase and a recovery phase. The poling phase is the phase between contact begining and contact end and the measured force is positive (F > 0) there. The recov-ery phase is the rest of the poling cycle.
used for subsequent analysis. The subjects were in-structed to use alternate diagonal walking, i.e., with an antiphase movement of the upper limbs relative to the lower limbs. In such walking, the right poling phase was followed by the left poling phase and vice versa. The pairs of subsequent poling phases (right and left) were exported to a file as the output of the measure-ment system. When only one pole was used, e.g., the subject was drying sweat by the other hand, such pol-ing phases were excluded. Consequently, the number of right poling phases equaled to the number of left poling phases, which was required by users of the mea-surement system.
Variables were calculated from force-time curve as follows (Figure 3):
1. Cycle time (CT) is duration of the poling cycle be-tween two consecutive beginnings of pole ground contact. CT = t’b – tb, where t’b is subsequent begin-ning after tb. Unit is second [s] (Holmberg et al., 2005; Lindinger & Holmberg, 2011; Lindinger et al., 2009; Millet et al., 1998; Nilsson et al., 2012; Pellegrini, Bortolan, & Schena, 2011; Vähäsöyrin-ki et al., 2008).
2. Poling time (PT) is duration of the poling phase between begining and end of pole ground contact. PT = te – tb, unit is second [s] (Holmberg et al., 2005; Lindinger & Holmberg, 2011; Lindinger et al., 2009; Millet et al., 1998; Nilsson et al., 2012;
Pellegrini, Bortolan, & Schena, 2011; Schiffer et al., 2009; Stöggl & Holmberg, 2011; Vähäsöyrinki et al., 2008).
3. Relative poling time (RPT) is relative duration of the poling phase with respect to the duration of poling cycle. RPT = 100 PT / CT, unit is percent-age [%] (Holmberg et al., 2005; Lindinger & Holm-berg, 2011; Lindinger et al., 2009; Millet et al., 1998; Nilsson et al., 2012; Pellegrini, Bortolan, & Schena, 2011; Stöggl & Holmberg, 2011).
4. Recovery time (RT) is duration of the recovery phase. RT = CT – PT, unit is second [s] (Holm-berg et al., 2005; Lindinger & Holm(Holm-berg, 2011; Lindinger et al., 2009; Millet et al., 1998; Nilsson et al., 2012; Pellegrini, Bortolan, & Schena, 2011; Stöggl & Holmberg, 2011).
5. Cycle frequency (CF) is the number of cycles per time unit. CF = 1 / CT, unit is hertz [Hz], or after multiplying the CF by value of 60, unit is the re-ciprocal minute [min.–1]. CF is equivalent to stride frequency of the lower limbs (Holmberg et al., 2005; Lindinger & Holmberg, 2011; Lindinger et al., 2009; Millet et al., 1998; Nilsson et al., 2012). 6. Poling frequency (PF) is the number of pole ground
contacts per time unit. There are two ground con-tacts for both poles (right and left) per cycle dur-ing the alternate diagonal walkdur-ing. PF = 2 CF, unit is hertz [Hz] or reciprocal minute [min.–1]. PF is equivalent to step frequency of the lower limbs. 7. Peak poling force (PPF) is peak value of force
achieved during one poling phase. PPF = max[F(t)], t ≥ tb ∧ t ≤ te; unit is newton [N] (Holmberg et al., 2005; Jensen et al., 2011; Lindinger & Holmberg, 2011; Lindinger et al., 2009; Millet et al., 1998; Schiffer et al., 2009; Stöggl & Holmberg, 2011). 8. Impulse of poling force (IPF) is integration of
the force-time curve during the poling phase.
∫
= e
b
t t F(t)dt
IPF , unit is newton second [N · s]
(Holmberg et al., 2005; Jensen et al., 2011; Lindinger & Holmberg, 2011; Millet et al., 1998; Nilsson et al., 2012; Schiffer et al., 2009; Stöggl & Holmberg, 2011).
9. Average poling force (APF) is poling force averaged over the poling phase. Hence a product of APF and PT yields the same value as IPF of the actual force-time curve. APF = IPF / PT, unit is newton [N] (Millet et al., 1998; Pellegrini, Bortolan, & Schena, 2011).
10. Average cycle poling force (ACPF) is poling force av-eraged over the entire poling cycle. Hence a prod-uct of ACPF and CT yields the same value as IPF of the actual force-time curve. ACPF = IPF / CT, unit is newton [N] (Millet et al., 1998; Nilsson et al., 2012; Pellegrini, Bortolan, & Schena, 2011; Figure 3 Demonstration of the variables calculated
Stöggl & Holmberg, 2011; Vähäsöyrinki et al., 2008).
All variables were calculated and exported sepa-rately for right and left pole and for each poling cycle. This was useful for assessing possible asymmetry of the poling action. When assymetry analysis is not an issue, the average value of both poles was taken, e.g., IPF = (IPFR + IPFL) / 2.
RESULTS
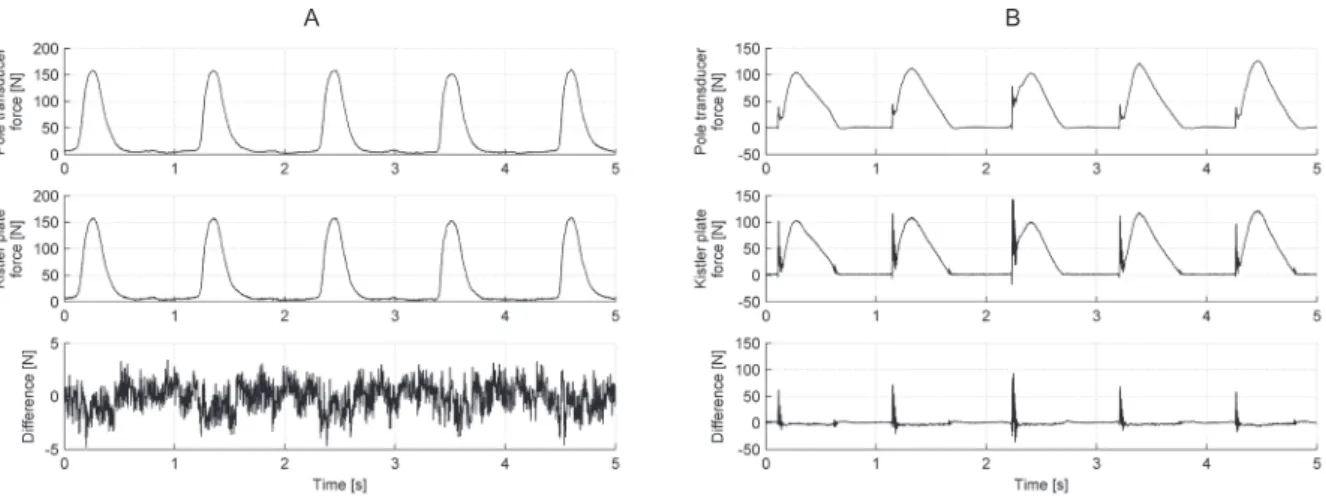
Four pieces of force transducer (two sets of poles) were calibrated and validated, and the results were similar. Calibration yielded linearity below 0.6% in the range 0–400 N. For validation, the poling cycles with peak poling force of about 150 N were imitated by alternate pressing of the pole. In the first case, the tip of the pole was continuously in contact with the force plate and no pole impact was occured (Figure 4a). The mean abso-lute error was 1.1 N and the maximum absoabso-lute error was 6.1 N. In the second case, the poling cycle con-tained the pole planting and pole take-off, thus an im-pact occured (Figure 4b). The mean absolute error was 3.0 N and the maximum absolute error was 162.7 N.
DISCUSSION
NW is a peculiar type of locomotion in that both the lower and upper limbs are used for propulsion. In a biomechanial or physiological study, it is important to measure the forces generated by the lower and upper limbs. Poling forces can be measured by means of force plates or by means of force tranducers mounted inside the poles.
Vähäsöyrinki et al. (2008) used a special 20 m long measurement system consisting of four tracks of par-allel series of force plates. This system was used for measurement of ski and poling forces during cross-country skiing and the great advantage was that it pro-vided force components in vertical and anterior-poste-rior directions. The disadvantages of this system were the small number of acquired cycles and the difficult changing of the track slope.
A measurement system based on single axial force tranducers inside the poles is lightweight and can be used in the laboratory on a treadmill or in fieldwork on an outdoor surface. First limitation is that single axial force tranducer provides only the value of poling force along the longitudinal axis of the pole. Value of force perpendicular to the longitudinal axis of the pole is not available. Another limitation is that longitudinal force components can not be determined using the system alone because the orientation of the longitudinal force along the line of travel is unknown. This problem can be overcome by tracking the inclinations of the poles using a three-dimensional videography (Svoboda, Stej-skal, Jakubec, & Krejčí, 2011) and then the longitudi-nal forces can be resolved into their orthogolongitudi-nal com-ponents (medial-lateral, anterior-posterior, normal). Then, by considering the slope and the velocity of progression, it is possible to calculate the mean power of poling action (Pellegrini, Bortolan, & Schena, 2011; Stöggl & Holmberg, 2011).
As a force transducer mounted inside the pole, a piezoelectric transducer (Millet et al., 1998; Nilsson et al., 2012) or a strain gauge transducer (Holmberg et al., 2005; Jensen et al., 2011; Lindinger & Holmberg, 2011; Lindinger et al., 2009; Pellegrini, Bortolan, & Schena, 2011; Schiffer et al., 2009; Stöggl & Holmberg, 2011) were used. The piezoelectric transducer has better dy-namic response but, on the other hand, it suffers from
drift. Zero level drift can reach the value of ± 0.01 N/s (Kuratle & Signer, 2006). It is possible to use the piezo-electric transducer for short-term measurement (sever-al poling cycles). We considered a 10 minute measure-ment that was necessary for comparing force variables with other physiological variables, e.g., oxygen uptake. Within this duration, the zero level could have drifted by 600 s · 0.01 N/s = 6 N. Such drift was unacceptable because it voided the detection of poling and recovery phases based on the level crossing technique. We chose a strain gauge tranducer instead.
The poles with force transducers are heavier than standard poles, so the question of systematic error aris-es. Schiffer, Knicker, Montanarella, and Strüder (2011) compared NW with standard poles and a NW with poles loaded by weights of 0.5 kg. There was no sta-tistically significant difference in the oxygen uptake or any EMG variable. Foissac, Berthollet, Seux, Belli, and Millet (2008) compared walking with hiking poles of different weights (240, 300, and 360 g). There was no statistically significant difference in the oxygen uptake as well, but there were differences in some EMG vari-ables. It seems that poles with force transducers do not cause considerable systematic error in the biomechani-cal or physiologibiomechani-cal variables. However, the weight of the force transducer should be as low as possible.
We validated our system in similar manner as pub-lished elsewhere (Holmberg et al., 2005; Lindinger & Holmberg, 2011; Lindinger et al., 2009). Values of mean absolute error (3.8%, 2.9%, and 3.8%, respective-ly) revealed in those studies are comparable with our validation values. However, it is not clear that the pub-lished values were calculated from poling cycles with or without pole impacts. Despite the mean absolute error seemingly acceptable, the instantaneous difference be-tween the pole transducer and force plate outputs can be significant. Force difference was caused by inertia and vibrating of the pole because the force transducer provided signal from a place below the pole grip and the force plate provided signal at the pole tip. The PPF variable can be influenced seriously but IPF, APF and ACPF variables incorporate summing of the force data, meaning that the rather large instantaneous difference has no such bad consequence.
Four force variables were defined in this paper. PPF describes only one point of the force-time curve dur-ing the poldur-ing phase, other points are not taken into account. So, PPF may not describe the effort of upper limbs but it could be used as a variable of shock load-ing of the upper limbs. Hagen, Hennig, and Stieldorf (2011) used accelerometry and showed that wrists are exposed to considerable shocks during NW. An in-creased injury risk to the upper limbs should be con-sidered.
APF and ACPF incorporate the IPF in the defini-tion formula. IPF itself as well as APF and ACPF use summing (integrating) of the points of force-time curve during the poling phase. Those variables consider all points in a specific manner and consequently they may describe the effort of the upper limbs better than PPF. The difference is that IPF uses no normalization of the sum result, APF normalizes the sum result by factor of PT and ACPF normalizes the sum result by factor of CT. In Figure 5 there are examples of poling actions demonstrating the difference between the variables. We can say that in case A, the effort of upper limbs is the lowest. In cases B and C, the efforts are the same and moderate. The effort is increased by increase of PT in case B or by decrease of CT (increase of CF) in case C. In case D, the effort is the highest and it is increased twice by an increase in PT and decrease of CT. IPF is proportional to PT but does not consider RT and con-sequently, it does not depend on CT proportionally. If IPF is calculated from the force component along the line of travel and then the value of IPF is multiplied by the velocity of progression, the result is physically the mechanical work generated by poling action within one cycle. Thus, IPF can be used as a variable of “ef-fort” of the upper limbs performed within one cycle. APF removes intrinsic dependence of IPF on PT by using PT as a denominator in the definition formula. APF is invariant to time and does not depend on ei-ther PT or CT. If APF changes, it must be due to a change in the force points and it means that PPF and/ or the shape of force-time curve changed. The ratio of APF/PPF can be used as a first step to characterize the shape of the force-time curve. ACPF depends on both PT via intrinsic dependence of IPF on PT and CT via the denominator in the definition formula. In fact, ACPF is proportional to RPT. If ACPF is calculated from the force component along the line of travel and then the value of ACPF is multiplied by the velocity of progression, the result is physically the mean mechani-cal power generated by the poling action. So, ACPF can be used as a variable of the mean “effort” of the upper limbs. The values of ACPF showed in Figure 5 reflect the above-mentioned level of effort.
CONCLUSIONS
telem-etry or data logger. Such modifications to the system enable the study of outdoor NW in field conditions.
We agree that it is important to measure the poling forces when the effects of NW on the biomechanical and physiological variables are studied. Understanding of the biomechanical and physiological aspects of the poling action can constitute a scientific basis for pro-moting, teaching and training of NW.
ACKNOWLEDGMENT
This study was supported by a research grant of the Ministry of Education, Youth, and Sports of the Czech Republic, No. MSM 6198959221, entitled “Physi-cal Activity and Inactivity of the Inhabitants of the Czech Republic in the Context of Behavioral Chang-es” and an internal grant of the Palacký University, No. FTK_2013:026.
REFERENCES
Church, T. S., Earnest, C. P., & Morss, G. M. (2002). Field testing of physiological responses associated with nordic walking. Research Quarterly for Exercise and Sport, 73(3), 296–300.
Foissac, M. J., Berthollet, R., Seux, J., Belli, A., & Mil-let, G. Y. (2008). Effects of hiking pole inertia on energy and muscular costs during uphill walking. Medicine & Science in Sports & Exercise, 40(6), 1117–1125.
Hagen, M., Hennig, E. M., & Stieldorf, P. (2011). Low-er and uppLow-er extremity loading in nordic walking in comparison with walking and running. Journal of Applied Biomechanics, 27(1), 22–31.
Holmberg, H. C., Lindinger, S., Stöggl, T., Eitzlmair, E., & Müller, E. (2005). Biomechanical analysis of double poling in elite cross-country skiers. Medicine & Science in Sports & Exercise, 37(5), 807–818. Jensen, S. B., Henriksen, M., Aaboe, J., Hansen, L.,
Si-monsen, E. B., & Alkjær, T. (2011). Is it possible to reduce the knee joint compression force during level walking with hiking poles? Scandinavian Journal of Medicine and Science in Sports, 21(6), e195–e200. Kuratle, R. H., & Signer, A. (2006). The basis of
piezo-electric measurement technology. Winterthur: Kistler Instrumente AG.
Lindinger, S. J., Stöggl, T., Müller, E., & Holmberg, H. C. (2009). Control of speed during the double pol-ing technique performed by elite cross-country ski-ers. Medicine & Science in Sports & Exercise, 41(1), 210–220.
Millet, G. Y., Hoffman, M. D., Candau, R. B., & Clif-ford, P. S. (1998). Poling forces during roller skiing: Effects of technique and speed. Medicine & Science in Sports & Exercise, 30(11), 1645–1653.
Morgulec-Adamowicz, N., Marszałek, J., & Jagustyn, P. (2011). Nordic walking – A new form of adapted physical activity (a literature review). Human Move-ment, 12(2), 124–132.
Nilsson, J., Tinmark, F., Halvorsen, K., & Arndt, A. (2013). Kinematic, kinetic and electromyographic adaptation to speed and resistance in double poling cross country skiing. European Journal of Applied Physiology, 113(6), 1385–1394.
Pellegrini, B., Bortolan, L., & Schena, F. (2011). Poling force analysis in diagonal stride at different grades in cross country skiers. Scandinavian Journal of Medi-cine and Science in Sports, 21(4), 589–597.
Schiffer, T., Knicker, A., Dannöhl, R., & Strüder, H. K. (2009). Energy cost and pole forces during nordic walking under different surface conditions. Medicine & Science in Sports & Exercise, 41(3), 663–668. Schiffer, T., Knicker, A., Hoffman, U., Harwig, B.,
Holl-mann, W., & Strüder, H. K. (2006). Physiological re-sponses to nordic walking, walking and jogging. Eu-ropean Journal of Applied Physiology, 98(1), 56–61. Schiffer, T., Knicker, A., Montanarella, M., & Strüder,
H. K. (2011). Mechanical and physiological effects of varying pole weights during nordic walking com-pared to walking. European Journal of Applied Physi-ology, 111(6), 1121–1126.
Stöggl, T., & Holmberg, H. C. (2011). Force interaction and 3D pole movement in double poling. Scandina-vian Journal of Medicine and Science in Sports, 21(6), e393–e404.
Svoboda, Z., Stejskal, P., Jakubec, A., & Krejčí, J. (2011). Kinematical analysis, pole forces and en-ergy cost of nordic walking – slope influence. Acta Universitatis Palackianae Olomucensis. Gymnica, 41(2), 27–34.
Tschentscher, M., Niederseer, D., & Niebauer, J. (2013). Health benefits of nordic walking: A systematic re-view. American Journal of Preventive Medicine, 44(1), 76–84.
Vähäsöyrinki, P., Komi, P. V., Seppälä, S., Ishikawa, M., Kolehmainen, V., Salmi, J. A., & Linnamo, V. (2008). Effect of skiing speed on ski and pole forces in cross-country skiing. Medicine & Science in Sports & Exercise, 40(6), 1111–1116.
VÝVOJ A VALIDACE SYSTÉMU PRO MĚŘENÍ OPOROVÝCH SIL U SEVERSKÉ CHŮZE
(Souhrn anglického textu)
ÚVOD: Severská chůze má potenciál stát se pohybo-vou aktivitou vhodnou pro širokou veřejnost pro pre-venci hromadných neinfekčních onemocnění. Rostou-cí popularita severské chůze zvyšuje zájem o vědecké poznatky o této pohybové aktivitě. Pro biomechanické a fyziologické studie je důležité znát, mimo jiné, i ča-sové průběhy oporových sil, které jsou produkovány svalstvem horní poloviny těla. Protože se nám nepoda-řilo najít komerčně nabízený měřicí systém vhodný pro tento účel, přistoupili jsme k vývoji a realizaci vlastního systému.
CÍL: Cílem studie byl vývoj a validace systému, který umožňuje kontinuální měření oporových sil v holích v průběhu severské chůze. Dále byl cílem vývoj soft-ware, který umožňuje poloautomatické zpracování na-měřených dat a výpočet časových a silových ukazatelů, jako je například doba opory o hůl a průměrná síla fáze opory o hůl.
METODIKA: Oporová síla v každé holi byla snímána pomocí jednoosého tenzometru umístěného pod ru-kojetí hole. Pro tento účel byly upraveny hole BIRKI z hliníkové slitiny. Výstupní signály tenzometrů byly zesíleny, převedeny pomocí AD převodníku a přená-šeny do osobního počítače. Vzorkovací frekvence byla 1000 Hz. Součástí měřicího systému je speciálně na-vržený software, který umožňuje zobrazení časových průběhů síly, ukládání do databáze a výpočet biome-chanických ukazatelů podle vzorců uvedených v této studii. Validace systému byla provedena s využitím piezoelektrické silové plošiny Kistler. Při validaci byly simulovány časové průběhy síly s maximální hodnotou síly kolem 150 N.
VÝSLEDKY: Výsledkem studie je funkční vzorek měři-cího systému. Výsledky validace ukázaly, že průměrná absolutní chyba je 1,1 N v případě odrazových cyklů bez rázů hole o podložku. V případě odrazových cyklů obsahující rázy hole o podložku je průměrná absolutní chyba 3.0 N.
ZÁVĚRY: Výsledky validace našeho systému odpoví-dají výsledkům podobných systémů používaných pro běžecké lyžování. Měřicí systém představuje nástroj, který může být použit při řešení celé řady otázek, které vyvstávají při hodnocení biomechanických a fyziologic-kých aspektů severské chůze.