Molecular analysis of multifocal prostate cancer cases
Rasa Sabaliauskaitė
1,
Donatas Petroška
2, 3,
Darius Dasevičius
2, 3,
Arvydas Laurinavičius
2, 3,
Feliksas Jankevičius
2, 4,
Juozas R. Lazutka
1,
Sonata Jarmalaitė
11 Faculty of Natural Sciences,
Vilnius University
2 Faculty of Medicine,
Vilnius University
3 National Centre
of Pathology, Vilnius
4 Urology Department,
Vilnius University Hospital Santariskiu Clinics, Vilnius, Lithuania
Correspondence to: Sonata Jarmalaitė, Division of Human Genome Re-search Centre, Faculty of Natural Sciences, Vilnius University, M. K. Čiur-lionio 21, Vilnius LT-03101, Lithuania. E-mail: sonata.jarmalaite@gf.vu.lt
Background. Prostate cancer (PCa) is usually a multifocal disease with different foci displaying histological and molecular heterogeneity. Biopsy-based pathology diagno-sis of PCa may not be representative of the entire tumour; thus, markers more pre-cisely characterizing every focus of multifocal PCa are highly instrumental for a better testing of PCa.
Materials and Methods. Two distant foci of prostate adenocarcinoma were ob-tained from prostatectomy specimens of ten patients with pT2–pT3 stage PCa. The expression of TMPRSS2 : ERG, TMPRSS2 : ETV1,and TERT was assessed by means of reverse transcription PCR and quantified using the real-time-based approach. Ki-67, ERG, EMA, AMACR, p16, and p53 expression was evaluated by means of immunohis-tochemistry (IHC) on tissue microarrays (TMA).
Results. Two out of ten cases were identified with different Gleason scores in paired foci of PCa. The expression of most of the IHC markers was quite even between TMA cores of each PCa case, with p16 showing the highest level of heterogeneity (44%; 4/9); 80% (8/10) of multifocal PCa expressed different variants of the TMPRSS2 : ERG tran-script or showed a varying status of fusion positivity in paired foci, and the expression levels of the transcript were also heterogeneous. Similarly, 90% (9/10) of PCa showed a different positivity for TERT expression in paired foci.
Conclusions. Measurement of TMPRSS2 : ERG and TERT expression offers a valu-able tool for identifying most aggressive tumour foci and selecting a relevant treat-ment of PCa.
Key words: prostate cancer, multifocality, TMPRSS2 : ERG, telomerase
INTRODUCTION
Prostate cancer (PCa), the most common cancer in men, usually is a multifocal disease with different foci display-ing a marked histological and molecular heterogeneity. More than 80% of prostates have been shown to possess two or more separate tumours at the time of clinical di-agnosis of PCa (1). Decision on PCa treatment is usually
aberra-tions and epigenetic changes, are extensively studied for an improved prognosis of PCa. Comparison of molecular profiles of multifocal PCa cases is also an important tool for a better understanding of the molecular basis of mul-ticlonal cancer.
In PCa, a frequent occurrence of gene fusion between the 5' untranslated region of TMPRSS2 (transmembrane protease, serine 2) and the 3' region of genes of the ETS family, including ERG (v-ets erythroblastosis virus E26 oncogene homolog (avian)) or ETV1 (ets variant 1), has recently been identified (4). Fusion of transcription fac-tors of the ETS family to androgen-inducible TMPRSS2 promoter causes an over-expression of these oncogenic proteins. The TMPRSS2 : ERG fusion is the most preva-lent form of fusions in PCa and is detectable in almost half of all PCa, independently of the stage or grade (4). Multifocal PCa may harbour different foci that may be TMPRSS2 : ERG positive or TMPRSS2 : ERG negative, and for identification of the fusion positivity information from all significant foci is indispensible. Several recent studies (5–9) showed significant associations between TMPRSS2 : ERG positivity and the aggressive course of PCa; thus, identification of TMPRSS2 : ERG status in pros-tate tumours may assist in the stratification of PCa cases for a relevant treatment.
Many other molecular alterations, in addition to TMPRSS2 : ETS fusions, have been discovered in PCa in the recent years. Inactivation of tumour suppressor genes, including PTEN, GSTP1,CDKN2A and TP53, as well as ac-tivation of oncogenic proteins ERG, MYC and telomerase, are among the most predominant molecular alterations identified in prostate tumours (10). For a better under-standing of the molecular basis of PCa, paired foci were selected from 10 cases with multifocal PCa. One of the foci from these pairs of tumours was included in our previous study (11) on a wide range of PCa molecular biomarkers; however, PCa multifocality was not addressed in that as-say. In the present study, we analyse the most informative genetic biomarkers selected during our previous investiga-tions and immunohistochemical biomarkers selected from recent publications (12–18) based on their diagnostic or prognostic value in PCa. The expression of fusion tran-scripts TMPRSS2 : ERG and TMPRSS2 : ETV1, reactivation of the catalytic subunit of telomerase (TERT), expression of the tumour suppressor proteins p16 (encoded by CD-KN2A) and p53 (encoded by TP53), expression of the on-cogenic transcription factor ERG, epithelial membrane an-tigen (EMA), and alpha-methylacyl coenzyme A racemase (AMACR) are analysed in the present study in paired foci of PCa cases. In addition, the cell proliferation marker Ki-67 and clinical variables (pT, Gleason score, preoperative PSA value) are assessed for their potential to characterise multifocal prostate tumours.
MATERIALS AND METHODS
Sample collection. Ten cases with multifocal tumours were selected from the large group of PSA-screened and biopsy-proven PCa cases collected during January 2008 – August 2009 at the Urology Department of the Vilnius University Hospital Santariskiu Clinics and treated by radical prosta-tectomy. The selection of cases was based on the availability of a sufficient amount of tumour tissue for the assessment of multiple biomarkers in two foci. Approval from the local Bioethics Committee had been obtained before initiating the study, and all patients gave informed consent for par-ticipation. After radical prostatectomy, unfixed prostate tis-sue was immediately transported to the Pathology Depart-ment. Adenocarcinoma was located by palpation, and cores of 0.8 cm in diameter were punched out by a large core in-strument with a circular blade. One of the two punches was taken from the right and the other from the left side of the prostate, or in some cases from the basal and apical regions of the same side. The distance between multifocal tumours was 3 mm or more. The taken core was immediately frozen in liquid nitrogen. Histological sections and the staining of the same core were performed by standard procedures and evaluated by a pathologist.
The selected cases were diagnosed with pT2–pT3 tu-mours and were graded mainly as having the Gleason score 6 or 7 (Table 1). The mean age of the group was 63.2 ± 1.6 years and the mean preoperative PSA level 6.0 ± 0.8 ng/ml (for one case this information was missing); one case (1/10) expe-rienced PSA-based (biochemical) progression during two months after surgery.
Tissue-arrays and immunohistochemistry.Tissue micro-arrays (TMA) were constructed from each patient’s archival formalin-fixed, paraffin-embedded donor block (DB) and were assembled in a recipient block (19, 20). The paraffin DB containing the largest focus of tumour was identified in a diagnostic haematoxylin / eosin stained slide. This slide was scanned with the Aperio ScanScope XT System (Aperio Technologies, Vista). The benign and cancer ar-eas were marked with annotations by the pathologist on a virtual slide. From this section, the corresponding regions on the paraffin DB were identified, enabling TMA cores to be taken using an automated tissue arrayer (3DHISTECH, TMA Master, Budapest, Hungary). The core diameter was 1.0 mm, with a depth of 3 mm.
Table 1.Comparison of TMPRSS2 : ERG (status, transcript variants and expression levels) and TERT expression in multifocal prostate tumours
Case
No. pT stage
Sample 1 Sample 2
Gleason score
Expression of TMPRSS2 : ERG
Expression of TERT (RT-PCR)
Gleason score
Expression of TMPRSS2 : ERG
Expression of TERT (RT-PCR) Type of
transcript
Expression level (QPCR)
Type of transcript
Expression level (QPCR)
1 pT3a 3 + 4 T1 / E4 and T2 / E4 1 Yes 3 + 3 T1 / E4 1 Yes
2 pT2c 3 + 3 T1 / E4 and T2 / E4 1 No 3 + 3 T1 / E4 2 Yes
3 pT2b 3 + 3 T1 / E4 and T2 / E4 1 No 3 + 4 T1 / E4 1 Yes
4 pT3b 3 + 4 T1 / E4 1 No 3 + 4 T1 / E4 2 Yes
5 pT2b 3 + 3 T1 / E4 1 No 3 + 3 T1 / E4 1 Yes
6 pT2b 3 + 3 T1 / E4 and T2 / E4 1 Yes 3 + 3 wt – No
7 pT2b 3 + 3 T1 / E1 1 No 3 + 3 T1 / E4 2 Yes
8 pT2b 3 + 3 T1 / E4 1 No 3 + 3 T1 / E4 and T2 / E4 1 Yes
9 pT2b 3 + 3 wt – No 3 + 3 T1 / E4 1 Yes
10 pT3a 3 + 4 T1 / E4 1 No 3 + 4 T1 / E4 and T2 / E4 2 Yes
QPCR – quantitative polymerase chain reaction; RT-PCR – reverse transcription polymerase chain reaction.
Differences between paired foci are marked in grey. For TMPRSS2 : ERG, heterogeneity of fusion status but not the variant transcripts are marked.
TMPRSS2 : ERGexpression levels: 1 – low level (>5.71); 2 – high level (<5.7); relative quantitation of the product was done using GAPDH as endogenous control.
using a prediluted antibody to EMA, p16, p53, AMACR, or in the Dako Techmate 500 system (Dako) for Ki-67 and in the DakoLink for ERG. IHC analysis was performed on 4
μ
m sections using DakoCytomation antibodies to the mo-noclonal mouse anti-human Ki-67 antigen, clone MIB-1; monoclonal mouse anti-human p53 antigen, clone DO-7; monoclonal mouse anti-human EMA antigen, clone E29; monoclonal mouse anti-human p16 antigen, clone E6H4 (CINtec Histology Kit). 3,3'-Diaminobenzidine was used as a chromogenic substrate. The prediluted antibody to rab-bit monoclonal TMPRSS2-ERG antigen (clone EPR3864; Epitomics) was processed with an EnVision FLEX system.All IHC slides were counterstained using haematoxylin. All stainings were performed with the subsequent positive control of an appropriate antibody.
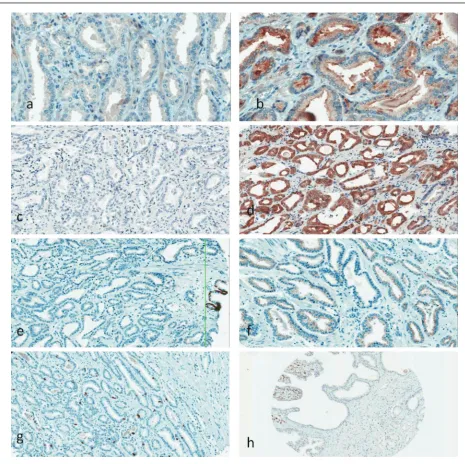
The expression of IHC biomarkers (Fig. 1) was evalu-ated in an appropriate site of a cell (nucleus, cytoplasm or membrane) and classified as positive or negative (value 1 or 2 in Table 2). Expression of AMACR was scored as negative (1), middle (2) or strong (3). The mean value of the Ki-67 proliferation index (PI) was calculated as the percentage of positively stained nuclei from all PCa nuclei in cores, and the range was evaluated as the largest difference between the PI of the two cores.
Table 2.Immunohistochemistry values and heterogeneity status
Case No.
Ki-67 ERG EMA p16 p53 AMACR
Mean,
% Range, % Value Hetero-geneity Value Hetero-geneity Value Hetero-geneity Value Hetero-geneity Value Hetero-geneity
1 8 1 – – 1 No 2 Yes 2 Yes 2 Yes
2 6 3 2 No 1 No 1 No 1 No 3 No
3 5 4 – – 1 No 2 No 1 No 3 No
4 2 4 2 No 1 No 2 No 1 Yes 3 No
5 1 1 2 No 1 No 2 Yes 1 No 2 No
6 1 7 1 No 1 No 2 No 1 No 2 No
7 7 6 2 No 2 No 2 Yes 1 No 3 No
8 2 1 1 No 1 No 2 No 1 No 3 No
9 9 1 2 No 1 No 2 Yes 1 No 3 No
Transcript identification by reverse transcription-PCR. Total RNA was extracted from the frozen tumour tissues by the phenol / chloroform method. Genomic DNA was removed by treatment with DNase I (Fermentas Thermo Scientific). RNA was dissolved in RNase-free water, and RNA quality was checked using electrophoresis on a 1% agarose gel; RNA was quantified on NanoDrop 1000 (Ther-mo Scientific).
For the reverse transcription-PCR (RT-PCR) analysis, the TMPRSS2 : ERG fusion transcript was amplified with the primers described by Tomlins et al. (21), covering the most frequently fused exons (exons 1–2 of TMPRSS2 and exon 4 of ERG): TMPRSS2 5'-CAGGAGGCGGAGGCGGA-3',
ERG 5'-GTAGGCACACGACTGG-3'. TMPRSS2 : ERG -neg-ative cases were additionally analysed for expression of the TMPRSS2 : ETV1 transcript. The primer pair (21) in-cluded the same sense TMPRSS2 gene primer as used in the TMPRSS2 : ERG assay and the antisense primer covering the exon 4 of ETV1 gene (5'-CAGGCCATGAAAACTT-3'). The GAPDH (glyceraldehyde-3-phosphate dehydroge-nase) gene was used as endogenous control for fused gene expression, and the product was amplified with the following primer set: univdirGAPDH 5'-CAAGGTCATC-CATGACAACTTTG-3' and univrevGAPDH 5'-GTCCAC-CACCCTGTTGCTGTAG-3'.
For detection of the TERT transcript, primers were selected from Boltze et al. (22): TERT-dir 5'-CGGAA-GAGTGTCTGGAGCAA-3', TERT-rev 5'-GGATGAAGCG-GAGTCTGGA-3'. As an additional control, TR was ampli-fied along with TERT, using the following set of primers: TR-dir 5'-CCTAACTGAGAAGGGCGTAGGC-3', TR-rev 5'-CTAGAATGAACGGTGGAAGGCG-3'.
In RT-PCR, 1 µg of total RNA from tissue was reverse-transcribed into cDNA using the Maxima® First Strand cDNA Synthesis Kit for RT-qPCR (Fermentas Thermo Scientific) in the final volume of 20 µl. The reverse tran-scription product was amplified on Mastercycler ep gradi-ent S (Eppendorf) in the following conditions: 95 °C for 4 min, followed by 94 °C for 1 min, annealing at 58 °C for 45 s and 72 °C for 45 s repeated 35 times, and the final elongation at 72 °C for 10 min. A negative control with-out reverse transcription was included for each sample, and multiple water controls were included in each run. RT-PCR products were resolved by electrophoresis on 2% agarose gels (Fig. 2). The presence of the RT-PCR product (TMPRSS2 : ERG, GAPDH, TERT or TR) was scored as positivity for the corresponding transcript (Table 1).
To identify the exact point of fusion, a set of TMPRSS2 : ERG transcripts of different length were se-quenced on a 3130XL Genetic Analyzer (Applied Biosys-tems) using a cloned product (InsTAclone™ PCR Cloning Kit; Fermentas Thermo Scientific) and the v2.0 kit (Applied Biosystems) for sequencing reaction. In sequence analysis, the nucleotide numbering of the TMPRSS2 gene is based on cDNA sequence with the GeneBank number NM_005656 and for the ERG gene NM_004449.
TMPRSS2 : ERG quantification. The fused gene expression
was quantified by using SYBR Green labelling and the pairs of primers described previously (21). The QPCR reaction was performed using Maxima™ SYBR Green QPCR Master
Mix (Fermentas Thermo Scientific), with 1 U/µl of Uracil-DNA Glycosylase (Fermentas Thermo Scientific), 300 mol/l forward and reverse primers in the total volume of 25 µl. The PCR cycles on the ABI Prism 7500 Fast Real-time PCR System (Applied Biosystems) consisted of 50 °C for 2 min, 95 °C for 10 min, followed by 95 °C for 15 s and 60 °C for 1 min, repeated in 40 cycles, and the melting step. Threshold cycle (ct) values for each sample were generated during the exponential phase of QPCR, and ∆ct values were calculated using GAPDH as an internal control. According to the me-dian Δct value, the expression level of the TMPRSS2 : ERG transcript was dichotomized into high (<5.7) and low (>5.71; Table 1).
Statistical analysis. Statistical analysis was carried out using GagraphPad InStat software. Correlations were evalu-ated by Spearman’s test. Two-sided Fisher’s exact test was used for comparison of categorical values and the Mann– Whitney test for continuous values. The p value <0.05 was considered significant.
RESULTS
Clinical and IHC characteristics of paired foci. A total of 20 tumour foci from 10 radical prostatectomy specimens were analysed in our study. Eight pairs of multifocal tu-mours had an identical Gleason score, while two cases had tumours with different Gleason scores (Table 1). The expression of most of the IHC markers was quite even be-tween TMA cores of each PCa case. EMA and ERG were homogeneously expressed in all pairs of cores (9/9 and 7/7, respectively; Table 2). TMA pairs showed a less uni-form expression of p53 and AMACR proteins: 2 out of 9 (22%) and 1 out of 9 (11%) TMA pairs showed expres-sion heterogeneity, respectively. Four out of 9 (44%) TMA pairs were heterogeneous according to positivity for the Fig. 2. Example of TMPRSS2 : ERG analysis by RT–PCR in two prostate tumour foci (A and B). ‘+’ in
p16 protein. The Ki-67 PI range variation was from 1% to 7% among cores when the Ki-67 PI mean value was 1–9% among different cases. No statistically significant correla-tions were identified between the status of heterogeneity of a particular IHC marker and TMPRSS2 : ERG, TERT ex-pression or PCa clinical variables. However, an association was observed between the occurrence of TMPRSS2 : ERG fusion and immunohistohemically detectable expression of ERG: two out of seven PCa cases were negative for ERG expression in IHC (Table 2), and both cases showed a low production of the TMPRSS2 : ERG transcript in the QPCR assay or were negative for TMPRSS2 : ERG in RT-PGR (Table 1).
Genetic characteristics of paired foci. Overall, 18 out of 20 tumour foci expressed the TMPRSS2 : ERG fusion product. TMPRSS2 : ERG expression was detected in 8 PCa in both foci, while two cases expressed the fusion transcript only in one focus (2 / 10; 20% heterogeneity for the fusion status). No TMPRSS2 : ETV1 transcript was detected in these two foci. According to the type of TMPRSS2 : ERG transcripts, the fu-sion between the first exon of TMPRSS2 and the fourth exon
of ERG prevailed (85%) in our study; 11 (55%) foci expressed
T1 / E4 as a single transcript and 6 foci together with the T2 / E4 transcript variant (30%). One case was identified with the T1 / E1 transcript in the first focus and with the T1 / E4 in the second focus. An identical set of TMPRSS2 : ERG tran-scripts was detected in paired foci from two prostate carcino-mas; thus, the heterogeneity of the fusion isoform was 75% (6/8). Assessment of the TMPRSS2 : ERG transcript expres-sion levels revealed an additional level of heterogeneity. No-table differences (p < 0.0001) were identified between paired foci, with only 4 out of 8 pairs showing a similar intensity of fusion expression (Table 1). Thus, the heterogeneity of the transcription level was 50%.
Measurement of TERT expression was also helpful in verifying the molecular heterogeneity of multifocal tu-mours: only one case of PCa had an identical status for TERT expression in both foci (90% heterogeneity; Table 1). Expression of the TERT transcript was predominant in TMPRSS2 : ERG-positive foci with 100% (11 / 11) of TERT -positive cases concurrently having the fusion transcript (Table 1); however, the association was not statistically sig-nificant. Similarly, foci with low TMPRSS2 : ERG expression levels (50%; 7 / 14) were negative for TERT, while the cases showing a high TMPRSS2 : ERG expression (100%; 4 / 4) were also TERT-positive.
One case (No. 10) of biochemical disease progression was identified in this pilot study. A high TMPRSS2 : ERG expression level as well as positivity for TERT transcript were detected in one tumour focus, while another focus showed a low production of TMPRSS2 : ERG transcript and was TERT-negative.
DISCUSSION
Multifocal PCa has been reported in up to 91% of all cases of radical prostatectomy (1, 2). Some investigators (reviewed in 1) have reported that increased numbers of tumour foci and larger volumes of index and nonindex tumours are correlated with a more aggressive outcome of PCa. However, the currently approved PCa biomark-ers, including the preoperative PSA value, are not potent predictors of multifocality, and sensitive markers for the identification of multifocal PCa are highly instrumen-tal. In our study, 8 out of 10 pairs of foci from multifocal PCa expressed different variants of the TMPRSS2 : ERG transcript or showed a variable status of fusion positiv-ity. Similarly, 90% of multifocal tumours showed a distinct status of TERT expression (positive or negative) in both foci. Different Gleason scores were identified in two PCa cases, but most of the IHC biomarkers showed low levels of heterogeneity between the foci.
The morphological difference of tumours is mainly characterized by the Gleason score. Arora et al. (23) showed that only 9 of 100 prostatectomy specimens had the same Gleason score in all the foci studied. In another study (24), more than half of prostates contained at least three differ-ent grades of cancer, and the number of differdiffer-ent grades increased with increasing tumour volume. In our study, different Gleason scores were identified in two pairs of tumours with multifocal PCa. The cell proliferation index, determined by Ki-67 expression, was 1–9% among different cases of PCa, and a certain variation (up to 7%) was ob-served in paired PCa tissues. Other IHC biomarkers, except p16, showed quite a homogeneous expression in separate foci; 44% of paired tumour foci had a varying p16 expres-sion. There are limited data in the literature on the hetero-geneity of IHC markers in PCa. Borre et al. (25) reported some level of heterogeneity of the p53 protein expression in prostate tissue. Our study on the ERG protein expression, conducted in a larger group of PCa cases (Petroska et al., unpublished data) supports the findings of the present as-say about a substantial level of ERG homogeneity in multi-focal PCa.
studies evaluated the TMPRSS2 : ERG expression level or assessed fusion variants. In our study, using RT-PCR and QPCR, a high heterogeneity of TMPRSS2 : ERG transcripts was detected, and the expression levels also differed among the foci. In our study, 6 out of 8 pairs of tumours from multi-focal PCa expressed different variants of TMPRSS2 : ERG, and two additional pairs showed a varying status of fusion positivity. Notably, several recent studies (5–9) have shown significant associations between TMPRSS2 : ERG positiv-ity and the aggressive course of PCa. Expression of specific splice variants of TMPRSS2 : ERG or occurrence of fusion duplication (6, 7, 9) were shown as indicators of aggressive PCa behaviour; thus, identification of TMPRSS2 : ERG -pos-itive foci in prostate tumours may assist in predicting the clinical outcome of the disease.
In our study, some association was identified between the expression of TERT, encoding the main subunit of telomerase, and tumour positivity for TMPRSS2 : ERG which suggests a possible association between these two oncogenic transcripts involved in prostate pathogenesis. Telomerase is a reverse transcriptase responsible for the elongation of chromosomal ends or telomeres. Telom-eres are important components of molecular pathways involved in cell senescence and the control of the cell cy-cle. In PCa, telomerase activity has been detected in 47% to 100% of PCa cases (28). We used a RT-PCR-based ap-proach for detecting the transcript and identified TERT in 11 of 20 (55%) tumour foci of PCa patients. Our results are in line with the data of other studies (29, 30) and for the first time show a considerable heterogeneity of multifo-cal prostate tumours according to TERT expression. A re-cent study (31) has revealed that human prostate tumours contain a cancer progenitor cell subpopulation which can be indicated by an elevated telomerase activity. The ag-gressiveness of tumour foci is significantly influenced by the amount of progenitor cells which can be evaluated by measuring TERT expression.
One case of biochemical progression was identified among multifocal tumours involved in our study. Results of molecular tests suggested an aggressive outcome based on the assessment of one focus, while another focus showed a non-aggressive molecular pattern – a low production of TMPRSS2 : ERG transcript and negativity for TERT. In this particular case, molecular analysis of two foci from multi-focal PCa provided more accurate data on the possible bio-logical behaviour of the tumour than those expected from the analysis of a single focus.
CONCLUSIONS
Our study revealed pronounced levels of heterogene-ity in the expression of oncogenic transcripts related to prostate carcinogenesis in separate tumour foci from PCa
patients. IHC biomarkers were less heterogeneous in the PCa of these cases. The application of molecular tests, particularly measurement of TMPRSS2 : ERG and TERT expression, offers a valuable tool for the identification of most aggressive tumour foci and selection of a relevant PCa treatment.
ACKNOWLEDGEMENTS
The study was supported by the Lithuanian State Science and Studies Foundation (grant C-03/2007).
Received 2 December 2011 Accepted 23 December 2011
References
1. Andreoiu M, Cheng L. Multifocal prostate cancer: biologic, prognostic, and therapeutic implications. Hum Pathol. 2010; 41(6): 781–93.
2. Meiers I, Waters DJ, Bostwick DG. Preoperative pre-diction of multifocal prostate cancer and application of focal therapy: review 2007. Urology. 2007; 70(6 Suppl): 3–8.
3. Karavitakis M, Ahmed HU, Abel PD, Hazell S, Win-kler MH. Tumor focality in prostate cancer: implica-tions for focal therapy. Nat Rev Clin Oncol. 2011; 8(1): 48–55.
4. Tomlins SA, Bjartell A, Chinnaiyan AM, Jenster G, Nam RK, Rubin MA, Schalken JA. ETS gene fusions in prostate cancer: from discovery to daily clinical prac-tice. Eur Urol. 2009; 56(2): 275–86.
5. Nam RK, Sugar L, Yang W, Srivastava S, Klotz LH, Yang LY et al. Expression of the TMPRSS2 : ERG fu-sion gene predicts cancer recurrence after surgery for localized prostate cancer. Br J Cancer. 2007; 97(12): 1690–5.
6. Hu Y, Dobi A, Sreenath T, Cook C, Tadase AY, Ravin-dranath L et al. Delineation of TMPRSS2-ERG splice variants in prostate cancer. Clin Cancer Res. 2008; 14(15): 4719–25.
7. Wang J, Cai Y, Yu W, Ren C, Spencer DM, Ittmann M. Pleiotropic biological activities of alternatively spliced TMPRSS2 / ERG fusion gene transcripts. Cancer Res. 2008; 68(20): 8516–24.
8. Demichelis F, Fall K, Perner S, Andrén O, Schmidt F, Setlur SR et al. TMPRSS2 : ERG gene fusion associated with lethal prostate cancer in a watchful waiting cohort. Oncogene. 2007; 26(31): 4596–9.
10. Joshua AM, Evans A, Van der Kwast T, Zielenska M, Meeker AK, Chinnaiyan A, Squire JA. Prostatic pre-neoplasia and beyond. Biochim Biophys Acta. 2008; 1785(2): 156–81.
11. Sabaliauskaite R, Jarmalaite S, Petroska D, Dasevicius D, Laurinavicius A, Jankevicius F, Lazutka JR. Expression of TMPRSS2 : ERG and TERT identifies a subgroup of prostate carcinomas with increased risk of biochemical recurrence (manuscript).
12. Rubin MA, Bismar TA, Andrén O, Mucci L, Kim R, Shen R et al. Decreased A-methylacyl CoA racemase expression in localized prostate cancer is associated with an increased rate of biochemical recurrence and cancer-specific death. Cancer Epidemiol Biomarkers Prev. 2005; 14(6): 1424–32.
13. Burke PA, Gregg JP, Bakhtiar B, Beckett LA, Denar-do GL, Albrecht H et al. Characterization of MUC1 glycoprotein on prostate cancer for selection of target-ing molecules. Int J Oncol. 2006; 29(1): 49–55.
14. Nariculam J, Freeman A, Bott S, Munson P, Cable N, Brookman-Amissah N et al. Utility of tissue microar-rays for profiling prognostic biomarkers in clinically localized prostate cancer: the expression of BCL-2, E-cadherin, Ki-67 and p53 as predictors of biochemical failure after radical prostatectomy with nested control for clinical and pathological risk factors. Asian J Androl. 2009; 11(1): 109–18.
15. Kufe DW. Mucins in cancer: function, prognosis and therapy. Nat Rev Cancer. 2009; 9(12): 874–85.
16. Kumaresan K, Kakkar N, Verma A, Mandal AK, Singh SK, Joshi K. Diagnostic utility of α-methylacyl CoA racemase (P504S) and HMWCK in morphologi-cally difficult prostate cancer. Diagn Pathol. 2010; 5: 83. 17. Park K, Tomlins SA, Mudaliar KM, Chiu YL, Esgueva R,
Mehra R et al. Antibody-based detection of ERG rear-rangement-positive prostate cancer. Neoplasia. 2010; 12(7): 590–8.
18. Falzarano SM, Zhou M, Carver P, Tsuzuki T, Simmer-man K, He H, Magi-Galluzzi C. ERG gene rearrange-ment status in prostate cancer detected by immunohis-tochemistry. Virchows Arch. 2011; 459(4): 441–7. 19. Rubin MA, Dunn R, Strawderman M, Pienta KJ.
Tis-sue microarray sampling strategy for prostate cancer biomarker analysis. Am J Surg Pathol. 2002; 26(3): 312–9.
20. Dancau AM, Simon R, Mirlacher M, Sauter G. Tissue microarrays. Methods Mol Biol. 2010; 576: 49–60. 21. Tomlins SA, Rhodes DR, Perner S, Dhanasekaran SM,
Mehra R, Sun XW et al. Recurrent fusion of TMPRSS2 and ETS transcription factor genes in prostate cancer. Science. 2005; 310(5748): 644–8.
22. Boltze C, Mundschenk J, Unger N, Schneider-Stock R, Peters B, Mawrin C et al. Expression profile of the
telo-meric complex discriminates between benign and ma-lignant pheochromocytoma. J Clin Endocrinol Metab. 2003; 88(9): 4280–6.
23. Arora R, Koch MO, Eble JN, Ulbright TM, Li L, Cheng L. Heterogeneity of Gleason grade in multifocal adenocarcinoma of the prostate. Cancer. 2004; 100(11): 2362–6.
24. Aihara M, Wheeler TM, Ohori M, Scardino PT. Het-erogeneity of prostate cancer in radical prostatectomy specimens. Urology. 1994; 43(1): 60–6.
25. Borre M, Stausbol-Gron B, Overgaard J. p53 accumu-lation associated with bcl-2, the proliferation marker MIB-1 and survival in patients with prostate cancer subjected to watchful waiting. J Urol. 2000; 164(3 Pt 1): 716–21.
26. Barry M, Perner S, Demichelis F, Rubin MA. TMPRSS2-ERG fusion heterogeneity in multifocal prostate cancer: clinical and biological implications. Urology. 2007; 70(4): 630–3.
27. Mehra R, Han B, Tomlins SA, Wang L, Menon A, Was-co MJ et al. Heterogeneity of TMPRSS2 gene rearrange-ments in multifocal prostate adenocarcinoma: mo-lecular evidence for an independent group of diseases. Cancer Res. 2007; 67(17): 7991–5.
28. Meeker AK. Telomeres and telomerase in prostatic in-traepithelial neoplasia and prostate cancer biology. Urol Oncol. 2006; 24(2): 122–30.
29. Latil A, Vidaud D, Valeri A, Fournier G, Vidaud M, Li-dereau R et al. htert expression correlates with myc over-expression in human prostate cancer. Int J Cancer. 2000; 89(2): 172–6.
30. Kamradt J, Drosse C, Kalkbrenner S, Rohde V, Lensch R, Lehmann J et al. Telomerase activity and telomerase subunit gene expression levels are not re-lated in prostate cancer: a real-time quantification and
in situ hybridization study. Lab Invest. 2003; 83(5): 623–33.
Rasa Sabaliauskaitė, Donatas Petroška, Darius Dasevičius, Arvydas Laurinavičius, Feliksas Jankevičius, Juozas R. Lazutka, Sonata Jarmalaitė
DAUGIAŽIDININIŲ PROSTATOS NAVIKŲ MOLEKULINIAI TYRIMAI
Santrauka
Įvadas.Prostatos navikai (PN) dažniausiai yra daugiažidininiai,
nes histologiškai ir molekuliniu profiliu besiskiriantys naviko ži-diniai formuojasi iš karto keliose prostatos srityse. Prostatos vėžio diagnozė grindžiama patologiniu biopsijos mėginio tyrimu, ta-čiau šis mėginys neretai neatspindi visų piktybėjimo židinių cha-rakteristikų. Tiksliam ligos eigos prognozavimui būtini žymenys, apibūdinantys individualius daugiažidininius PN ir įvertinantys jų agresyvumą.
Medžiagos ir metodai. Dešimtyje daugiažidininių pT2 ir
pT3 stadijos navikų tirta po du nutolusius navikinius židinius. TMPRSS2 : ERG, TMPRSS2 : ETV1 ir TERT raiška nustatyta
at-virkštinės transkripcijos PGR, kiekybinei raiškai įvertinti naudotas realaus laiko PGR metodas. Ki-67, ERG, EMA, AMACR, p16 ir p53 baltymų raiška tirta imunohistochemiškai audinių mikrogardelėse.
Rezultatai. Skirtingos diferenciacijos pagal Gleason skalę
na-viko židiniai nustatyti dviejuose iš dešimties daugiažidininių PN. Daugumos imunohistocheminių (IHC) žymenų raiška buvo ho-mogeniška skirtinguose to paties naviko židiniuose, tačiau 44 % (4 iš 9) PN nustatyta skirtinga p16 baltymo raiška. 80 % (8 iš 10) daugiažidininių PN nustatyti TMPRSS2 : ERG raiškos skirtu-mai – sulietinio transkripto izoformų įvairovė, skirtingas raiškos intensyvumas arba transkriptas buvo nustatomas tik viename ži-dinyje. 90 % (9 iš 10) PN pasižymėjo skirtinga TERT raiška tirtuo-se poriniuotirtuo-se židiniuotirtuo-se.
Išvados. TMPRSS2 : ERG ir TERT transkriptų nustatymas gali
būti naudojamas aptinkant agresyvius PN židinius, taip pat siekiant parinkti tinkamiausią gydymo strategiją.
Raktažodžiai: prostatos vėžys, daugiažidininiai navikai,