Electronic Journal of Plant Breeding, 3(3): 932-938 (Sep 2012) ISSN 0975-928X
http://sites.google.com/site/ejplantbreeding 932
Research Note
Correlation Coefficient and Path Coefficient Analysis for Yield Components
in Groundnut (
Arachis hypogaea
L.)
C. A. Babariya1 and K. L. Dobariya*2
1 M.sc.(Agri.) student, Dept. of Genetics and Plant Breeding, JAU, Junagadh 2 Research Scientist (Groundnut), Main Oilseeds Research Station, JAU, Junagadh
E-mail:[email protected]
(Received: 11 Aug 2012; Accepted: 03 Sep 2012)
Abstract
The study was undertaken to estimate correlation coefficients and direct and indirect effects by path analysis for pod yield per plant and its components by using 100 genotypes of Spanish bunch groundnut. The pod yield per plant was significantly and positively correlated with days to maturity, plant height, number of pods per plant, kernel yield per plant, number of mature pods per plant, 100-kernel weight, biological yield per plant and harvest index. Biological yield per plant and harvest index exhibited high and positive direct effects on pod yield per plant. Whereas, kernel yield per plant, number of pods per plant and days to maturity showed moderate and positive direct effects on pod yield per plant. Thus, these characters were identified as the most important yield components and due emphasis should be placed on these characters while selecting for high yielding genotypes in Spanish bunch groundnut.
Keywords: Character association, Path analysis, Groundnut.
Groundnut (Arachis hypogaea L.) is one of the principal economic oilseed crops of the world. The groundnut kernels contain about 44-55% oil, 22-32% protein and 8-14% carbohydrates in addition to minerals and vitamins. Since the economic yield is contributed by the pods formed under the ground, the yield potential of groundnut is known only when the crop is harvested. It is almost difficult to predict pod yield based on aerial morphological characters (Weiss, 2000). Therefore, the choice of directly or indirectly yield-related traits is highly useful for breeders. The different components of yield very often exhibit considerable degree of association among themselves and with the yield. Searle (1965) suggested that the average merit of a character in a population could be changed by means of selection programme based on the basis of phenotype of the main trait concerned. However, such an improvement would be more reliable if indirect selection based on another trait correlated with it is made. Understanding the relationships among yield and yield components is of paramount importance for making the best use of these relationships in selection. The correlation coefficient may be confounded with indirect effect due to common association inherent in trait interrelationships. The applicability of correlation can be more clearly
understood by path analysis, which allows the partitioning of correlation in direct and indirect effects and is, therefore, a valuable tool in breeding programmes (Dewey and Lu, 1959; Gomes and Lopes, 2005). Keeping this fact in view, present study was undertaken to estimate phenotypic and genotypic correlations and path coefficients of important agronomic traits on pod yield per plant to formulate an efficient selection strategy (Patel and Shelke, 1992; Awatade et al., 2009; Raut et al. 2010).
The experimental material comprised one hundred genotypes of Spanish bunch (Arachis hypogaea ssp. fastigiata var. vulgaris) groundnut. The genotypes were collected from the germplasm maintained at J. A. U., Junagadh and D. G. R., Junagadh. The selected genotypes consisted of released varieties as well as breeding lines developed at different sources like 48 from Gujarat, 14 from Maharashtra, 5 from Rajasthan, 10 from Karnataka, 3 from Tamil Nadu, 14 from Andhra Pradesh and one each from Punjab, Uttar Pradesh, China, Nigeria, USA and Argentina.
Electronic Journal of Plant Breeding, 3(3): 932-938 (Sep 2012) ISSN 0975-928X
http://sites.google.com/site/ejplantbreeding 933
of 45 cm. x 10 cm. The observations were recorded on five randomly selected plants from each entry and replication for fifteen different characters. The observations were recorded on 15 characters viz., days to 50% flowering, days to maturity, plant height (cm), number of secondary branches per plant, number of pegs per plant, number of pods per plant, number of mature pods per plant, sound mature kernels (%), 100-kernel weight (g), kernel yield per plant (g), pod yield per plant (g), shelling out-turn (%), biological yield per plant (g), harvest index (%) and oil content (%). The mean values were used for the statistical analysis. The phenotypic and genotypic correlation coefficients for pair of the characters were worked-out through covariance analysis as per Al-Jibouri et al. (1958). The genotypic path coefficient analysis was done as per the method suggested by Dewey and Lu (1959) by using Window Stat Ver. 7.5 software programme.
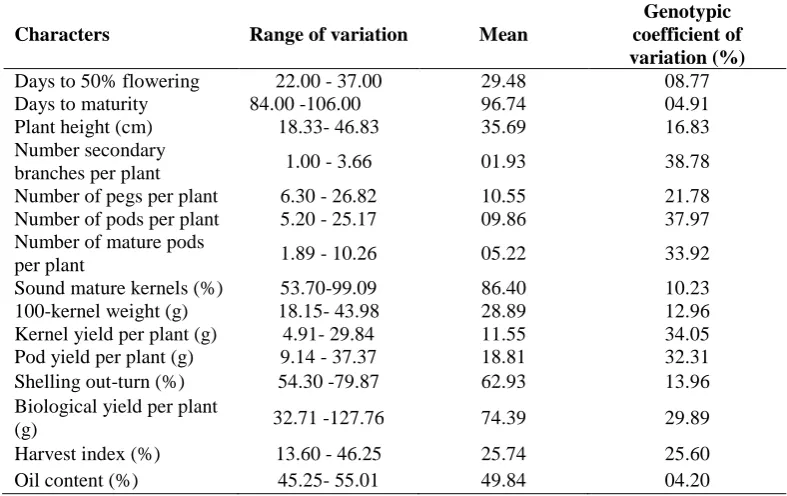
The analysis of variance revealed the presence of sufficient amount of genetic variability among the genotypes for all the 15 characters studied (Table I).
The highest genotypic coefficient of variation was observed for number of secondary branches per plant (38.78%) followed by number of pods per plant (37.97%), kernel yield per plant (34.05%), number of mature pods per plant (33.92%), pod yield per plant (32.31%), biological yield per plant (29.89%), harvest index (25.60%) and number of pegs per plant (21.78%). The plant height (16.83%), shelling out-turn (13.96%), and 100-kernel weight (12.96%) had moderate value, while sound mature kernels (10.23%), days to 50% flowering (8.77%), days to maturity (4.91) and oil content (4.20%) exhibited very low genotypic coefficient of variation (Table I).
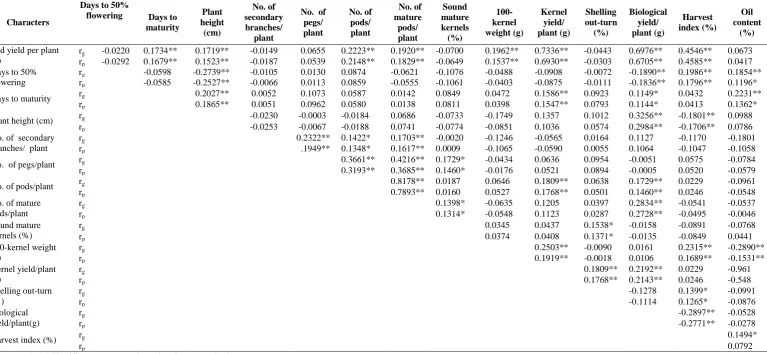
In general, the values of genotypic correlation (rg) were higher than their corresponding phenotypic correlation (rp) indicating that though there was high degree of association between two variables at genotypic level, its phenotypic expression was deflated by the influence of environment (Table II). It has also indicated that there was an inherent relationship between the characters studied which is in agreement with the conclusions of Awatade et al.
(2009) and Vekariya et al. (2010).
The pod yield per plant was found to be significantly and positively correlated with days to maturity, plant height, number of pods per plant, kernel yield per plant, number of mature pods per plant, 100-kernel weight, biological yield per plant and harvest index at both genotypic and phenotypic levels (Table II). Such positive interrelationship had been reported earlier in
groundnut (Vaithiyalingan et al., 2010; Vekariya et al., 2010; Pradhan et al., 2011; Channayya et al.
2011; Raut et al., 2010; Giri et al., 2009. Thus, on the basis of correlations, these characters can be considered as the most crucial characters influencing pod yield in groundnut and needs to be given due importance in selection to achieve higher pod yield. The days to 50% flowering had positive and significant correlation at both genotypic and phenotypic levels with harvest index and oil content suggesting that the selection for early flowering is likely to provide high harvest index and oil content in groundnut. Jayalakshami et al. (2000) reported positive association between days to 50% flowering and harvest index, while John et al. (2009) observed positive and significant correlation between days to 50% flowering and oil content in groundnut. Further, the days to 50% flowering registered significant and negative genotypic and phenotypic relationships with plant height and biological yield per plant. The results suggested that the selection for early flowering will result in reduced plant height and lower biological yield per plant in groundnut. Sonone and Thaware (2009) observed significant negative correlation between plant height and biological yield per plant. In the present study, days to maturity showed significant positive correlation at both genotypic and phenotypic levels with plant height, kernel yield per plant, biological yield per plant and oil content. Thus, the selection for late maturity may result in increased plant height, kernel yield per plant, biological yield per plant and oil content in groundnut. Sonone and Thaware (2009) reported positive and significant correlation of days to maturity with plant height, kernel yield per plant, biological yield per plant and oil content. The association of plant height with biological yield per plant was found significantly positive at both genotypic and phenotypic levels, while the same was significant but negative with harvest index. It can be concluded from the results that an increase in plant height may result in higher biological yield per plant but, the harvest index may get reduced. Vekariya et al. (2010) and Pradhan et al. (2011) also observed positive and significant association of plant height with biological yield per plant in groundnut.
Electronic Journal of Plant Breeding, 3(3): 932-938 (Sep 2012) ISSN 0975-928X
http://sites.google.com/site/ejplantbreeding 934
improved pod yield. The number of pegs per plant had significant and positive association with number of pods per plant, number of mature pods per plant and sound mature kernels. The results indicated that such type of relationship of number of pegs per plant will ultimately result in increased pod yield per plant.
In the present study, number of pods per plant registered positive and significant genotypic and phenotypic correlations with kernel yield per plant, number of mature pods per plant and biological yield per plant. This indicated that the selection for increased pods per plant may give higher number of mature pods per plant, kernel yield per plant and biological yield per plant and thus, may contribute in increasing the pod yield per plant. Similar results had been reported by Awatade et al. (2009), Meta and Monpara (2010), Raut et al. (2010), Vekariya et al.
(2010) and Giri et al. (2009). Similarly, a strong association of number of mature pods per plant with sound mature kernels and biological yield per plant indicated that the selection towards increased number of mature pods per plant will lead to higher number of sound mature kernels and biological yield per plant in groundnut. Thus, an increase in sound mature kernels will, in turn, result into higher shelling out-turn as also indicated by strong association between sound mature kernels and shelling out-turn. Similar results had been reported by Vaithiyalingan et al.
(2010) and Vekariya et al. (2010). The present results showed significant positive genotypic and phenotypic correlations of 100-kernel weight with harvest index and kernel yield per plant, while its association was found significantly negative with oil content. It can be inferred from the results that the selection for larger kernels may increase kernel yield per plant and harvest index but, will result in reduced oil content. Similar results had been reported by Jayalakshami et al. (2000) in groundnut.
A strong relationship was also observed between kernel yield per plant and shelling out-turn and biological yield per plant at both genotypic and phenotypic levels. As these three characters are interrelated and also had strong genotypic association with pod yield per plant, the improvement in one component will automatically result in improvement in another component and finally the pod yield. Similar results have been reported by Meta and
Monpara(2010), Vekariya et al. (2010) and Pradhan
et al. (2011). In the present study, positive relationship was established between shelling out-turn and harvest index at both genotypic and phenotypic levels and between harvest index and oil
content at genotypic level only. Whereas, strong
negative relationship was observed between
biological yield per plant and harvest index. The results thus, suggested that an increase in shelling out-turn may give rise to higher harvest index, while an increase in biological yield per plant may result in reduced harvest index in groundnut. Mane et al.
(2008) reported positive relationship between
shelling out-turn and harvest index, while
Jayalakshami et al. (2000) observed positive
relationship between harvest index and oil content. The present results on correlation coefficient thus, revealed that the number of pods per plant, kernel yield per plant, number of pegs per plant, number of mature pods per plant, 100-kernel weight, days to maturity, biological yield per plant and harvest index were the most important yield attributes and may contribute considerably towards higher pod yield in groundnut. The interrelationship among yield components would help in increasing the yield levels and therefore, more emphasis should be given to these components while selecting better plant types in groundnut.
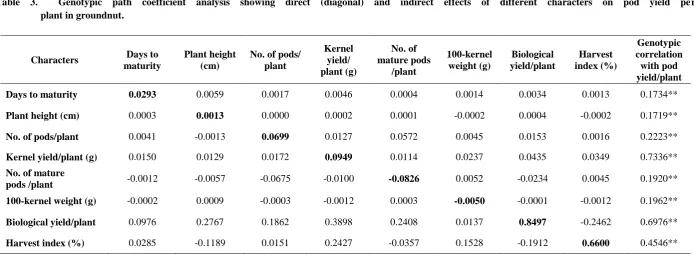
In view of the fact that correlation coefficients do not
take into account extremely complex
interrelationships between various characters, path coefficient analysis was applied to partition the correlation into direct and indirect effects. The path coefficient analysis revealed that the biological yield per plant (0.8497) and harvest index (0.6600) exhibited high and positive direct effects on pod yield per plant (Table III). Whereas, kernel yield per plant (0.0949), number of pods per plant (0.0699) and days to maturity (0.0293) showed moderate and positive direct effects on pod yield per plant. Thus, these characters turned-out to be the major components of pod yield and direct selection for these traits may be rewarding for yield improvement. Similar results had been reported by Awatade et al. (2009), Vekariya et al. (2010) and Raut et al. (2010). The plant height exhibited low and positive direct effect (0.0013) towards pod yield. Low and positive direct effect of plant height on pod yield had been reported by Raut
et al. (2010). The number of mature pods per plant (-0.0826) and 100-kernel weight (-0.0050) exerted negative direct effects towards pod yield per plant as observed earlier by Patel and Shelke (1992).
References
Electronic Journal of Plant Breeding, 3(3): 932-938 (Sep 2012) ISSN 0975-928X
http://sites.google.com/site/ejplantbreeding 935
Awatade, S. M.; Thaware B. L.; Jadhav, B. B. and Gaikwad, K. J. 2009. Correlation, path and diversity analysis in groundnut. J. Maharashtra Agric. Univ.,35: 29-31.
Channayya, H.; Nadaf, H. L.; Ganapathi, M, and Praveenkumar, B. 2011. Induced mutants in groundnut (Arachis hypogaea L.). Karnataka J. Agric. Sci., 23(2): 327-329
Dewey, D. R. and Lu, K. H. 1959. A correlation and path coefficient analysis of components of crested wheat grass seed production. Agron. J., 51: 511-518.
Giri, R. R.; Toprope, V. N. and Jagtap, P. K. 2009. Genetic variability, character association and path analysis for yield and its component traits in groundnut. Int. J. Pl. Sci., 4: 551-555.
Gomes, R. L. F. and Lopes, A. C. A. 2005. Correlation and path analysis in peanut. Crop Breed. Appl. Biotech., 5: 105-112
Jayalakshmi, V.; Reddy, C. R. and Reddy, G. L. (2000). Character association among morpho-physiological attributes in parental genotypes and groundnut hybrids. Legume Res., 23: 102-105. John, K.; Vasanthi, R. P. and Venkateswarlu, O. 2009.
Studies on variability and character association in Spanish bunch groundnut (Arachis hypogaea L.).
Legume Res., 32:123-125.
Mane, P. S.; Lad, D. B. and Jagtap, P. K. 2008. Correlation and path coefficient analysis in summer bunch groundnut. J. Maharashtra Agric. Univ., 33: 174-176.
Meta, H. R. and Monpara, B. A. 2010. Genetic variation and trait relationships in summer groundnut,
Arachis hypogaea L. J. Oilseeds Res.,27(1): 8-11 Patel, M. P. and Shelke, V. B. 1992. Path analysis in
pre-monsoon groundnut. GAU Res. J.,17: 79-81. Pradhan, K. and Patra, R. K. 2011. Variability and
correlation studies on groundnut (Arachis hypogaea L.) germplasm. Legume Res.,34: 51-56
Raut, R. D., Dhaduk, L. K. and Vachhani, J. H. 2010. Character association and path coefficient analysis in F2 generation of groundnut (Arachis
hypogaea L.). Int. J. of Agri. Sci.,1: 305-310. Searle, S.R. 1965. The value of indirect selection. I. Mass
selection. Biometrrics, 21: 682-707
Sonone, N. G. and Thaware, B. L. 2009. Study on genetic diversity in groundnut. Annl. Plant Physiol.,23: 54-56 .
Vaithiyalingan, M., Manoharan, V. and Ramamoorthi, N. 2010. Association analysis among the yield and yield attributes of early season drought tolerant groundnut (Arachis hypogaea L.). Electron. J. Plant Breed.,1: 1347-1350.
Vekariya, H. B., Khanpara, M. D., Vachhani, J. H., Jivani, L. L., Vagadiya, K. J. and Revar, H. J. 2010. Correlation and path analysis in bunch groundnut (Arachis hypogaea L.). Intl. J. Plant Sci.,6: 11-15.
Electronic Journal of Plant Breeding, 3(3): 932-938 (Sep 2012) ISSN 0975-928X
http://sites.google.com/site/ejplantbreeding 936
Table 1. The analysis of variance and genotypic coefficients of variation for 15 characters in groundnut.
Characters Range of variation Mean
Genotypic coefficient of variation (%)
Days to 50% flowering 22.00 - 37.00 29.48 08.77
Days to maturity 84.00 -106.00 96.74 04.91
Plant height (cm) 18.33- 46.83 35.69 16.83
Number secondary
branches per plant 1.00 - 3.66 01.93 38.78
Number of pegs per plant 6.30 - 26.82 10.55 21.78
Number of pods per plant 5.20 - 25.17 09.86 37.97
Number of mature pods
per plant 1.89 - 10.26 05.22 33.92
Sound mature kernels (%) 53.70-99.09 86.40 10.23
100-kernel weight (g) 18.15- 43.98 28.89 12.96
Kernel yield per plant (g) 4.91- 29.84 11.55 34.05
Pod yield per plant (g) 9.14 - 37.37 18.81 32.31
Shelling out-turn (%) 54.30 -79.87 62.93 13.96
Biological yield per plant
(g) 32.71 -127.76 74.39 29.89
Harvest index (%) 13.60 - 46.25 25.74 25.60
Oil content (%) 45.25- 55.01 49.84 04.20
Electronic Journal of Plant Breeding, 3(3): 932-938 (Sep 2012) ISSN 0975-928X
http://sites.google.com/site/ejplantbreeding 937
Table 2. Genotypic (rg) and phenotypic (rp) correlation coefficients among 15 characters in groundnut.
Characters
Days to 50%
flowering Days to maturity
Plant height (cm)
No. of secondary branches/
plant
No. of pegs/ plant
No. of pods/ plant
No. of mature pods/ plant
Sound mature kernels (%)
100-kernel weight (g)
Kernel yield/ plant (g)
Shelling out-turn (%)
Biological yield/ plant (g)
Harvest index (%)
Oil content
(%)
Pod yield per plant (g)
rg -0.0220 0.1734** 0.1719** -0.0149 0.0655 0.2223** 0.1920** -0.0700 0.1962** 0.7336** -0.0443 0.6976** 0.4546** 0.0673 rp -0.0292 0.1679** 0.1523** -0.0187 0.0539 0.2148** 0.1829** -0.0649 0.1537** 0.6930** -0.0303 0.6705** 0.4585** 0.0417 Days to 50%
flowering
rg -0.0598 -0.2739** -0.0105 0.0130 0.0874 -0.0621 -0.1076 -0.0488 -0.0908 -0.0072 -0.1890** 0.1986** 0.1854** rp -0.0585 -0.2527** -0.0066 0.0113 0.0859 -0.0555 -0.1061 -0.0403 -0.0875 -0.0111 -0.1836** 0.1796** 0.1196*
Days to maturity rg 0.2027** 0.0052 0.1073 0.0587 0.0142 0.0849 0.0472 0.1586** 0.0923 0.1149* 0.0432 0.2231**
rp 0.1865** 0.0051 0.0962 0.0580 0.0138 0.0811 0.0398 0.1547** 0.0793 0.1144* 0.0413 0.1362*
Plant height (cm) rg -0.0230 -0.0003 -0.0184 0.0686 -0.0733 -0.1749 0.1357 0.1012 0.3256** -0.1801** 0.0988
rp -0.0253 -0.0067 -0.0188 0.0741 -0.0774 -0.0851 0.1036 0.0574 0.2984** -0.1706** 0.0786
No. of secondary branches/ plant
rg 0.2322** 0.1422* 0.1703** -0.0020 -0.1246 -0.0565 0.0164 0.1127 -0.1170 -0.1801
rp .1949** 0.1348* 0.1617** 0.0009 -0.1065 -0.0590 0.0055 0.1064 -0.1047 -0.1058
No. of pegs/plant rg 0.3661** 0.4216** 0.1729* -0.0434 0.0636 0.0954 -0.0051 0.0575 -0.0784
rp 0.3193** 0.3685** 0.1460* -0.0176 0.0521 0.0894 -0.0005 0.0520 -0.0579
No. of pods/plant rg 0.8178** 0.0187 0.0646 0.1809** 0.0638 0.1729** 0.0229 -0.0961
rp 0.7893** 0.0160 0.0527 0.1768** 0.0501 0.1460** 0.0246 -0.0548
No. of mature pods/plant
rg 0.1398* -0.0635 0.1205 0.0397 0.2834** -0.0541 -0.0537
rp 0.1314* -0.0548 0.1123 0.0287 0.2728** -0.0495 -0.0046
Sound mature kernels (%)
rg 0.0345 0.0437 0.1538* -0.0158 -0.0891 -0.0768
rp 0.0374 0.0408 0.1371* -0.0135 -0.0849 0.0441
100-kernel weight (g)
rg 0.2503** -0.0090 0.0161 0.2315** -0.2890**
rp 0.1919** -0.0018 0.0106 0.1689** -0.1531**
Kernel yield/plant (g)
rg 0.1809** 0.2192** 0.0229 -0.961
rp 0.1768** 0.2143** 0.0246 -0.548
Shelling out-turn (%)
rg -0.1278 0.1399* -0.0991
rp -0.1114 0.1265* -0.0876
Biological yield/plant(g)
rg -0.2897** -0.0528
rp -0.2771** -0.0278
Harvest index (%) rg 0.1494*
rp 0.0792
Electronic Journal of Plant Breeding, 3(3): 932-938 (Sep 2012) ISSN 0975-928X
http://sites.google.com/site/ejplantbreeding 938
Table 3. Genotypic path coefficient analysis showing direct (diagonal) and indirect effects of different characters on pod yield per plant in groundnut.
Characters Days to
maturity
Plant height (cm)
No. of pods/ plant
Kernel yield/ plant (g)
No. of mature pods
/plant
100-kernel weight (g)
Biological yield/plant
Harvest index (%)
Genotypic correlation
with pod yield/plant
Days to maturity 0.0293 0.0059 0.0017 0.0046 0.0004 0.0014 0.0034 0.0013 0.1734**
Plant height (cm) 0.0003 0.0013 0.0000 0.0002 0.0001 -0.0002 0.0004 -0.0002 0.1719**
No. of pods/plant 0.0041 -0.0013 0.0699 0.0127 0.0572 0.0045 0.0153 0.0016 0.2223**
Kernel yield/plant (g) 0.0150 0.0129 0.0172 0.0949 0.0114 0.0237 0.0435 0.0349 0.7336**
No. of mature
pods /plant -0.0012 -0.0057 -0.0675 -0.0100 -0.0826 0.0052 -0.0234 0.0045 0.1920**
100-kernel weight (g) -0.0002 0.0009 -0.0003 -0.0012 0.0003 -0.0050 -0.0001 -0.0012 0.1962**
Biological yield/plant 0.0976 0.2767 0.1862 0.3898 0.2408 0.0137 0.8497 -0.2462 0.6976**
Harvest index (%) 0.0285 -0.1189 0.0151 0.2427 -0.0357 0.1528 -0.1912 0.6600 0.4546**