movement in field trip by visualizing the log data
Nahye Cho
aand Youngok Kang
ba Department Social Studies, Ewha Womans University, Seoul, South Korea; [email protected] b Department Social Studies, Ewha Womans University, Seoul, South Korea; [email protected]
Abstract: A numerous log data in addition to user input data are being generated as mobile and web users continue to in-crease recently, and the studies in order to explore the patterns and meanings of various movement activities by making use of these log data are also rising rapidly. On the other hand, in the field of education, people have recog-nized the importance of field trip as the creative education is highlighted. Also, the examples which utilize the mo-bile devices in the field trip in accordance to the development of information technology are growing. In this study, we try to explore the patterns of student’s activity by visualizing the log data generated from high school students’ field trip with mobile device.
Keywords: log data, spatio-temporal pattern, geovisualization, space-time cube, field trip, mobile device
1. Introduction
A numerous log data in addition to user input data are being generated as the use of mobile and web continues to increase recently, and the studies in order to explore the patterns and meanings of various movement activities by making use of these log data are also rising rapidly. For example, there are log data such as the data recorded in the server when users access the internet homepage, the data generated from the use of traffic and credit cards, and the GPS data related to the taxi and car driving, etc.. Especially, in recent lots of researchers are trying to explore new information or meanings by analyzing the log data in addition to user input data as the use of mobile devices such as cell phone continues to soar. More specifically, in recent the studies in order to seek the meanings by visualizing and exploring the log data multi-dimensionally are increasing by making use of spatio-temporal log data generated from various sensors installed in mobile devices.
On the other hand, in the field of education, the use of mobile devices in the field trip is also growing as the importance of the field trip is getting stand out. Giemza et al. (2010), Giemza (2013), Butchart et al. (2013), Kang and Cho (2015) have conducted the studies related to the authoring tools which support the field trip by utilizing the mobile program. In their studies, they classified the field activities into three phases such as preparation, field activity, and post activity and then proposed the construction of mobile system that one can make the plan for the activity in the preparation phase, execute the activity in the field activity phase and identify the activity results in the post activity phase. However, there is no study which apply to the field of education by analyzing these log data generated from field trip with mobile devices. In this study we try to explore the patterns of student’s activities by visualizing the log data generated
2. Literature Review
Log data are defined as the data recorded in the server as a trace of users who access the web and mobile devices (Hwang et al. 2012). Numerous researches which utilize the log data generated from web have been conducted in the areas of marketing (Byun 2002; Jun 2002; Sujatha and Punithavalli 2012; Kim 2014), information retrieval (Park and Joo 2013; Shin et al. 2014; Nicholas et al. 2014), and learning analysis (Cho and Kim 2013). On the other hand, as the use of mobile phone has been soared, lots of studies have also been conducted in order to analyze the patterns of individual movement by utilizing the GPS data installed in the cell phone, and to analyze the life pat-terns such as personal exercise, relationship with friends, and sleeping hours, and to predict the area of activity by utilizing the sensor data installed in the cell phone (Mafrur et al. 2015; Montoliu et al. 2013). The researchers have mainly applied the data mining method which includes association analysis, classification analysis, clustering, trend analysis, and regression analysis to analyze log data.
identify the movement and density patterns by region by visualizing the movement trajectory of the vessel for one month. Fang and Lu (2011) analyzed the level of the air pollution in the city by visualizing the air pollution data. In this study they showed the level of the air pollution by time period by using space-time cube and compared the “Land Use Regression” method with ”Spatial Interpolation” method in order to check which visualization method is more accurate.
If we review the studies that visualize the spatio-temporal dimension of the log data, there are several ways such as 2D point mapping, Kernel density estimation, and 3D visualization in order to visualize the spatio-temporal dimension of the log data. The existing 2D point mapping has a shortcoming to handle the big data. The Kernel density estimation has a weakness to represent the temporal data while it has an advantage to show the data density and clustering of various points. On the other hand 3D geo-visualization has a big advantage to visualize the spatial pat-tern, the spatial relationship, and the change by time to make one understand intuitively the complex spatio-temporal patterns (Rinner 2004; Kristensson et al. 2009). Up to now there are two 3D geo-visualization methods such as space-time scan statistics and space time cube in the world. One can use the space-time scan statistics method that the clusters are expressed as a cylinder in a map. The cylinders represent the space (position) and time (height) in a map. On the other hand, one can use the space time cube method, which express the spatio-temporal data in a cube map (Kristensson et al. 2009), to identify the spatio-temporal patterns through both the space time density analysis and the hot spot analysis (Rinner 2004; Kristensson et al. 2009). Softwares for space time cube analysis are ESRI’s ArcPro, geo-time software, and pyprocessing (Rinner 2004).
3.
Research Methodology
3.1 Subject and Activity of Field Trip
In this study we intend to explore the patterns of student’s activity by visualizing the log data generated from high school students’ field trip with mobile device in Yang-dong village in Korea. The Yang-Yang-dong village is registered as a world heritage because the village has maintained large scale traditional Korean-style houses, called Hanok, up to now since Chosun dynasty. However, there has been reasonable amount of changes in Yang-dong village, changing from residential house to commercial store or remodeling from old Korean-style to modern Western style, as lots of people are visiting in this village after being registered as a world heritage. Students have gone through the field exploration activities with the subject of sustainable development of Yang-dong village. That is, after students keep an eye on the change of the house since Yang-dong village is registered as a world heritage, they have to think about which can be changed and which should not be changed. Students have to perform three things to explore this subject as follow: First, students have to observe all
houses in Yang-dong village whether the house is maintaining the old functions or not and whether the house is traditional house of Chosun dynasty or new house of modern era. Second, students have to take a picture and write a memo for every things that need to be changed or preserved. Third, students have to do interviews with residents if necessary.
3.2 Creation and Processing of Log Data
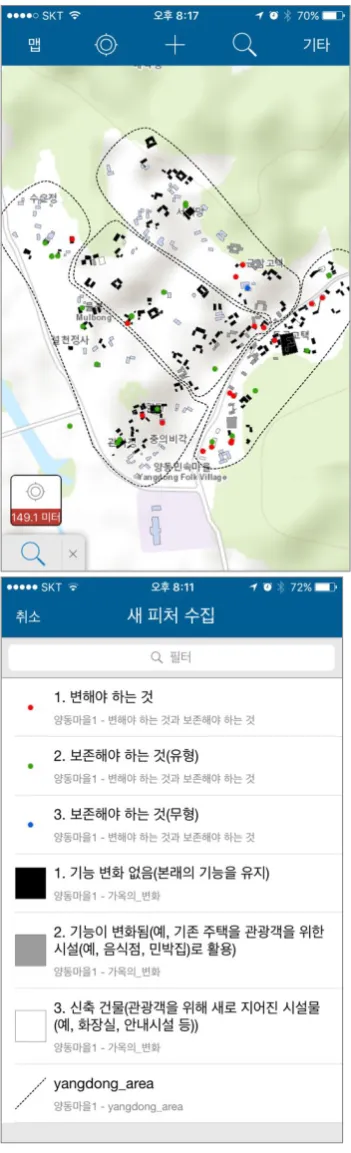
Students have to work out the answer for the question of exploration activity by utilizing smart pad in the field. They have used ‘collector for ArcGIS’ as a mobile program. In the phase of preparation, we set up the domain by creating geodatabase in ArcMap10.3 and create attribute and time field of each feature class, and linked the geo-database domain with time field. Created data are published through ArcGIS online and shared by using web map.
In the phase of field activity students have worked out the answer for the questions of exploration activity by using iPad with the installation of ‘Collector for ArcGIS’ app. All data acquired by students by using Collector for ArcGIS are stored in ArcGIS online which provides cloud computing environment. However, the answer and the photography that students have entered are stored, but the movement trajectory of students are not stacked up. In this study we have utilized mini camcorder as an auxiliary apparatus in order to confirm the process of student’s exploration activity and to extract the activity log. The log data which include time, latitude, longitude, altitude, speed, course, slope, and distance and the video files which contain the actual field trip performed from twelve forty to fifteen ten PM on 17 June in 2016 are stored in the mini camcorder with GPS function (Figure 2). The total number of log data created for 2 hours 30 minutes that the actual exploration activity has been per-formed are 31,329.
Fig. 2. Log data collected from mini-camcorder
We have taken three steps to proceed the log data collected from mini camcorder with the installation of GPS. First, we transformed the format of the collected log data which is .nmea into .txt file by using GPS Visualizer and then transformed the .txt file into .csv file by using Excel. In the case of spatial data, we transformed the .csv file in-to the .shp file and then defined the projection. In the case of attribute data we transformed the time field format into yyyy-mm-dd, hh:mm:ss format so that one could recognize the time field in GDB and interlinked it with the time domain of GDB. Second, we set up the necessary items in the .csv file for the analysis and filtered out the data. After that, we cleansed the log data by eliminating the unnecessary data with errors or beyond the scope of the investigation. Third, we visualized the transformed and cleansed data into 3D by using space-time cube.
Fig. 3. Data Proceeding Process
3.3 Visualization of Log Data Generated from the Field Trip
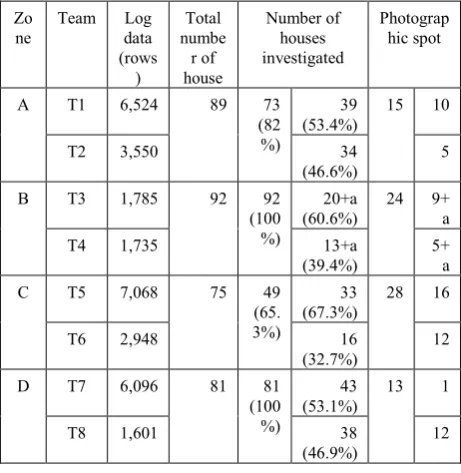
Total of 17 students who belong to the first and the second year of high school are divided into 8 teams and then each team has performed the field investigation in Yang-dong village. We separated Yang-dong village into four zones and assigned two teams to investigate one zone (Figure 4). Students received the iPad and mini camcorder at the center of Yang-dong village, called Muchumdang, and started to investigate the zone where each team has a re-sponsibility. After finishing the investigation, all students get together at the entrance of Yang-dong village, located in the middle-bottom at the map. All investigated data such as log data, the number of total houses, the number of houses investigated, and the photographic spot are summarized in Table 1 and displayed as a map in Figure 4. The achievement rate is the ratio between the total number of houses and the number of houses investigated. The achievement rates of B and D zone are 100% while the ones of A and C are 82% and 65.3%, respectively. The data showed that there were total of 80 photographic spots. 65% of photographic spots belongs to zone B and C and team 3 and 4 took more photographs.
Zo
ne Team Log data (rows ) Total numbe r of house Number of houses investigated Photograp hic spot
A T1 6,524 89 73
(82 %)
39
(53.4%) 15 10
T2 3,550 34
(46.6%) 5
B T3 1,785 92 92
(100 %)
20+a
(60.6%) 24 9+a
T4 1,735 13+a
(39.4%) 5+a
C T5 7,068 75 49
(65. 3%)
33
(67.3%) 28 16
T6 2,948 16
(32.7%) 12
D T7 6,096 81 81
(100 %)
43
(53.1%) 13 1
T8 1,601 38
(46.9%) 12
Fig. 4. Four zone in Yang-dong village (before investigation : left, after investigation : right)
Figure 5 shows 2D and 3D visualization based on the log data generated from each student team. The hot spot zone is defined as the spot that each team has stayed more than 3 minutes within 50m. We can confirm that the hot spots are surfaced on the course of movement by time period. The movement patterns are different from each team and we can find a tendency that hot spots are shown on the places where there are more houses or more exploration activities.
4.
Research Results
According to our analysis of log data and video data, the places where each team stayed more than 3 minutes are surface on the hot spots. We recognize that hot spots are usually surface on the places where houses are dense or photography and interview are needed, respectively. In addition to these general hot spots, lots of hot spots are shown in many different cases as follow: First, each team needs to make a judgement whether there are any functional changes in actual usage or not even though the outside appearance has not been changed at all. Second, each team want to take a rest or want to have its own time like taking a water or food, charging the battery, taking a picture, using SNS, watching soccer game etc. Third, students need to have a discussion and share the information (App instructions, other team’s activity, considerations during working out the answer, etc.), find some interesting things (puppy, vending machine, supermarket, beautiful scene, etc.), and have some problems in Wi-Fi and devices.
Fig. 6. Case that photographic place is surfaced on the hot spot.
Fig. 7. Case that the hot spot is surfaced on the place in which is not related to the investigation zone
We can identify that the hot spots are surfaced on not only the places where students conduct their investigation to work out the answer, but also the places where students spend their time with the activity which is not related to the investigation. According to our video analysis, the team 1, 2, 5, 6, and 8 who have investigated zone A, C, and D, respectively, where more hot spots are shown, show their interests in the activity not related to the investigation activity such as taking a photograph, accessing SNS, taking a rest, and watching soccer game, etc.. On the other hand, in case of team 3 and 4 who have investigated zone B, we can identify that the hot spots are surfaced weakly because they have focused on inputting the answer (average 3 minutes). As a result, they finished their investigation activity earlier than other team. So we can take a note that team 3 and 4 have conducted their job very well by focusing on the investigation activity during field trip.
5.
Discussion and Conclusion
student’s activities by analyzing the log data generated from student’s field trip activity which are interlinked with both the data that students get an answer and the log data generated from other students in the same region
6.
Acknowledgements
This work was supported by the National Research Foundation of Korea Grant funded by the Korean Government (NRF-2014S1A5B6037290).
7.
References
Butchart, B., Pope, A., King, M., Hamilton, G., Terzis, P., & Koutroumpas, M. (2013). Fieldtrip GB: Creating a customizable mapping and data capture app for the HEFE community, Paper presented at GISRUK 2013, Liverpool, United Kingdom.
Byun, S. E. (2002). Efficient Web Site Management Strategy by Analyzing Log Data-Focus on the ABC Jeans Company case. The Journal of e-Business, 3(1), 99-124.
Cho, I. H. & Kim, J. H. (2013). Investigation of Statistically Significant Period for Achievement Prediction Model in e-Learning. Journal of Educational Technology. 29(2). 285-306.
Demšar, U., & Virrantaus, K. (2010). Space–time density of trajectories: exploring spatio-temporal patterns in movement data. Inter-national Journal of Geographical Information Science, 24(10), 1527-1542.
Fang, T. B., & Lu, Y. (2011). Constructing a Near Real‐
time Space‐time Cube to Depict Urban Ambient Air
Pollution Scenar-io. Transactions in GIS, 15(5), 635-649.
Ferreira, N., Poco, J., Vo, H. T., Freire, J., & Silva, C. T. (2013). Visual exploration of big spatio-temporal urban data: A study of New York City taxi trips. IEEE Transactions on Visualization and Computer Graphics, 19(12), 2149-2158.
Giemza, A., Bollen, L., Seydel, P., Overhagen, A., & Hoppe, H. U. (2010, April). LEMONADE: a flexible authoring tool for integrat-ed mobile learning scenarios. In Wireless, Mobile and Ubiquitous Technologies in Education (WMUTE), 2010 6th IEEE Interna-tional Conference on (pp. 73-80). IEEE.
Giemza, A. (2013). Mobilogue–a tool for creating and conducting mobile supported field trips. QScience Proceedings, (12th World Conference on Mobile and Contextual Learning [mLearn 2013), 5.
Hwang, M. G., Lee, S. M., & Seo, J. M. (2012). A Study on Life-log Analysis and Monitoring System for Disabled Person Using Smart Media. Journal of the Korea Society of Computer and Information, 17(8), 99-106.
Jun, H. C. (2002). A study on web shopping mall user behavior using log files: W. cosmetic mall case. Korea Advanced Institute of Science and Technology.
Kang, Y. O., & Cho, N. H. (2015). A Preliminary Study for Developing an Authoring Tool for Field-Experience
Learning using Mo-bile Device. Journal of Korea Spatial Information Society, 23(3), 123-132.
Kim, J. K. (2014). A Novel Recommendation Approach Based on Chronological Cohesive Units in Contents Consuming Logs. Sungkyunkwan University.
Kristensson, P. O., Dahlback, N., Anundi, D., Bjornstad, M., Gillberg, H., Haraldsson, J., ... & Stahl, J. (2009). An evaluation of space time cube representation of spatiotemporal patterns. IEEE Transactions on Visualization and Computer Graphics, 15(4), 696-702. Mafrur, R., Nugraha, I. G. D., & Choi, D. (2015).
Modeling and discovering human behavior from smartphone sensing life-log data for identification purpose. Human-centric Computing and Information Sciences, 5(1), 1-18.
Montoliu, R., Blom, J., & Gatica-Perez, D. (2013). Discovering places of interest in everyday life from smartphone data. Multimedia tools and applications, 62(1), 179-207.
Nicholas, D., Clark, D., Jamali, H. R., & Watkinson, A. (2014). Log Usage Analysis: What it Discloses about Use, Information Seeking and Trustworthiness. INTERNATIONAL JOURNAL OF KNOWLEDGE CONTENT DEVELOPMENT and TECHNOLOGY, 4(1), 23-37.
Park, N. H., & Joo, K. H. (2013). Log based keyword extraction and spread based clustering for an efficient information searching. International Journal of Software Engineering and Its Applications, 7(6), 201.
Rinner, C. (2004). Three-dimensional visualization of activity-travel patterns. Proc. of the Munster GI Days, 231-237.
Shin, S. M., Yi, T. S., & Kim, H. S. (2014, July). An Analysis of a Convergence Utilization Field of Technology based on Usage Log in Information Service. In International Conference on Convergence Technology (Vol. 4, No. 1, pp. 967-968).