Translation from the collaborative OSM database to
cartography
Flora Hayat
aa Université Paris-Diderot-Paris VII, Michelin Travel Partner, Paris, France ; flora.hayat@univ-paris-diderot.fr
Abstract: The OpenStreetMap (OSM) database includes original items very useful for geographical analysis and for creating thematic maps. Contributors record in the open database various themes regarding amenities, leisure, transports, buildings and boundaries. The Michelin mapping department develops map prototypes to test the feasibility of mapping based on OSM. To translate the OSM database structure into a database structure fitted with Michelin graphic guidelines a research project is in development. It aims at defining the right structure for the Michelin uses. The research project relies on the analysis of semantic and geometric heterogeneities in OSM data. In that order, Michelin implements methods to transform the input geographical database into a cartographic image dedicated for specific uses (routing and tourist maps). The paper focuses on the mapping tools available to produce a personalised spatial database. Based on processed data, paper and Web maps can be displayed. Two prototypes are described in this article: a vector tile web map and a mapping method to produce paper maps on a regional scale. The vector tile mapping method offers an easy navigation within the map and within graphic and thematic guide- lines. Paper maps can be partly automatically drawn. The drawing automation and data management are part of the mapping creation as well as the final hand-drawing phase. Both prototypes have been set up using the OSM technical ecosystem.
Keywords: Collaborative database, OpenStreetMap, automated cartography, edition
1.
Introduction
In 2011, the mapping department of Michelin answered to the following question: could the OpenStreetMap (OSM) database be used to produce a Michelin paper plan of Clermont-Ferrand city on a 1/12,000 scale?
To publish the map, archivists, cartographers and engineers have cooperated. The project was thought as a proto- type of the first Michelin plan based on open data which are under the ODbL licence. It was required to depict, as much as possible, road names, public facilities and a selection of buildings of interest.
Three distinctive features explain the choice to use this open data source. First, the database covers the world and provides significant inputs on local scales. Then, the data is accessible thanks to the Open Database Licence. Finally, numerous online and offline editing tools (ID and JOSM) are dedicated to the OSM project (Chilton, 2009). The OpenStreetMap project gathers multiple activities focusing on map tools and database management. It seems that the open source and collaborative framework supports technological and graphical innovations.
The purpose of my research activities follows up this first release. I produce web and paper maps prototypes based on OSM database. I wonder to what extent the OSM data can be used for any mapping purpose from world web maps to regional or local papers maps. Moreover, my research activity in Michelin is applied to various themes related to mobility and tourism. I make the assumption that the OSM project can enable these kinds of mapping. I conduct this work as a Ph.D. student within a partnership based on an agreement with Michelin and the
laboratory Géographie-Cités1.My academic research is partly drawn on a direct practical application within Michelin.
Michelin is a worldwide French tire manufacturer. The company has expanded its activities by publishing plans, Atlases and travel guides. Most of the Michelin publications are well known for their graphical guidelines (for roads) and for their tourist selection. Michelin's plans, maps and travel guides follow a same editorial line: providing a better mobility. Graphical and thematic choices are based on this editorial line.
At this stage of my studies I observe that to produce a map, based on OSM data, the production context of the database and its technological ecosystem have to be fully understood. This paper describes this production context. This paper focuses on the graphic results that can be achieved. The mapping methods deployed in Michelin are based on the understanding of the contributing process. The OSM data are stored in a specific structure. Another structure can be designed to serve a mapping usage. Part of the research activity described in this paper aims at de- fining a proper structure for the Michelin uses. The central focus of the paper is to depict the Michelin usage of the OSM database and the tools developed for its usage.
1 CIFRE agreements: The ANRT, the French national association
2.
Using OpenStreetMap for cartography
In the OSM database, the number of geographical objects and their attributes is growing day by day. Data is up- loaded into the OSM database by contributors who describe freely the attributes of the objects they create or alter.
The choice of the element (node, way or relation) describing the shape of the geographical object is free as well. The liberty of choice regarding the use of geometry, a node or a way, has important consequences in the definition of graphic guidelines and the global visual harmony.
To make the most appropriate use of the database, a period dedicated to an in-depth analysis of the tagging conventions and their respective evolutions must be planned.
2.1 OpenStreetMap database, a data source for cartography
Online services as Google Maps and OpenStreetMap have connected geospatial data to online information. Both web-mapping services participate in the geospatial densification, opening visualization through interactive geo- graphic tools (Geoweb).
The paper focuses on collaborative and open geospatial data or, Volunteered Geographic Information (Good- child, 2007), produced by web communities of contributors. These communities are shaping features that facilitate customization and interaction on the Geoweb (Joliveau, 2011). OSM contributors constitute a new 'stakeholder' community alongside the public and private agencies founded to produce and maintain geographical information.
2.1.1 The World drawn by OSM
The OSM project aims at producing a global geographical database available under an open licence. This project focuses on permanent physical features of the ground, as well as administrative divisions and places (city or village for example). One of the guidance for the contributors consists in adding objective information. In this context, the project ensures that it is possible to check the accuracy of the information. The other main guidance refers to the drawing according to a very large scale. The core product of the project is the free editable database. To focus on the geographic database — and not only on one particular map — enables various uses such as route computation, route guidance, thematic mappings, mashups and geocoding.
Therefore, these characteristics (topology and various thematic) of the database explain the data model complexity of the OSM database. First, when creating an object in the database, the contributor has to choose to which element (a node, a way or a relation) he will associate thematic tags.
A node is a specific point defined by its geographical coordinates. A node can be tagged with thematic information and then, may represent a tree, the centre of a locality or a street lamp for example. However, nodes are
also used to compose ways. Ways are lists of nodes. They can be either a line or an area (a closed way).
A way may represent linear features such as boundaries or roads but also areas like buildings or land uses. Relations are combinations of data. They are used to build a relationship between elements that are part of a larger geographical information. For example, a relation can be used to define a political area by including the outer and inner boundaries and the admin centre.
Secondly, the contributor tags elements in order to create geographical objects such as buildings, forests and places. Tags are a combination of a key and a value. Contributors are free to choose which tag is the good one to depict the main attribute of the object (“highway=tertiary”) and more specific attributes (“oneway=yes”). The choice of these items often starts with a review of the OSM wiki. Technical and mapping documentations are available on this collaborative Website. Based on this resource, contributors can choose the most commonly used tags which are described on the wiki or to create new ones. In practice the free choice of the elements leads to some complexity. It is a part of the mapping process to analyse the diversity of objects in the database regarding the features that will be drawn. If the cartographer chooses to map gardens and parks using a same icon, he or she will have to consider nodes and closed ways tagged “leisure=garden” and “leisure=park”. In order to homogenize the map design, nodes and closed ways, an automatic process can be useful to define the centre of the closed ways. Therefore, all of the gardens and parks will be displayed with a same standardized symbol.
The last fundamental aspect of the OSM database for the user of the data is the licence. (https://opendatacommons.org/licenses/odbl/summary/). Anyone is free to share the database, to create a production from the database and to adapt the information of the database. This freedom comes with some conditions. In the case of public use, the "© OpenStreetMap contributors" attribution must appear in the publication. When a user produces and publishes anything based on a derivative database, intended to be used by everybody, this new database has to be publicly released under the ODbL licence. Finally, the user has to keep open this derivative database with- out technological or financial limitation.
2.1.2 From the large OSM Data Model to a Michelin Data Model
the Michel- in uses. It relies on the analysis of semantic and geometric heterogeneities in OSM data.
This observation is not a barrier. For cartographers, the issue would be to add the inherent complexity factor of free contribution in their cartographic process. The OSM database structure is translated into a database structure fit- ted with Michelin graphic guidelines. As for any traditional map, an “efficient” map which is based on Volunteered Geographic Information relies on the cartographer choices. The cartographer has to group objects that are the same on the ground but are different in the database, due to diverging interpretations between contributors (Fig.1.). Selecting and prioritizing information are part of cartographic principles but in the case of OSM these techniques have to be practised more extensively.
Fig. 1. Various methods to add address information. (Source: Flora Hayat, 2015)
2.2 Two media, paper and web: two cartographies The research activities, implemented within Michelin's cartographic framework aimed at producing maps for the Web and for the paper publications (Atlases, tourist maps, city plans). Mapping methods differ according to the me- dia. The basic principle is that the two production chains (one for each media) have similar editorial lines. Therefore, they share a common large cartographic database. However, two main differences distinguish the two media: the ex- tent of the map and its scale. Paper maps are drawn on a fixed geospatial extent and on a defined scale. Web maps can be drawn on a global extent and from a global to a local scale.
On the one hand, automatic mapping for the web, as it is now used for ViaMichelin, is a way to publish a free set of maps from local scales (buildings, names and addresses) to a worldwide scale and a service of routing. On the other hand, this amount of data cannot be represented as clearly as those on paper maps. The precision of the graphic guidelines are equal for both media. However the drawing editing process is a full part of the production process of a paper map and cannot be applied in the same way for Web maps. Nevertheless, the zoom functionality is the factor that allows different requirements between paper and web mapping. A paper map has to be enough, by itself, to convey the whole mapping message. Consider a Web map, if an information is not clear on a medium scale, the user can easily zoom in and obtain the information he is looking for.
These research activities aimed at increasing knowledge about the OSM technical ecosystem. The purpose of this
research activity consists in designing a production process which can be applied to the publication of up-to-date and well-looking maps in term of adapted aesthetics to the Michelin context. Editorial and graphic guidelines designed for the creation of paper maps require a large part of hands-drawing. The most significant added values of mation and data management is to save time for the benefit of the hands-drawing phase.
3.
Cartography in practice
Two mapping prototypes have led to the research for a cartographic data model adapted from the OpenStreetMap database structure. In my research activity I worked on a web mapping prototype. This project consists in a Proof of Concept (POC) study. The purpose of the second prototype is the publication of paper maps. This work led to the production of a map on a scale of 1/80,000 of the Reunion Island in the Indian Ocean.
3.1 Web mapping with vector tiles
The POC study aims at answering to two questions. What new graphic opportunities does the vector tile mapping method may offer? Is it possible to publish a static web map based on OpenStreetMap data that would fit with the Michelin's cartographic requirements? This study employs methods and tools that have been developed in the OSM project framework.
3.1.1 Vector tile method
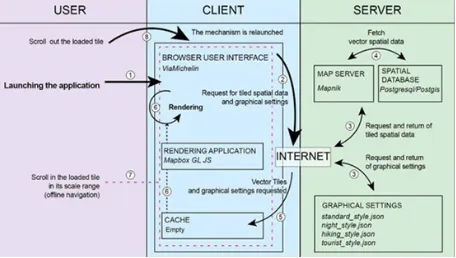
A web vector map is displayed in a browser by an interaction between a server and a browser user interface (Fig. 2.). When the user navigates the map, the rendering application requests vector tiles encoded as Google Protobufs (PBF) from the map server. Vector data are stored on the client device. The tiles are produced following the Mapbox vector tile specification. The first transferred tiles are related to the user location on the map at a specific zoom level. A vector tile is a square extent of data, within a projection. Each tile contains a selection of geographic data and their attributes.
Fig. 2. Client requests to the server. (Source: Flora Hayat, 2017) Vector tile technology offers several improvements for cartography over raster technology.
icons and labels are adjusted to the screen of the device by the client rendering application. This way, the map may be designed for various screen sizes. Moreover, a compact data set like PBF vector tiles enables to serve dense and high resolution maps with good response time performance.
Then, tiles are not images but data sets. In a raster framework, images are pre-rendered for dedicated discrete zooms. In a vector framework, the scale is continuous. Therefore, vector tiles may be defined and rendered on a scale range to provide a dynamic and fluid zooming. The user may navigate a same tile stored in cache at several zooms. To zoom in a tile triggers the scaling and the position adjustment of icons and labels without necessary a new request to the server. If the user zooms out of the scale range of the tile a new tile set is requested.
Finally the major asset of the vector tile technology for cartography is the possibility for the user to switch the de- sign on the fly. As long as the cartographer bases the conception of the graphic guidelines on the same data set structure, the shift do not imply a new request of tiles to the server. The switch of cartographic representations is instantaneous. This framework opens perspectives for various thematic maps without affecting the rendering performances.
3.1.2 Defining a map design
The organization of the layer in the tiles is a part of the cartographic creation. Some of thematic choices are de- fined by the tiles parameters. Vector tiles consist of, at least, one named layer. Each layer contains geometric features and their attributes.
At this stage we, the Michelin geomatic team, have created two thematic maps focusing on pedestrian mobility in cities and hiking: two graphical guidelines for a same vector tiles set. On one side, the data source of the vector tiles must be large enough to serve various thematic maps. On the other side, the vector tiles have to be as light as possible for the client device to offer a fast rendering when panning and a fast transfer of content between the server and the client.
The method and approach to mapping is partly changed from those used for the production of raster tiled maps. First, the database structure has a key role in the respect of the editorial line. Furthermore, the rendering performance and the editorial guidelines had to be taken into account when weighing database design choices. As most of traditional cartographic processes, the definition of the database is based on an iterative and incremental way of working.
Secondly, the definition of the design guidelines for vector tiled maps shares several common points with raster web mapping methods. It was possible to reuse ViaMichelin cartographic rules. For example cartographic objects such as road networks, point of interest or place name are displayed and ordered by varying the line thickness, the icon size or the size or weight of the text. Moreover, depending of the map zoom, the objects are selected and classified. These
design rules also vary according to the scales of the web map. These mapping rules can be applied similarly for a vector tile map. Nevertheless, to draw a vector map, the design guidelines had to be set according to a new usage of the zoom levels. The rendering is dynamic. Each zoom can be rendered. Traditionally, the zoom parameter is an integer between 0 (small scale) and 18 (large scale). Within the vector tile framework when the user navigates the map he may display a decimal level of zoom such as 15.8. The design guidelines may include this functionality. It is possible to choose to define design guidelines for every single zoom. It is also possible to benefit from the storage of the data on the client side to provide instantly an image adapted to the use. For example, in one of the design guidelines the colour intensity of specific buildings is reinforced on zoom in to emphasis their relevance on large scales.
The design guidelines can be written by hand as graphical settings in a style document (in JSON). For instance, this document is used by the Mapbox GL JS library to draw data in the right order on a right scale. Mapbox has de- fined style properties like fill-color, line-width, icon-allow-overlap. The Mapbox style specification describes more than eighty properties. The style properties are affected per layer. Each layer must be one of the following types: a background, a fill, a line, a symbol, a raster, a circle or a fill extrusion. A layer has a source (the tiles directory), a layer source (within tiles), and may have a filter (of the layer source). On this basis it is possible to elaborate various rendering for a same data source in the form of vector tiles.
3.1.3 Mapping tools
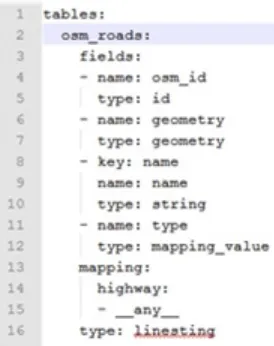
The web mapping project is based on a PostgreSQL/PostGIS database. The tool Imposm3 (supported by Omniscale) is dedicated to the import of OSM data into a spatial database. Imposm3 reads OSM PBF files. It imports the data into PostgreSQL/PostGIS according to a parameter file (in YML) in which the user may define custom schema databases (figure 3). The schema has to be as simple and light as possible to generate small but adapted tiles. Imposm3 offers various features like the possibility to generalize geometries or to unify values like boolean values.
In order to progress in the POC, a prototype of the final cartographic production process was required. Therefore two tools (Utilery and Tilelive) were used to produce tiles. Then the data structure and the cartographic choices we developed could be tested.
example). Moreover the data may be processed to help selections (column “road_level” in the figure 4). Then, the source database may be used for various uses like vector web map- ping and paper mapping.
Fig. 3. Extract of an Imposm3 parameter file
Fig. 4. Extract of an Utilery parameter file
Tilelive is a module based on Node.js. Tilelive fetchs vector tiles from Postgis. These vector tiles (in MVT) are stored in a SQLite database following the MBTiles specification.
Utilery and Tilelive are two useful tools in this context. At a later stage the mapping department intends to render maps with Mapnik which has implemented the Mapbox vector tiles specification. On the client side, the mapbox- GL-JS library renders the map. Mapbox GL JS is a JavaScript library that combines vector tiles and styles (JSON) to render interactive maps. Mapbox GL JS uses the JavaScript API WebGL (Web Graphics Library). 3.1.4 Results and perspectives
The vector tile technology is designed to serve fast rendered maps, loaded on the client side at high resolution. At this point of the prototype, we identify that the more interesting aspects are the storage of the data in the cache and the rendering on the client side. On the one hand, for a same data set (in a tile) and a scale range, the client may navigate a tile on various scales without the need to request new data. On the other hand, for a same
data set, the client may choose to change 'on the fly' the graphic design of the map. This new interactivity with the map allows the user to give a personal touch to the design of the map. It is an aspect the mapping department has not already deployed.
At this stage of the project, the graphic guidelines are not yet fixed. The main issue is the simplification of geometries on low scales. Preliminary treatments are imperative to produce a static web map which would fit with Michelin's graphic expectations. This issue has to be balanced with the constraint of updating the map very frequently.
3.2 Paper map prototypes
I started to work on various paper map prototypes in June 2016. The aim is to produce detailed maps displaying mostly the road network, hiking pathes, tourist sites and beaches.
The OpenStreetMap database has been chosen as the data source for three reasons. First, OpenStreetMap is continuously being enriched by contributors. When the mapping department choose the OSM database to produce the map, the analysis often highlights large and regular contributions related to tourist areas. Secondly, there is some background production to this issue: a paper plan of Clermont-Ferrand published in 2013 and the web map POC. It was then possible to build a new prototype on these experiences. Finally, updating the OSM database with data collected on the ground is a part of the research activity conducted in the Michelin mapping department. Ground survey seems to be the most efficient method to produce an up-to-date and accurate cartographic database for our mapping project.
The source of the database dedicated for a paper map based on OSM data is a part of the world database (OSM PBF) taken from the Geofabrik Website around the chosen areas. The data are loaded into a PostgreSQL/PostGIS database following the data model and the defined data processing. Most of the process consists in translating the OSM data into a Michelin GIS infrastructure in order to apply automatically Michelin design guidelines.
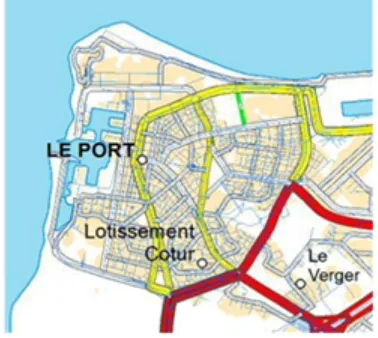
motorways are mostly simplified with a single line (Fig.5.). The road hierarchy is depicted through the graphic guidelines. Despite the geometric treatments, the large thickness of lines requests handmade checking and revision (Fig.6.).
As part of a mapping production on the Reunion Island, using OSM, a ground survey was conducted in the is- land. The field-visit was prepared thanks to the OSM data source. A “field map” has been produced using mainly the automatic tools we have set for prototypes. Its complete realisation revealed some spatial and thematic heterogeneities. Therefore, this map was used as a basis of the data collection on the field. The creation of the field map, the definition of the road map and the data collection became a part of the mapping process.
The data collection was done using three medium: GPS tracklogs (Illustration 1), digital photography and voice recording. The thousands of time stamped photography, the vocal records and the handwritten notes were our sources of information. This information has been ordered, structured as OSM data and recorded in the database using the map editing application, JOSM.
Fig. 5. Selection of roads (in blue the original lines)
Fig. 6. Extract of the final map
Thanks to the collected information and to the cartographers’ field practice two themes were developed. First, the scenic trails were identified. It is a specific feature in Michelin maps. The ground survey is obviously
the only source for such subjective choices. Secondly, it became clear during the survey that having picnics somewhere in the area is a local widespread practice. This theme has been added to the map, following the ground survey observations.
After the automation of parts of the map making, the cartographers’ expertise was needed to produce the desired map. Cartographers had to reshape parts of the geometries and to refit texts (Fig.6). Moreover, cartographers de- signed routes, as usual for a Michelin map. The road network was partly re-ordered to highlight its hierarchy.
4.
Conclusions
This article presents a framework set in the Michelin production context to manage OSM data. The research activity is the opportunity to analyse the differences and the similarities between the production of a web map and the production of a paper map.
The produced prototypes verify the hypothesis of the technological and graphical feasibility. Michelin tourist papers maps of regional areas can be created based on the OSM database. Moreover, the hiking and tourist web map prototypes are complete regarding to the thematic analysis. The remaining work is much more related to data pro- cessing than to data mining.
The web map technical workflow is a preliminary formalization of a larger data management study. On continental and regional scales, the generalization process has to be improved to serve aesthetical tiles.
Both of the prototypes are built on tools which are parts of the OSM technical ecosystem. The two contexts (pa- per and Web) share a same process according to the data management. Mapping with OSM data is a more conventional way of working than we had expected. It is a mapping process which is more characterized by an original dataset and mapping methods than by specific representations which would move away from traditional mapping.
5.
References
Chilton, S. (2009). Crowdsourcing is radically changing the geodata landscape: case study of OpenStreetMap. In Proceedings of the UK 24th International Cartography Conference.
Commons, O. D. (2013). Open Database License (ODbL).
Goodchild, M. F. (2007). Citizens as sensors: the world of volunteered geography. GeoJournal, 69(4), 211-221. Joliveau, T. (2011). Le géoweb, un nouveau défi pour les
bases de données géographiques. L’Espace géographique, 40(2), 154-163. Martinelli, L., & Roth, M. (2016). Updatable Vector Tiles from OpenStreetMap. Mapbox. MbTiles specification, URL :
https://www.mapbox.com/help/an-open-platform/#mbtiles
Neis, P. OpenStreetMap stats, URL : http://osmstats.neis-one.org/
Omniscale. Import OSM into PostGIS, URL : https://github.com/omniscale/imposm3
OpenStreetMap. Map Features URL: http://wiki.openstreetmap.org/wiki/Map_Features
OpenStreetMap stats reports, URL : http://www.openstreetmap.org/stats/data_stats.html
Topf, J. The TagInfo Webservice—Statistics About Tags in The OpenStreetMap Database. URL : http://taginfo.openstreetmap.org/keys