The effect of permeate drag force on the development of a biofouling
1layer on pressure driven-membrane separation system
23
L. Eshed1, S. Yaron2, C.G. Dosoretz1,* 4
5 6
Running title: Effect of cross-flow on membrane biofouling. 7
8 9 10
1Faculty of Civil & Environmental Engineering and Grand Water Research Institute 11
and 2Faculty of Biotechnology and Food Engineering, Technion-Israel Institute of 12
Technology, Haifa, Israel. 13
14 15
*Corresponding author: Faculty of Civil and Environmental Engineering, Technion-16
Israel Institute of Technology, Haifa 32000, Israel. 17
Tel.: +972 4 8294962; fax: +972 4 8228898. 18
E-mail address: [email protected] (C.G. Dosoretz). 19
20
ACCEPTED
Copyright © 2008, American Society for Microbiology and/or the Listed Authors/Institutions. All Rights Reserved.Appl. Environ. Microbiol. doi:10.1128/AEM.00631-08
Abstract 21
The effect of permeate flux on the development of a biofouling layer on cross-flow 22
membrane separation was studied by means of a bench scale system consisting of two 23
replicate 100 kDa MWCO-tubular ultrafiltration (UF) membrane modules, one 24
allowing the flow of permeate and the other does not (control). The system was 25
inoculated with Pseudomonas putida S-12 tagged with a red fluorescent protein and
26
operated at laminar flow regime under sterile conditions with a constant fed of diluted 27
(1:75) Luria-Bertani medium. Biofilm morphology was studied by means of Field 28
Emission-Scanning Electron Microscope and Confocal Scanning Laser Microscope 29
and subsequently quantified by image analysis, as well as live counts and permeate 30
flux monitoring. 31
Biofilm development was highly enhanced in the presence of permeate flow, causing 32
the build-up of complex three-dimensional structures along the membrane. Active 33
bacterial transport towards the membrane by permeate drag was found to be more 34
dominant mechanism by which cross-flow filtration contributes to the buildup of a 35
biofouling layer than transport of nutrients. Cellular viability was found to be not 36
essential for transport and adhesion under conditions of cross-flow, since the permeate 37
drag overcomes the effect of bacterial motility.
Introduction 39
Membrane separation is becoming a wide-spread technology for water and 40
wastewater treatment and purification (35). A membrane is basically a selective 41
porous medium, which allows the transfer of certain molecules to the permeate side 42
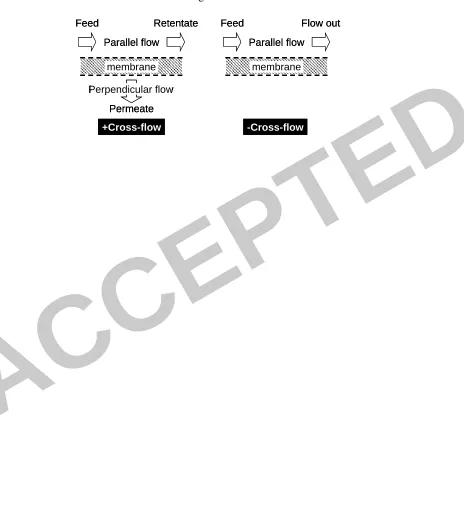
based on size and charge, depending on the process type. In cross-flow membrane 43
separation two simultaneous streams are present: the feed stream, flowing in parallel 44
to the membrane walls and the permeate stream, flowing perpendicularly to the 45
membrane surface (Fig. 1). 46
The movement of particles, colloids and nutrients towards the membrane surface 47
enhances the development of the biofilm layer (biofouling). Besides the substances of 48
biological origin, i.e., cells and EPS (Extracellular polymeric substances), the 49
biofouling layer may include inorganic and organic substances and particulate 50
material rejected by the membrane. Biofilms provide clear advantages to the 51
microorganisms: protection from stress conditions in the environment, better 52
metabolic cooperation and higher densities facilitating genetic exchange (15, 52). 53
Biofouling can become a significant problem if biofilm growth is not controlled, 54
because it can lead to clogging of the membrane, impairing the ability of the system to 55
function properly (7). 56
In the case of cross-flow membrane filtration, the net velocity of particles towards the 57
membrane surface is largely determined by normal convection with small 58
contributions by tangential convection and Brownian diffusion (51). Non-specific 59
interfacial forces seem to dominate bulk transport, and thus, govern deposition 60
phenomena. These interfacial forces are caused by interactions such as van der Waals, 61
steric, Lewis acid-base, electrostatic double layer phenomena and hydrodynamic 62
conditions (31). As compared to dead-end filtration, cross-flow filtration has the 63
intrinsic advantage that the feed stream generates a tangential shear force on the 64
membrane walls, thereby diminishing biofouling. 65
The initial attachment of bacteria on membranes is largely controlled by 66
physicochemical factors such as solution chemistry, surface properties of the 67
membrane and particles and the hydrodynamic conditions (2, 4, 9, 11, 18, 19, 34, 57). 68
Bacterial factors have also an important role in attachment. Increased production of 69
specific surface proteins and exopolysaccharides is resulted in increased cellular 70
adhesiveness and biofilm formation (28, 49, 53). The expression of these components 71
is mediated by GGDEF domain-containing proteins in different bacteria such as P.
72
putida, Escherichia coli, Salmonella enterica, Vibrio cholera and Pseudomonas
73
aeruginosa (23, 32). The surface attachment, especially in the early stages of
74
colonization, may also be affected by bacterial motility and particularly by the 75
twitching motility, a form of surface translocation mediated by flagella and type-IV 76
pili (14, 26, 42, 43). Flagella has been proposed to be important in the initial 77
attachment phase of P. Putida on plant roots and fungal hyphae (55, 58) but on other
78
surfaces it was not shown to be necessary (22). Moreover, a hyper-flagellated mutant 79
strain showed to be impaired in it's initial biofilm formation (13). Flagella is also 80
known to play a role further in the structural development of the biofilm. Subsequent 81
to the formation of microcolonies, flagellum-driven motility takes a key role in the 82
formation of loose protruding structures (54). The expression of flagella was found to 83
be in strong relation with surface attachment: down regulated quickly after surface 84
attachment and upregualted at later stages of biofilm development (32). 85
Motility was found to be involved in the bacterial attachment to surfaces in both 86
flowing (33, 39) and static systems (43, 47, 56). In cross-flow regime, there is a trade 87
the surface by shearing them off the surface) and the permeation drag force originated 89
by the pressure gradient across the membrane or transmembrane pressure (acting in 90
the vertical direction, carrying bacteria and other particles towards the membrane). 91
Little is known so far about the importance of motility on bacterial attachment and 92
biofilm development in cross-flow membrane filtration, which represents a different 93
flow field than the conventional flow pattern of unidirectional flow. 94
The permeation drag force, which acts perpendicularly to the stream lines is not only 95
an additional strong force assisting the cells to penetrate the hydrodynamic layer (18, 96
19), but may influence the biofilm development, as follows: (i) speeding up and 97
enhancing attachment of the first cell clusters at the early attachment phase, (ii) 98
increasing migration of nutrients and gases towards the base of the biofilm, (iii) 99
improving removal of metabolites and spread of signal molecules. The influence of 100
cross-flow on the physical properties or morphology of biofilms had not been 101
thoroughly explored. Yet, both morphological and physical differences between 102
biofilm grown with or without cross-flow can be expected, due to this added 103
perpendicular flow vector. Biofilm thickness and density are two important 104
parameters which may change in the presence of permeation, due to the enhanced flux 105
of nutrients. Changes in these parameters may introduce diffusional limitations and 106
affect the microenvironment surrounding the cells (46). 107
The working hypothesis of the present research is that the permeation drag force 108
overcomes the local shear force and shadows the importance of the swarming motility 109
in the adhering bacteria, making the swarming motility irrelevant in this case. Once 110
attached, the bacteria that colonize the membrane surface utilize this nutrient flux into 111
biomass, and form the EPS of the biofilm. The aim of the present study was, 112
therefore, to investigate how cross-flow filtration quantitatively affects structural 113
biofilm parameters on a bench scale system, consisting of tubular UF membrane 114
modules, inoculated with a fluorescently tagged Pseudomonas putida S-12 and
115
operated at laminar flow regime under sterile conditions in continuous mode. 116
Biovolume, thickness, density and coverage area, morphology, as well as the decrease 117
in the permeate flux through the membrane during the build-up of the biofouling layer 118
were determined. The effect of the cross-flow on microbial cells transport and the 119
importance of motility during initial colonization were studied as well. These 120
parameters were obtained by CLSM imaging and subsequent image analysis upon 121
induction of biofilm formation. 122
Materials and Methods 123
Bacterial strain 124
Wild type P. putida S12 (ATCC number: 700801) (27) was used as the model
125
organism for this study. The mini-transposon (plasposon) pTnMod-RKm' (GenBank
126
accession number: AF061930) was used as a suicide delivery vector to mark the P.
127
putida S12 chromosome with DsRed (RFP) and a kanamycin resistance gene (kanR)
128
(17). A single-species biofilm was chosen in order to simplify the test-system and
129
provide means for easier tracking of the biofilm development, without the influence of 130
cross-relation between different bacterial populations. 131
Inocolum and media 132
Luria-Bertani (LB) broth was used for generation of the starter cultures (grown for 16 133
h at 30°C in shaken flasks) used for inoculation of the experimental cultures. 134
Experimental media consisted of LB broth diluted 1:75, unless otherwise indicated. 135
The proper dilution was achieved by proportional feed of water and 1:10 LB medium 136
by means of two peristaltic pumps. Kanamycin (30 µg/ml) was added to the 137
The experiments were started by adding a volume of the starter culture (3.3 OD) into 139
the reaction medium (140 ml) to reach an initial cell concentration of approximately 140
1.4×10⁷ cells/ml in the reactor (Fig. 2). All experiments were performed under sterile 141
conditions. 142
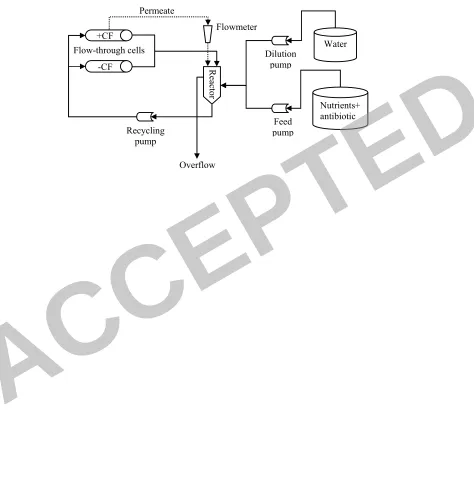
Flow-through cell system 143
A dual channel tubular flow-through cell system allowing work under sterile 144
conditions was applied (Fig. 2). The flow-through cells (13 cm length-L and 12.5 mm 145
diameter-D) were equipped with a 100 kDa molecular weight cut-off-UF tubular 146
membranes made of PVDF (PF100, PCI). Unless otherwise stated, one cell was run 147
under cross-flow (+CF), allowing the passage of permeate through the membrane, and 148
the other was run without cross-flow (-CF) in a unidirectional flow (Fig. 2). A 149
concentrated nutrient feed solution was directly diluted with double distilled water 150
(DDW) to the desired concentration in a 140 ml reactor by regulating the flow of two 151
parallel peristaltic pumps (Cole-Parmer, USA). Cells, reactor and reservoirs were all 152
of Pyrex glass. The different components of the system were connected with silicone 153
tubing and recirculation was done by means of a peristaltic pump. The system was 154
equipped with pressure gauges and rotameters. 155
Biofilms of P. putida were allowed to develop on the membrane surface, as a model
156
for biofouling layer development, under sterile conditions. In all cases all the 157
components of the system, except the membranes and the pressure gages, were fully 158
autoclaved (121°C for 20 min) prior to each experiment. After the assembling of the 159
system, a 0.5% w/w NaOCl solution was run in the system for at least 3 hours and 160
thereafter the system was thoroughly rinsed with sterile DDW for 16 hours. In order 161
to check for sterility, plating of the rinsing water was done on LB agar plates prior to 162
each experiment. 163
After inoculation the influent flow rate was maintained at 3.5 ml/min, giving a 164
dilution rate of 0.025 h-1 (corresponding to a hydraulic residence time of 40 min). This 165
rate was above that of washout rate for P. putida S12 in the diluted medium, to
166
minimize suspended growth and to encourage biofilm growth (48). Effluent samples 167
were taken right after inoculation and were found to be in the range of 107 cells/ml. 168
The average flow velocity (ū) was maintained at approx. 0.065 m/s and the 169
corresponding calculated Reynolds number was 910 (at 30°C), i.e., laminar flow. The 170
shear rate on the membrane surface (Γ w) in laminar flow regime was calculated as 171
Γw=8ū/D=41.6 sec-1. 172
Permeability (Lp) is defined as the specific permeate flux (J) through the membrane 173
relative to the transmembrane pressure drop (ΔP) across the membrane, according to 174
Lp=J/ΔP (l/m2.h-bar), neglecting osmotic pressure changes. Permeability was 175
calculated at different time points in order to track the kinetic pattern of the biofouling 176
layer build-up depicting the blockage of the membrane. The transmembrane pressure 177
was calculated as ΔP =(Pin+Pout)/2, neglecting the pressure on side of the permeate 178
which was discharged at atmospheric pressure, whereas Pin and Pout are the pressure of 179
the feed and retentate streams, respectively (see Fig. 2). Unless otherwise stated, the 180
experiments were conducted at a fixed initial ΔP of 1 bar. 181
A sampling port was positioned on the overflow line at the exit of the reactor. 182
Autoclave-sterilized 0.22 µm air filters (Millipore Millex-FG50) were positioned on 183
the reactor and the feeding carboys, to allow free aeration of the system. 184
Comparative growth of biofilms on membranes with/without cross-flow 185
Independent experiments were run for different time-periods (1 h up to 6 days), each 186
consisting of side-by-side +CF and –CF membrane modules. The system was pre-run 187
inoculation (time zero). After inoculation, as described above, a sample of the liquid 189
in the system was collected and plated for live cells count. Permeate flow rate from 190
the +CF membrane was recorded during the experiments at different time points, as 191
indicated. 192
At the end of the experiments, the membranes were taken off the system and were 193
thoroughly washed with sterile saline solution to discard all loosely attached bacteria. 194
To count the attached bacteria, two pieces of 1 cm long membrane (giving an area of 195
3.93 cm2 each) from each membrane were vortexed in a glass tube for 40 seconds 196
with 4.5 ml of saline+0.1% Tween-80 solution, containing 2.5 g glass beads (D=3 197
mm). A serial dilution was prepared and plated on LB agar plates. The plates were 198
incubated at 30°C for 16 h. To analyze the biofilm structure, membrane samples were 199
sliced and prepared for microscopy analyses as described below. 200
Effect of the permeate drag force on bacterial transport and biofilm formation 201
For these experiments, the flow-trough system similar to that described above but 202
including three parallel channels was applied. The system was pre-run with nutrients 203
solution for 4 h and aseptically inoculated (time zero), as described above. After 204
inoculation a sample of the liquid in the system was collected and plated. Then, all 205
three modules were operated as +CF membranes for 15 minutes, allowing the flux of 206
permeate through the membrane, in order to allow bacteria to attach equivalently to 207
all the three membranes in full recycle mode (batch mode). During this phase no fresh 208
nutrients feed was introduced to the system in order to keep the bacterial 209
concentration in the system constant. Thereafter the system was aseptically evacuated 210
and then refilled with fresh nutrients feed (purging phase). This procedure was 211
repeated at least 5 times for one hour, in order to remove the maximum of planktonic 212
cells possible. At the end of this phase, a sample of fluid from the system was 213
collected and plated, to track the concentration of suspended bacteria left in the 214
system. Concomitantly, one module was disassembled from the system and the 215
membrane in it was thoroughly washed with sterile saline solution to discard loosely 216
attached bacteria, as mentioned above, and plated to quantify the attached bacteria. 217
From this point onwards, the nutrients feeding rate was increased to 1.5 l/h (retention 218
time equals to 8 min), in order to wash out all possible remaining planktonic bacteria. 219
The two modules left were run one as +CF and the other as –CF, as described 220
previously, for an additional 4 hours. At the end of this running period a sample of the 221
liquid was collected and plated, in order to track the suspended cells concentration in 222
the system, which was found to be in the range of 104 cells/ml, three orders of 223
magnitude smaller than right after inoculation. Then the two modules were 224
disassembled and the membranes were washed and plated as mentioned above. 225
The influence of bacterial viability on the adherence to the membranes 226
Two separate flow-through cell systems were run in parallel under sterile conditions. 227
One flow-through system was a dual-module similar to that described in Fig. 2, 228
inoculated with dead cells (described below) and run one +CF membrane and one – 229
CF. The second flow-through system was a single-module system, inoculated only 230
with live cells +CF. Both systems were inoculated to the same final cells 231
concentration. In this set-up, both systems were operated by a three-headed peristaltic 232
pump (Cole-Parmer) in flow conditions same as above. Running time was set as 1 233
hour, to allow early attachment while minimizing duplication of the live bacteria. 234
After inoculation, a sample of the liquid in the system was collected and plated. Both 235
systems were run with full recycle (batch mode) in order to avoid differential dilution 236
and washout. 237
At the end of the running time the membranes were disassembled and thoroughly 238
washed with sterile saline solution. Membrane specimens were cut, thoroughly 239
washed and directly observed by fluorescent microscope for analysis of coverage 240
area. 241
For preparation of live and dead RFP-tagged-P. putida S12-cell suspensions, bacteria
242
were grown and harvested according to Solomon and Matthews (50). Briefly, cells 243
were grown overnight in LB, then split in two. Cells had been killed with 2.5% 244
glutaraldehyde. Microscopic observation showed that the dead cells retained their 245
fluorescence properties. 246
Microscopy 247
Confocal laser scanning microscopy (CLSM). Biofilm development was visualized by
248
using a MRC 1024 CLSM (Bio-Rad, Hempstead, UK) equipped with a Nikon Plan 249
Apo 63x1.40 objective and by using a LSM Zeiss 510 Meta equipped with a Zeiss 250
AxioImager Z1, equipped with detectors, lenses and filter sets for monitoring the 251
fluorescent staining applied. The EPS was visualized by using Concavalin A (FITC) 252
staining (40, 41). Bacterial cells were visualized by the RFP tagging. Staining with 253
nucleic acid stains Syto9 (Invitrogen-Molecular Probes, S34854) and Propidium 254
iodide (PI) (Sigma, P4170), for visualization of total and dead cells, respectively, was 255
done according to the manufacturers instructions. 256
Parameters of the CLSM were set once and applied evenly as much as possible for the 257
rest of the experiments, in order to ensure quantitative comparison of the results. 258
Wavelengths were set according to manufacture instructions (Concavalin A-FITC and 259
Syto9: ex. 488 nm, em. 498; RFP: ex. 563, em. 580 nm, PI: ex. 493; em. 630). 260
Fluorescent Microscopy. Early stages of biofilm development were tracked by
261
observation of fluorescently tagged bacteria, using a Leica Dmire2 inverted 262
microscope and Zeiss Axio-observer 200M inverted microscope. Z-cross sections 263
were acquired by using x40 and x63 lenses (Z-cross sectioning was needed due to the 264
curved nature of the membrane surface). 265
Scanning Electron Microscopy (SEM). Membrane samples for SEM were fixed with
266
glutaraldehyde and dehydrated in an ethanol gradient in the cold, as described 267
elsewhere (3, 30). Hexamethyldisilazane (HMDS) was used to dry the cells instead of 268
the critical point drying. This method was reported to be better suitable for drying 269
samples of cells for SEM examination without causing cell structure disruption (3). 270
Samples were sputter-coated with carbon and were visualized by a Leo Gemini 982 271
High Resolution SEM. All chemicals employed were of electron microscopy quality 272
(Sigma Chemical, St. Louis, MO). 273
Image analysis. PHLIP software (http://phlip.sourceforge.net) (38) is an open-source
274
software which was specifically designed for 3D biofilm analysis. PHLIP 275
automatically sets the threshold value using the Otsu algorithm (44) and calculates the 276
architectural parameters. PHLIP runs on Matlab as a platform and requires an 277
additional definitions file, which was automatically produced by Auto-PHLIP-ML 278
software (http://sourceforge.net/projects/auto-phlip-ml) (37). Auto-PHLIP-ML also 279
removes bias from biologically insignificant pixels by removing extraneous images. 280
In this work PHLIP calculations were applied to determine biovolume, substratum 281
coverage, area to volume ratio and mean thickness. Biovolume is the volume of the 282
biomass, as measured by accumulation of foreground pixels which are attributed to 283
biomass (by external fluorescent staining or inherent bacterial red fluorescent 284
protein).The threshold was set automatically by PHLIP (by running the Otsu 285
algorithm), and manually verified and adjusted when necessary (38). 286
PHLIP was run in "no connected volume filtration" (CVF) mode. CVF option 287
removes pixels that are not connected to the substratum through the connection to 288
other neighboring pixels (38). In our study CVF was found to cause bias in the results, 289
due to the curved character of the membrane surface. Data was exported in an XML 290
format and statistically analyzed using Excel. 291
ImageJ (http://rsb.info.nih.gov/ij/) was used for 3D imaging (using the plugin 292
"Volume Viewer 1.31"; http://rsb.info.nih.gov/ij/plugins/volume-viewer.html (6)) and 293
for analysis of coverage area at the early development stages (monolayer) of the 294
biofilm. 295
Z-stack images acquired by fluorescent microscopy were processed and focused by 296
"Extended depth of field" plugin (http://bigwww.epfl.ch/demo/edf/#soft, (21)) to 297
produce a focused merged image of the whole scanned area, for subsequent coverage 298
area analysis. 299
Results 300
Effect of cross-flow on build-up, morphology and structural parameters of biofilms 301
developed on membranes 302
The purpose of these experiments was to perform a comparative study of biofilm 303
development on membranes, with and without cross-flow filtration. The -CF 304
membranes were depleted of a pressure gradient across them, thereby preventing 305
permeate flux as well as the accumulation of a concentration-polarization layer. In the 306
+CF a pressure difference across the membrane was created and consequently 307
permeate flux was allowed, thereby generating a convective flow towards the 308
membrane surface. 309
The bacterial adherence and build-up of the biofilm layer on the +CF membrane 310
caused a typical exponential decrease of the membrane permeability, resulting in a 311
decline of ~75% after 48 h (Fig. 3). Following this time, the permeability profile 312
reached an asymptotic value, which corresponded to the fully developed biofilm 313
(namely, reached a saturation resistance under these conditions). We predicted that 314
permeability decline would take place short after the inoculation. Measurement of the 315
permeate flux in several independent replicate experiments showed that a 22% 316
permeability decline already takes place within the first hour once bacterial deposition 317
and biofilm formation took place, becoming moderate thereafter (see Fig. 3). 318
The biofilm build-up was more evident in the +CF membranes as depicted by a 319
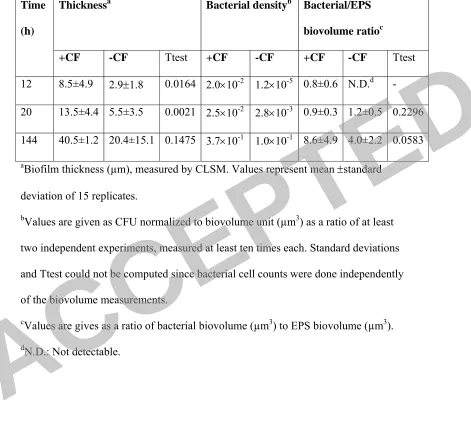
constantly higher thickness developed than biofilm grown on the –CF membranes 320
(Table 1). Within 12 h of the inoculation period, the biofilm on the +CF membrane 321
consisted of a thin layer of cells (varying from monolayer up to 8 µm) while the –CF 322
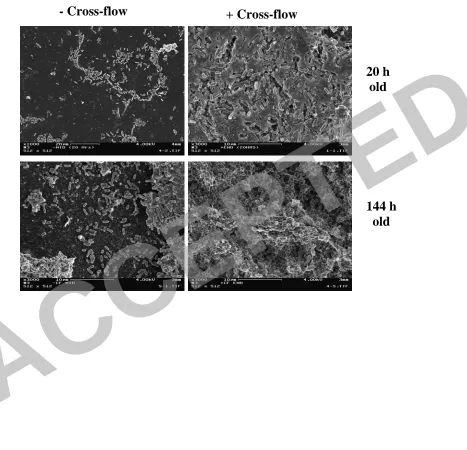
membrane consisted of a sparse layer of cells which randomly colonized the 323
membrane surface. This difference between the biofilms on the +CF and –CF 324
membranes persisted also at 20 h, although both biofilms became denser. At 6 days 325
and onwards, the +CF membrane became clogged by the biofilm layer, the permeate 326
flux decreased to negligible levels (Fig. 3), and the hydraulic conditions in the 327
membrane approached a –CF performance (in terms of cross-flow performance). 328
During this time, the cells attached to the –CF membrane developed a complex 3D 329
structure, and its thickness grew accordingly, yet, not as thick as the +CF membrane. 330
The variability in the thickness of –CF membrane after 6 days was significantly 331
higher than the +CF membrane, as evidenced by the standard deviation (Table 1). 332
This is in correlation with a higher frequency of uncovered patches in the -CF 333
membrane compared to higher homogeneity of coverage in the +CF ones. 334
The morphology of the mature biofilms, as evidenced by CLSM and HR-SEM 335
structures and tunnels, presumably allowing the transfer of nutrients and gases 337
towards the base of the biofilm (Fig. 4). This structure is common in biofilms 338
developing in fast-flowing environments, in line with previous reports (52). 339
The bacterial density of the biofilms accumulated on the membranes was measured by 340
plate cells counts, normalized to either the membrane surface area (Fig. 5) or to the 341
biovolume (Table 1). The bacterial density (relative to the surface area of coverage) of 342
both +CF and –CF increased as the biofilm developed, as expected. However, a 343
difference of more than 5-orders of magnitude between –CF and +CF membranes was 344
seen at the early attachment stage, namely after 1 hour post-inoculation (Fig. 5). This 345
difference gradually decreased with time and after 12 h the +CF biofilm was 3-orders 346
of magnitude denser than –CF biofilm and 1.5 orders after 6 days. This decrease 347
correlates the convergence with time of both systems to a –CF like-regime and 348
expresses a saturation level for colonizing bacteria and reproduction/detachment of 349
the anchored bacteria at the hydrodynamic conditions applied. As stated before, the 350
reason for the definitively higher concentration of cells on the +CF membrane is 351
explained by the convection force of the permeate stream, which actively transported 352
bacteria towards the membrane surface. 353
The increase in biofilm density was also apparent when looking at the increase of 354
bacterial density normalized to biovolume. The biovolume increased to a lower extent 355
than cells count, apparently limited to certain saturation value in correspondence to 356
the hydrodynamic conditions applied, namely the shear rate. As a consequence of this, 357
the biofilm became denser as it developed. 358
In addition, a gradual change in the relative biofilm composition that took place 359
during its development might contribute as well to the change in the increase of the 360
bacterial density determined. Indeed, this is depicted by the biovolume of the bacterial 361
biomass relative to the biovolume of the EPS in the biofilm, which changed with time 362
as the biofilm became denser (Table 1). For the +CF membrane, at the early stages 363
(12 and 20 h) the same amount of EPS and bacteria was noticeable (ratio=1:1). After 364
6 days this ratio increased in favor of the bacterial biomass, as the biofilm became 365
denser. 366
For the –CF membrane, after 12 h, a low bacterial density layer instead of a defined 367
biofilm was formed and therefore it was taken into account for the biovolume ratio 368
calculation. After 20 h the bacterial density increased and the ratio became close to 369
the +CF membrane. After 6 days the –CF biofilm displayed a developed structure, in 370
which most of the biovolume corresponded to bacterial biovolume. Whilst, the +CF 371
biofilm which was denser than the –CF one, had a 2-fold higher bacterial biovolume 372
to EPS biovolume ratio than the –CF biofilm. 373
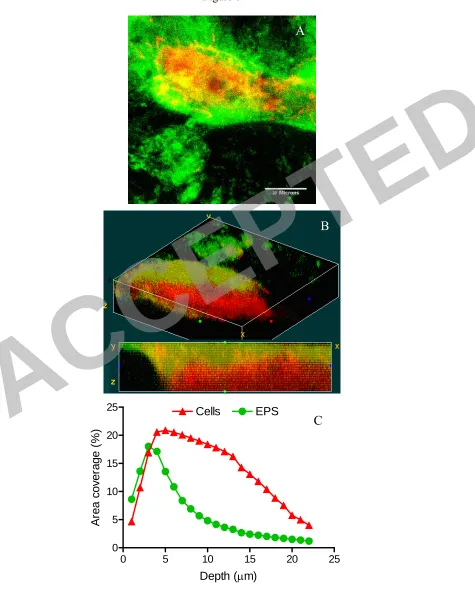
The relative location and abundance of the different components of the biofilm (such 374
as EPS, protein and bacteria) is also of interest, since it determines the physical 375
stability and tolerance of biofilms to different stress conditions. Differential CLSM 376
observations and subsequent image analysis showed that the mature biofilm, i.e, 6-377
days old, was surrounded by EPS of 2-3 µm thick, whereas the bottom parts were 378
composed mostly of bacterial biomass (Fig. 6). The EPS covering layer was reported 379
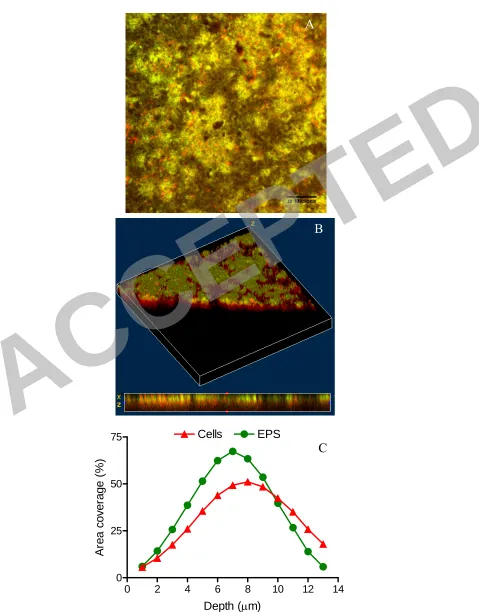
to serve as a protecting layer (20, 52). At the early stage of development, i.e, 20-hours 380
old, about half of the biovolume was composed of EPS, mostly located towards the 381
external surface of the biofilm (Fig. 7), while the internal parts were composed mostly 382
of bacterial biovolume. This phenomena was characteristic for both the +CF and –CF 383
membranes, according to the rate of development. 384
Importance of the permeate drag force as a mean of bacterial transport and 385
The permeate drag force augments the transfer of bacteria towards the membrane 387
surface was well as the flow of nutrients and adsorbed gasses through the membrane 388
surface, providing the attached bacteria with constant supply of nutrients and oxygen. 389
These two processes occur simultaneously when cross-flow filtration is present. The 390
purpose of this part of the work was to evaluate the contribution of each of these two 391
processes to the build-up of the biofilm layer. 392
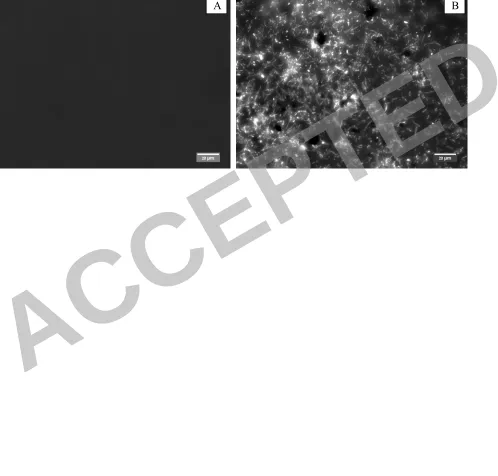
In order to evaluate the cross-flow permeate drag force as a mean of bacterial 393
transport the system was inoculated and operated for one hour with and without cross-394
flow. This time is long enough to allow the bacteria to attach to the membranes but 395
sufficiently short to avoid any noteworthy reproduction of the adhered bacteria. Plate 396
count measurements showed a difference of 5-orders of magnitude between both 397
membranes, 1.3 x10⁶ cells/cm2 on the +CF and <12 cells/cm2 on the –CF. This 398
difference in the adhered cells density was also evidenced by microscopic 399
observations (Fig. 8). 400
In order to evaluate the importance of the cross-flow permeate force in supplying a 401
flux of nutrients and dissolved gases, an experiment was performed in which three 402
replicate membranes were operated as +CF for the first 15 min after inoculation, 403
allowing identical passage of permeate. Then the system was thoroughly washed from 404
planktonic bacteria and one membrane was taken out for plate counting (control for 405
initial colonization). The two remaining membranes were then operated as +CF and -406
CF membranes for additional 4 h. This setup allowed a similar initial bacterial 407
colonization of the membranes during which the permeate stream served as a mean of 408
nutrients and gasses supply. Plate counts of the +CF membrane was 13.0±1.1x10⁶ 409
cells/cm2, which was 5 times higher than the –CF membrane (2.30±0.09x10⁶) and 12 410
times higher than the control membrane (1.10±0.01x10⁶). As can be seen by 411
comparing the –CF and the control membranes, a net cells growth equivalent to one 412
doubling took place at the membrane surface, i.e., potential biofilm growth. However, 413
when comparing the +CF and the control membranes, the bacteria replicated 414
approximately 12-fold. Hence, the contribution of the permeation as a mean of 415
nutrients supply to the bacteria colonizing the membrane is one-half order of 416
magnitude for a 4 h time-period, resulting in a ratio of more than 1:6 in favor of the 417
permeation as a mean of bacterial transport towards the membrane surface. 418
In conclusion, these results clearly indicate that the cross-flow convective force 419
enhances bacterial transport (increase of 5 orders of magnitude in bacterial density on 420
the membrane within 1 h), while increase in bacterial density due to transport of 421
nutrients to the biofilm caused an increase of only half an order of magnitude after 4 422
h. 423
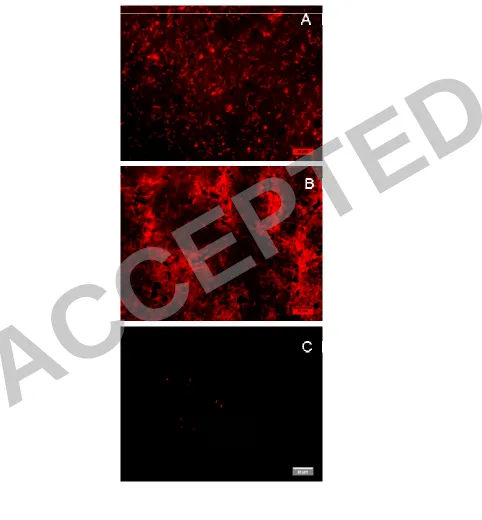
Adherence of live bacteria to the membrane surface under cross-flow conditions 424
This part of the study was aimed to evaluate quantitatively the contribution of the 425
early attachment of living bacteria onto the membrane surface under cross-flow 426
conditions. For this purpose, the adhesion of live and dead bacteria after 1 h was 427
compared. Surface coverage analysis shows that +CF membranes were significantly 428
covered to an almost identical extent, regardless of cell viability (live bacteria: 429
14.0±5.9% of the area was covered with bacteria; dead bacteria: 19.6±12.7%), while – 430
CF were covered to a much lesser extent (0.5±0.7% for dead cells and similar results 431
for live cells, as measured in other experiments). Dead cells even appear to cover 432
more area than the live bacteria in two different experiments (Fig. 9), but this 433
difference was not statistically significant. This difference can be explained by 434
changes in the net charge and surface properties of the glutaraldehyde-inactivated 435
case of -CF membranes a very low dead-cell adherence, as evidenced by the low 437
coverage area was found for dead cells (Fig. 9C) and for live cells (see Fig. 8). 438
Overall, these findings clearly indicate that the convective force driven by the cross-439
flow is the dominant factor responsible for bacterial cell (and other similar colloids) 440
transport to the membrane. 441
Discussion 442
Cross-flow is an important process in water and wastewater membrane separation 443
systems in which the main stream (feed) flows in parallel to the membrane walls, 444
while the permeate stream flows perpendicularly to the feed stream, towards the 445
membrane wall. A major operational problem in this process is the build-up of a 446
biofouling layer, which blocks the membrane and causes significant energy losses. In 447
order to study the contribution of the permeation drag force in the creation of a 448
biofouling layer, a tubular flow-through cell system, mimicking simple pipe-flow 449
conditions, with and without permeate flow was operated. We found that membranes 450
operating in cross-flow regime were colonized very rapidly, already causing a 451
reduction of permeate flux of approx. 22% within the first hour. These findings are in 452
line with previous observations of membrane colonization which occurred within a 453
matter of minutes (34). In the absence of permeation (i.e, only parallel flow), the 454
deposition of bacteria was slower since the planktonic bacteria had to overcome the 455
parallel drag forces to reach the surface, as in the generic case of biofilm initiation in 456
flowing systems, and consequently biofilm developed slowly. Similarly, Kang et al 457
(31) reported that even in the absence of permeate stream there is deposition of 458
bacteria on the membrane. 459
Structural parameters characterizing the biofilm layer, such as thickness, biovolume 460
and bacterial density, increased gradually as the biofilm developed. Interestingly, the 461
differences in these parameters between the +CF and –CF membranes gradually 462
decreased with running time, converging to an almost similar magnitude after 6 days 463
of operation. This convergent time-profile can be explained by two processes 464
occurring in parallel: (i) as planktonic cells attached to the membrane, settled and 465
started to form biofilm (~12-20 h) the +CF membrane became clogged and the 466
permeate flux decreased in an exponential pattern, resulting in lower permeate drag 467
force that transports bacteria and dissolved nutrients to the membrane surface; (ii) the 468
–CF membrane slowly developed in a conventional biofilm pattern under diffusive 469
conditions. Moreover, the hydraulic conditions applied (retention time < doubling 470
time of planktonic cells) favored proliferation of attached vs. planktonic bacteria, 471
whose concentration in the system consequently decreased. These events gradually 472
reduced the influence of convection forces towards the membrane surface due to 473
permeate flux. 474
Our findings further show that transport of bacteria to the membrane surface (by 475
convection force) is the main cause of biofilm enhancement, while the flux of 476
nutrients to the biofilm is a less important mechanism. This effect is most significant 477
at the early stages of the biofilm development, when the active transport of planktonic 478
cells towards the membrane surface is at its maximum and the dependency of the 479
attached bacteria (still at a monolayer stage) on a nutrients flux is less crucial. Once 480
the biofilm has been fully developed, the dominant contribution of the permeate 481
stream is by nutrients supply, even though at this stage the permeate flux is 482
significantly lower than at the early stages. Therefore, both effects of permeation are 483
important to biofilm development, but their relative magnitude differs at the different 484
phases of development. 485
Twitching and swarming motility were found to be important for cell aggregation (25, 486
43) and hence the creation of the biofouling, especially in the early stages (12, 55). 487
Therefore, dead cells are not supposed to be able to perform active adherence actions, 488
but to be all dependent on adsorption due to chemical interaction forces (31) and the 489
presence (or absence) of permeation drag force. P. putida exhibits surface motility
490
similar to swarming at room temperature (18-28°C), the temperature applied in this 491
research. At this temperature (but not at 30°C) the bacteria produce type four pili and 492
polar flagellum. P. putida exhibits flagella independent surface movement, but the pili
493
and LPS-O antigen are required for surface movement (36). Although these results 494
were obtained for P. putida KT2440, the only fully sequenced P. putida strain, they
495
may be applied for P. putida S12. Indeed, microarray hybridizations showed that S12
496
exhibits the highest genomic similarity to KT2440 (5). Our results indicate that in the 497
case of cross-flow filtration, the permeation drag force overcomes the need for 498
bacterial motility, and therefore dead cells will reach the membrane surface in an 499
equal amount to the live cells. This suggests that under the influence of the 500
permeation drag force, self-motility is not essential for primary colonization. 501
A study on four strains of bacteria that produce biofilms on RO membranes suggested 502
that in the presence of permeation , convective permeate flow reduces the dependency 503
of bacterial cells on flagella-mediated swimming motility in establishing the initial 504
cell-to-surface contact (45). Our findings support this hypothesis. In a static system, 505
flagellar motility is important for P. aeruginosa surface attachment, whereas type IV
506
pili facilitate microcolony formation (43). However, type IV pili and flagellar motility 507
do not significantly affect biofilm formation in a constantly flowing system (16). This 508
suggests that cells subjected to shear force, have limited surface movement via type 509
IV twitching motility and the initial microcolony formation is affected mostly by 510
other mechanisms, primarily cellular division rather than a combination of cell 511
clustering and division. 512
In conclusion, our findings indicate that in membrane separation systems containing 513
considerable loads of microorganisms (such as in the case of sea water desalination 514
plants and wastewater treatment plants, in which bacterial concentrations of 105-106 515
CFU/ml are present), the convective transport of bacteria to the membrane remains 516
the main cause for biofilm formation. Furthermore, our results suggest that 517
bacteriostatic pretreatment of the feedwater to reduce bacterial colonization may not 518
be very helpful in membrane facilities, since the dead cells will deposit on the 519
membrane wall and cause clogging. That is, efficient removal of feed microorganisms 520
by physicochemical and/or physical separation should be performed. Yet, limiting 521
nutrients availability in the feed seems to remain the most effective countermeasure 522
for biofouling control as it represents potential biomass. 523
Acknowledgments 524
This work was supported by Fund for Promotion of Research at the Technion and 525
Grand Water Research Institute, Technion, Haifa, and by the Infrastructure 526
Program of the Ministry of Science and Technology of Israel. We are grateful to Shiri 527
Klein for providing us the bacteria used in this study. 528
529
References 530
1. Aizawa, S. I. 1996. Flagellar assembly in Salmonella typhimurium. Mol.
531
Microbiol. 19:1-5. 532
2. Al-Ahmad, M., F. A. A. Aleem, A. Mutiri, and A. Ubaisy. 2000. Biofuoling 533
in RO membrane systems Part 1: Fundamentals and control. Desalination 534
132:173-179. 535
3. Araujo, J. C., F. C. Teran, R. A. Oliveira, E. A. Nour, M. A. Montenegro, 536
J. R. Campos, and R. F. Vazoller. 2003. Comparison of 537
hexamethyldisilazane and critical point drying treatments for SEM analysis of 538
anaerobic biofilms and granular sludge. J. Electron. Microsc. (Tokyo) 52:429-539
433. 540
4. Baker, J. S., and L. Y. Dudley. 1998. Biofouling in membrane systems - A 541
review. Desalination 118:81-89. 542
5. Ballerstedt, H., R. J. M. Volkers, A. E. Mars, J. E. Hallsworth, V. A. 543
Martins dos Santos, J. Puchalka, J. van Duuren, G. Eggink, K. N. 544
Timmis, J. A. M. de Bont, and J. Wery. 2007. Genomotyping of 545
Pseudomonas putida strains using P. putida KT2440-based high-density DNA
546
microarrays: implications for transcriptomics studies. Appl. Microbiol. 547
Biotechnol. 75:1133-1142. 548
6. Barthel, K. U. 2007. Volume Viewer Plugin for ImageJ, 1.31 ed, Berlin. 549
7. Bishop, P. L. 2007. The role of biofilms in water reclamation and reuse. 550
Water Sci. Technol. 55:19-26. 551
8. Bockelmann, U., A. Janke, R. Kuhn, T. R. Neu, J. Wecke, J. R. Lawrence, 552
and U. Szewzyk. 2006. Bacterial extracellular DNA forming a defined 553
9. Bos, R., H. C. van der Mei, and H. J. Busscher. 1999. Physico-chemistry of 555
initial microbial adhesive interactions - Its mechanisms and methods for study. 556
FEMS Microbiol. Rev. 23:179-230. 557
10. Bowen, W. R., A. S. Fenton, R. W. Lovitt, and C. J. Wright. 2002. The 558
measurement of Bacillus mycoides spore adhesion using atomic force
559
microscopy, simple counting methods, and a spinning disk technique. 560
Biotechnol. Bioeng. 79:170-179. 561
11. Characklis, W. G., and K. C. Marshall. 1990. Biofilms. Wiley, New York. 562
12. Chen, G., and K. A. Strevett. 2003 Microbial surface thermodynamics and 563
interactions in aqueous media. J Colloid Interface Sci. 261:283-290. 564
13. Choy, W. K., L. Zhou, C. K. Syn, L. H. Zhang, and S. Swarup. 2004. 565
MorA defines a new class of regulators affecting flagellar development and 566
biofilm formation in diverse Pseudomonas species. J. Bacteriol.
186:7221-567
7228. 568
14. Costerton, J. W., P. S. Stewart, and E. P. Greenberg. 1999. Bacterial 569
biofilms: A common cause of persistent infections. Science 284:1318-1322. 570
15. Davey, M. E., and A. O'Toole G. 2000. Microbial biofilms: from ecology to 571
molecular genetics. Microbiol. Mol. Biol. Rev. 64:847-867. 572
16. De Kievit, T. R., R. Gillis, S. Marx, C. Brown, and B. H. Iglewski. 2001. 573
Quorum-sensing genes in Pseudomonas aeruginosa biofilms: their role and
574
expression patterns. Appl. Environ. Microbiol. 67:1865-1873. 575
17. Dennis, J. J., and G. J. Zylstra. 1998. Plasposons: Modular self-cloning 576
minitransposon derivatives for rapid genetic analysis of gram-negative 577
bacterial genomes. Appl. Environ. Microbiol. 64:2710-2715. 578
18. Flemming, H. C. 2002. Biofouling in water systems-cases, causes and 579
countermeasures. Appl. Microbiol. Biotechnol. 59:629-640. 580
19. Flemming, H. C., G. Schaule, T. Griebe, J. Schmitt, and A. 581
Tamachkiarowa. 1997. Biofouling - the Achilles heel of membrane 582
processes. Desalination 113:215-225. 583
20. Flemming, H. C., and J. Wingender. 2001. Relevance of microbial 584
extracellular polymeric substances (EPSs) - Part I: Structural and ecological 585
aspects. Water Sci. Technol. 43:1-8. 586
21. Forster, B., D. Van de Ville, J. Berent, D. Sage, and M. Unser. 2004. 587
Complex wavelets for extended depth-of-field: A new method for the fusion of 588
multichannel microscopy images. Microsc. Res. Tech. 65:33-42. 589
22. Gjermansen, M., P. Ragas, C. Sternberg, S. Molin, and T. Tolker-Nielsen. 590
2005. Characterization of starvation-induced dispersion in Pseudomonas
591
putida biofilms. Environ. Microbiol. 7:894-906.
592
23. Gjermansen, M., P. Ragas, and T. Tolker-Nielsen. 2006. Proteins with 593
GGDEF and EAL domains regulate Pseudomonas putida biofilm formation
594
and dispersal. FEMS Microbiol. Lett. 265:215-224. 595
24. Gorby, Y. A., S. Yanina, J. S. McLean, K. M. Rosso, D. Moyles, A. 596
Dohnalkova, T. J. Beveridge, I. S. Chang, B. H. Kim, K. S. Kim, D. E. 597
Culley, S. B. Reed, M. F. Romine, D. A. Saffarini, E. A. Hill, L. Shi, D. A. 598
Elias, D. W. Kennedy, G. Pinchuk, K. Watanabe, S. Ishii, B. Logan, K. H. 599
Nealson, and J. K. Fredrickson. 2006. Electrically conductive bacterial 600
nanowires produced by Shewanella oneidensis strain MR-1 and other
601
microorganisms. Proc. Natl. Acad. Sci. USA 103:11358-11363. 602
25. Harshey, R. M. 2003. Bacterial motility on a surface: many ways to a 603
common goal. Annu. Rev. Microbiol. 57:249-273. 604
26. Harshey, R. M. 1994. Bees aren't the only ones: swarming in gram-negative 605
bacteria. Mol. Microbiol. 13:389-394. 606
27. Hartmans, S., M. J. van der Werf, and J. A. de Bont. 1990. Bacterial 607
degradation of styrene involving a novel flavin adenine dinucleotide-608
dependent styrene monooxygenase. Appl. Environ. Microbiol. 56:1347-1351. 609
28. Hickman, J. W., D. F. Tifrea, and C. S. Harwood. 2005. A chemosensory 610
system that regulates biofilm formation through modulation of cyclic 611
diguanylate levels. Proc. Natl. Acad. Sci. USA 102:14422-14427. 612
29. Hoh, J. H., and C. A. Schoenenberger. 1994. Surface morphology and 613
mechanical properties of MDCK monolayers by atomic force microscopy. J. 614
Cell Sci. 107:1105-1114. 615
30. Ivnitsky, H., I. Katz, D. Minz, G. Volvovic, E. Shimoni, E. Kesselman, R. 616
Semiat, and C. G. Dosoretz. 2007. Bacterial community composition and 617
structure of biofilms developing on nanofiltration membranes applied to 618
wastewater treatment. Water Res. 41:3924-3935. 619
31. Kang, S. T., A. Subramani, E. M. V. Hoek, M. A. Deshusses, and M. R. 620
Matsumoto. 2004. Direct observation of biofouling in cross-flow 621
microfiltration: mechanisms of deposition and release. J. Membr. Sci. 622
244:151-165. 623
32. Klausen, M., M. Gjermansen, J. U. Kreft, and T. Tolker-Nielsen. 2006. 624
Dynamics of development and dispersal in sessile microbial communities: 625
examples from Pseudomonas aeruginosa and Pseudomonas putida model
626
biofilms. FEMS Microbiol. Lett. 261:1-11. 627
33. Korber, D. R., J. R. Lawrence, and D. E. Caldwell. 1994. Effect of motility 628
on surface colonization and reproductive success of Pseudomonas fluorescens
629
in dual-dilution continuous-culture and batch culture systems. Appl. Environ. 630
Microbiol. 60:1421-1429. 631
34. Li, H., A. G. Fane, H. G. L. Coster, and S. Vigneswaran. 1998. Direct 632
observation of particle deposition on the membrane surface during crossflow 633
microfiltration. J. Membr. Sci. 149:83-97. 634
35. Madwar, K., and H. Tarazi. 2003. Desalination techniques for industrial 635
wastewater reuse. Desalination 152:325-332. 636
36. Matilla, M. A., J. L. Ramos, E. Duque, J. de Dios Alché, M. Espinosa-637
Urgel, and M. I. Ramos-González. 2007. Temperature and pyoverdine-638
mediated iron acquisition control surface motility of Pseudomonas putida.
639
Environ Microbiol. 9:1842-1850. 640
37. Merod, R. T., J. E. Warren, H. McCaslin, and S. Wuertz. 2007. Towards 641
automated analysis of biofilm architecture: Bias caused by extraneous CLSM 642
images. Appl. Environ. Microbiol. 73:4922-4930. 643
38. Mueller, L. N., J. F. de Brouwer, J. S. Almeida, L. J. Stal, and J. B. 644
Xavier. 2006. Analysis of a marine phototrophic biofilm by confocal laser 645
scanning microscopy using the new image quantification software PHLIP. 646
BMC Ecol. 6:1-15. 647
39. Mueller, R. F. 1996. Bacterial transport and colonization in low nutrient 648
environments. Water Res. 30:2681-2690. 649
40. Neu, T., G. D. Swerhone, and J. R. Lawrence. 2001. Assessment of lectin-650
binding analysis for in situ detection of glycoconjugates in biofilm systems. 651
41. Neu, T. R., and J. R. Lawrence. 1999. Lectin-binding analysis in biofilm 653
systems. Met. Enzymol. 310:145-152. 654
42. O'Toole, G., H. B. Kaplan, and R. Kolter. 2000. Biofilm formation as 655
microbial development. Ann. Rev. Microbiol. 54:49-79. 656
43. O'Toole, G. A., and R. Kolter. 1998. Flagellar and twitching motility are 657
necessary for Pseudomonas aeruginosa biofilm development. Mol. Microbiol.
658
30:295-304. 659
44. Otsu, N. 1979. Threshold selection method from gray-level histograms. IEEE 660
Trans. Syst. Man Cybern. 9:62-66. 661
45. Pang, C. M., P. Y. Hong, H. L. Guo, and W. T. Liu. 2005. Biofilm 662
formation characteristics of bacterial isolates retrieved from a reverse osmosis 663
membrane. Environ. Sci. Technol. 39:7541-7550. 664
46. Pereira, M. O., M. Kuehn, S. Wuertz, T. Neu, and L. F. Melo. 2002. Effect 665
of flow regime on the architecture of a Pseudomonas fluorescens biofilm.
666
Biotechnol. Bioeng. 78:164-171. 667
47. Pratt, L. A., and R. Kolter. 1998. Genetic analysis of Escherichia coli
668
biofilm formation: roles of flagella, motility, chemotaxis and type I pili. Mol. 669
Microbiol. 30:285-293. 670
48. Purevdorj, B., J. W. Costerton, and P. Stoodley. 2002. Influence of 671
hydrodynamics and cell signaling on the structure and behavior of 672
Pseudomonas aeruginosa biofilms. Appl. Environ. Microbiol. 68:4457-4464.
673
49. Simm, R., J. D. Fetherston, A. Kader, U. Romling, and R. D. Perry. 2005. 674
Phenotypic convergence mediated by GGDEF-domain-containing proteins. J. 675
Bacteriol. 187:6816-6823. 676
50. Solomon, E. B., and K. R. Matthews. 2006. Interaction of live and dead 677
Escherichia coli O157:H7 and fluorescent microspheres with lettuce tissue
678
suggests bacterial processes do not mediate adherence. Lett. Appl. Microbiol. 679
42:88-93. 680
51. Song, L. F., and M. Elimelech. 1995. Particle deposition onto a permeable 681
surface in laminar-flow. J. Colloid Interface Sci. 173:165-180. 682
52. Stoodley, P., K. Sauer, D. G. Davies, and J. W. Costerton. 2002. Biofilms 683
as complex differentiated communities. Ann. Rev. Microbiol. 56:187-209. 684
53. Tischler, A. D., and A. Camilli. 2004. Cyclic diguanylate (c-di-GMP) 685
regulates Vibrio cholerae biofilm formation. Mol. Microbiol. 53:857-869.
686
54. Tolker-Nielsen, T., U. C. Brinch, P. C. Ragas, J. B. Andersen, C. S. 687
Jacobsen, and S. Molin. 2000. Development and dynamics of Pseudomonas
688
sp. biofilms. J. Bacteriol. 182:6482-6489. 689
55. Turnbull, G. A., J. A. Morgan, J. M. Whipps, and J. R. Saunders. 2001. 690
The role of motility in the in vitro attachment of Pseudomonas putida PaW8 to
691
wheat roots. FEMS Microbiol. Ecol. 35:57-65. 692
56. Watnick, P. I., and R. Kolter. 1999. Steps in the development of a Vibrio
693
cholerae El Tor biofilm. Mol. Microbiol. 34:586-595.
694
57. Wimpenny, J. 2000. Structural determinants in biofilm formation, p. 466. In
695
L. V. Evans (ed.), Biofilms: Recent advances in their study and control. 696
Harwood Academic Publishers, Amsterdam. 697
58. Yang, C. H., J. A. Menge, and D. A. Cooksey. 1994. Mutations affecting 698
hyphal colonization and pyoverdine production in Pseudomonads antagonistic
699
antagonistic toward Phytophthora parasitica. Appl. Environ. Microbiol.
700
List of figures 702
Figure 1. Schematic representation of cross flow ("+CF") vs. non cross-flow 703
filtration ("-CF"). Under cross-flow filtration there is a permeate stream which acts 704
perpendicularly to the feed stream, whereas under no cross-flow regime there is a 705
unidirectional flow. 706
Figure 2. Schematic diagram of the dual channel tubular flow-through cell system. 707
Cells were 13 cm length by 12.5 mm diameter. A concentrated nutrient fed solution 708
was directly diluted with distilled water to the desired concentration in a 140 ml 709
reactor by regulating the flow of the feed and dilution peristaltic pumps. Pressure 710
gages and rotameters were used for continuous determination membrane permeability. 711
The system was run under sterile conditions. Membrane modules can be seen on the 712
upper-left corner (Flow-through cells). Where indicated, a third membrane reactor 713
was added. 714
Figure 3. Typical time-profile of the relative permeability of a +CF membrane due to 715
the build-up of the biofouling layer. The asymptotic value of the permeate flux 716
corresponds to the fully developed biofilm (biofouling) layer. Initial permeability was 717
0.6±0.06 l/m2.h-bar. 718
Figure 4. FE-SEM micrographs of 20 and 144 h-old biofilm, grown under cross-flow 719
and non-cross-flow conditions. After 20 h, noticeable differences in the coverage area 720
and biofilm development can be easily seen. After 144 h, both biofilms had developed 721
to a complex 3D structure. However, in the –CF membrane not fully covered areas 722
could still be seen. 723
Figure 5. Bacterial density of the biofilm at different times, measured as live-count 724
per membrane area. Values given represent the average of at least 4 independent 725
measurements, obtained from four independent experiments, performed as a set of 726
two parallel runs each time. Bars represent SD. Bacterial density of –CF at 1 and 12 h 727
represent an estimate only, since their values were lower than detection limit. 728
Figure 6. Biofilm structure. (A) Typical CLSM micrograph of a 144 h-old –CF 729
biofilm. The EPS covers the bacteria on top of the bacterial structure. Maximal 730
intensity merge of all the Z-stack; (B) 3D image of the biofilm structure; (C) Relative 731
abundance of the EPS and bacteria as measured by coverage area at different Z-732
depths. The green line represents EPS and the red color represents bacteria. Total 733
thickness: 22 µm (1 μm per cross-section). Note that on the first three cross-sections 734
EPS are more abundant while all the deeper cross-sections bacterial biovolume is 735
dominant. 736
Figure 7. Typical image of a 20 h-old +CF biofilm. (A) Maximal intensity merge of 737
all the Z-stack; (B) 3D imaging of the biofilm structure, cut in the middle of the 738
biofilm; (C) Relative abundance of the EPS and bacteria as measured by coverage 739
area at different Z-depths. The green line represents EPS and the red color represents 740
bacterial biovolume. Total thickness: 13 µm (1 μm per cross-section). Note that on the 741
first nine sections the EPS is more abundant while in all the deeper cross-742
sections bacterial biovolume is predominant. 743
Figure 8. SEM micrographs of a -CF membrane (A) and +CF membrane (B), after 1 744
hour of running time. The +CF membrane is populated with bacteria adhered to the 745
surface, while the –CF is clean of adhered bacteria. Scale bar=20 µm. 746
Figure 9. CLSM micrographs of live (A) and dead (B) cells deposited under cross-747
flow filtration and dead cells under non-cross-flow filtration (C). Note the notably 748
lower number of bacteria attached without cross-flow. Live cells grown under non-749
cross-flow filtration displayed a similar picture. 750
Figure 1
Feed Retentate
Parallel flow
membrane
+Cross-flow
Permeate Perpendicular flow
Feed Flow out
Parallel flow
membrane
-Cross-flow
Feed Retentate
Parallel flow
membrane
+Cross-flow
Permeate Perpendicular flow
Feed Retentate
Parallel flow
membrane membrane membrane
+Cross-flow
Permeate Perpendicular flow
Permeate Perpendicular flow Perpendicular flow
Feed Flow out
Parallel flow
membrane
-Cross-flow
Feed Flow out
Parallel flow
membrane membrane membrane
-Cross-flow
[image:33.612.98.562.79.593.2]Figure 2
Water
Nutrients+ antibiotic
R
eact
or
Recycling pump
Feed pump Dilution
pump
Overflow
Flowmeter
Flow-through cells -CF +CF
Permeate
Figure 3
0 50 100 150 200
0.00 0.25 0.50 0.75 1.00
Time (hours)
R
e
la
tiv
e
p
e
rm
e
a
b
ility
Figure 4
[image:36.612.96.563.93.543.2]+ Cross-flow
- Cross-flow
20 h
old
144 h
old
Figure 5
12 20 144
0 2 4 6 8 10
+CF -CF
Time (h)
B
a
c
te
ria
l d
e
n
s
it
y
(
lo
g
C
F
U
/c
m
2 )
Figure 6
0 5 10 15 20 25
0 5 10 15 20
25 EPS
Depth (μm)
A
re
a
c
o
v
e
ra
g
e
(%
)
Cells
A
B
C
Figure 7
0 2 4 6 8 10 12 14
0 25 50
75 Cells EPS
Depth (μm)
A
rea
cove
ra
ge
(
%
)
A
B
C
B
Figure 8
A B
41 Figure 9
A
Table 1. Biofilm properties
Thicknessa Bacterial densityb Bacterial/EPS
biovolume ratioc Time
(h)
+CF -CF Ttest +CF -CF +CF -CF Ttest
12 8.5±4.9 2.9±1.8 0.0164 2.0×10⁻² 1.2×10⁻⁵ 0.8±0.6 N.D.d - 20 13.5±4.4 5.5±3.5 0.0021 2.5×10⁻² 2.8×10⁻³ 0.9±0.3 1.2±0.5 0.2296 144 40.5±1.2 20.4±15.1 0.1475 3.7×10⁻¹ 1.0×10⁻¹ 8.6±4.9 4.0±2.2 0.0583 aBiofilm thickness (µm), measured by CLSM. Values represent mean ±standard
deviation of 15 replicates.
bValues are given as CFU normalized to biovolume unit (µm3) as a ratio of at least two independent experiments, measured at least ten times each. Standard deviations and Ttest could not be computed since bacterial cell counts were done independently of the biovolume measurements.
cValues are gives as a ratio of bacterial biovolume (µm3) to EPS biovolume (µm3). dN.D.: Not detectable.