Viscous flow through a bed of settled aggregates:
Evolution of tubes void of particles
Avinoam Nir
Department of Chemical Engineering, Technion, Haifa 32000, Israel
Available online 1 February 2008
Abstract
Observations show that, when a viscous fluid flows vertically through a bed of settled flocculated aggregates, particles are emerged from locations on the upper surface of the bed, as a volcano process, and hollow tubes are created in the bed though the latter remains basically stable. A theoretical model is presented to explain this odd phenomenon from the onset of particle motion to the development of the tubular cavities and the particles' deposits around them. Analytical and numerical calculations are performed to show fluid streamlines and particle trajectories. © 2008 Elsevier B.V. All rights reserved.
Keywords:Viscous flow; Aggregates; Agglomerates; Evolution; Particles
1. Introduction
A layer of particles settled in a viscous fluid is a porous bed that is held intact by gravity and by inter-particle forces when they exist. A common example is when the settling particles themselves are agglomerates or aggregates comprised of nano-particles that stick together due to surface attraction or of micron-size particles that adhere to each other due to the presence of a flocculating agent. Such a layer can become unstable under various conditions. It can show structural instability during the consolidation stage (see several papers by Biot[1], and several papers thereafter). Analyses of such instability for saturated and unsaturated media are commonly conducted via the use of numerical methods using finite difference and finite element approach (see, e.g.[2–4]). Convective instability can arise when the layer is subjected to temperature gradient and various boundary conditions that induces natural convection in the layer (e.g.[5–7]and many others). A porous bed of settled particles can also become elevated when the viscous fluid flows through it with intensity higher than the minimum fluidization velocity, thereby rendering the bed fluidized.
The purpose of this communication is not to consider any of the well celebrated instability analyses of the settled bed but to focus on yet another form of disintegration of it. During a study of enhanced sedimentation of flocculating suspension under a
conical inclined surface (see e.g.[8] for enhanced sedimenta-tion), Mund [9] observed that after the final stages of bed consolidation the structure of the bed was not uniform. The plan form of the upper surface of the bed (lower surface of the fluid above it) showed an array of volcanoes of the settled particles, and these domains were interacting with each other. Each such volcano had a vertical tube in its middle devoid of the settled particles. It appeared that during the last stages of compression the upward flowing suspending fluid dragged with it particles from the settled bed at various locations while the rest of the bed consolidated steadily. Those particles then settled freely in the vicinity of the spot where they were lifted.
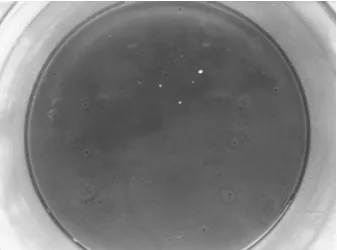
To verify this observation we conducted yet another experi-ment where a uniform settled bed of flocculated silica aggregates was saturated with mineral oil creating an oil layer of similar thickness above it. The layers were placed in a Buchner funnel and a small pressure difference opposing gravity was very slowly and carefully applied, and was kept constant. The average upward flow of the oil was somewhat below the minimum fluidization velocity for a single aggregate to be freely suspended. Yet the observation revealed exactly the same phenomenon that was seen in the settling suspension. For illustration we show the upper surface of the porous layer at early stages and at the final stage of the flow. These are depicted inFigs. 1 and 2.
InFig. 1we observe randomly distributed black holes devoid of particles and piles of particles accumulating around them. Some of the piles do not show, as yet, the formation of a hole in
Powder Technology 183 (2008) 333–339
www.elsevier.com/locate/powtec
E-mail address:[email protected].
them. Since the demonstration was conducted with average flow speeds that cannot lift the aggregates, it appears that this average speed does not prevail everywhere and there are regions in the settled bed where a high speed is experienced. The pressure difference is uniform horizontally, hence, the observa-tion suggests that the average porosity and permeability in the randomly settled layer is not uniform.
The final state of the upper surface of the settled bed is shown inFig. 2. By now all the volcanoes that could have been induced, under the particular pressure difference and oil velocity, were created and, because of their high density over the surface, they interact with each other. The plan form has a topography similar in shape to that obtained when circular patterns on a surface interact with each other while they span the entire surface area.
In this paper we present a model predicting the onset of creation of such volcanoes and the evolution of the cavities in the bed and the piles of particles around them. The model is not an instability analysis but is, rather, based on straight forward flow models in a porous layer and in the viscous fluid layer above it that exploits the possibility of having a not entirely homogeneous porous bed with a distribution of spots with permeability higher than the average. We resort to analytical solutions of the flow equations (Darcy and Stokes) when possible and to a numerical software when the geometry becomes somewhat more involved (FLUENT). The use of this software was benchmarked against known solutions in porous media.
2. Basic model
Consider a bed of particles that has settled under gravity. The particles are micron-size aggregates that consist of submicron or nano-size particles that have agglomerated in the suspension prior to sedimentation by the presence of flocculants or by the action of weak attractive surface forces. We shall refer to the settled flocculated agglomerates as aggregates. The space within and between the aggregates is filled by the viscous fluid of the original suspension, which has viscosity and density denoted respectively byµand ρ. This fluid also occupies the region above the settled bed. Let the thickness of the settled bed
and the layer of viscous fluid above it bed1andd2, respectively. For simplicity we assume that the aggregates are spheres of uniform size with radiusaand that the dimensionsd1andd2as well as the lateral bed dimension, all being on laboratory scale, are infinitely large when compared to the micron-sizea.
Above the layer of clear fluid the pressure,p, is atmospheric and hence we putp= 0 there. At the bottom of the settled layer we apply a somewhat higher pressure, sayp=p1, such that a slow flow of the viscous fluid is directed upward through the settled fixed porous layer. The fluid that emerges from the upper side of the porous layer moves in the pure fluid layer in a slow viscous inertia-less flow.
The flow in the porous layer, denoted here byD1, is assumed to be a Darcy flow and the superficial velocity,q, obeys
q¼ k
Ajp inD1 ð1Þ
where k is the permeability of the porous layer. The flow is considered incompressible, hence ∇dq= 0 and the pressure field is harmonic. In the pure fluid layer, denoted byD2, the equations of motion are the Stokes equations
Aj2u¼jpandju¼0 inD
2 ð2Þ
where u is the velocity field. The boundary and interfacial conditions to be satisfied are of the following form
p¼p1 on S1 ð3Þ
p¼pþ on Sint ð4Þ
un ¼uþn on Sint ð5Þ
ut¼0 on Sint ð6Þ
p¼p0¼0 on S0 ð7Þ
and
ju¼0 on S0: ð8Þ
[image:2.595.344.513.69.195.2]Here, S1denotes the bottom surface of the porous layer,S0 denotes the free surface of the viscous fluid layer andSintis the interface between the two layers. The superscripts−and + refer
[image:2.595.75.244.577.702.2]Fig. 1. Onset of appearance of holes and void tubes in a porous layer of settled aggregates in a Buchner funnel. The holes are well spaced and are distributed randomly, and the piles of aggregates around them do not interact. View through the transparent mineral oil top layer. Dimension shown is approximately real.
to position below and above, respectively. Hence, conditions (4) and (5) indicate the requirement that the pressure and normal velocity be continuous acrossSint(see e.g. Jones[10]; Nir[11]). As is indicated in condition (6) we neglect the tangential velocity component onSint as it is expected to be minute. If desired it can be added in the form of a small slip velocity component ([12,11]) but its addition is not expected to alter the results of this model in any qualitative manner. Condition (8) indicates that all stresses should vanish on the top free surface.
We shall consider here two main cases. In the first we consider porous and viscous layers that extend to infinity in the lateral direction. In the other case the layers are of finite lateral extent. For layers that extend to infinity the solution to Eqs. (1) and (2) subject to conditions (3)–(8) has the form of a uniform vertical flow. Since the hydrostatic pressure atSintispint=ρgd2, withgbeing the gravitational acceleration, the intensity of the flow everywhere inD1andD2is
q¼u¼k
A
p1qgd2
ð Þ
d1 : ð
9Þ
Hence the flow in the viscous layer is also a constant directional flow with the interface moving vertically and uni-formly with the same speed.
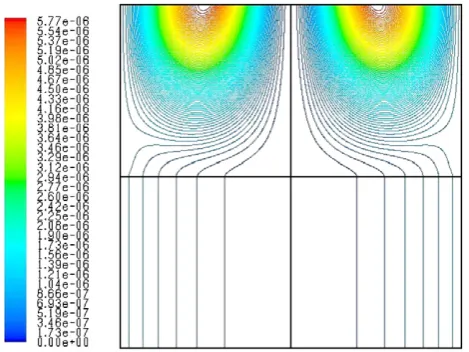
If the layers have a finite lateral extent with solid side wall, additional conditions should be applied at these boundaries. For example, if the layers have a circular shape with a radiusRand if no-slip conditions are applied at this side boundary the flow patterns change.Fig. 3 depicts streamline pattern for the case R=d1=d2. This pattern also serves as a qualitative benchmark for the use of the software FLUENT in this paper. Evidently, as is expected, the flow in the porous layer remains unidirectional and vertical with a constant velocity, but the increasing shear resistance near the side boundary induces a weak toroidal vortex in the viscous layer with the weak flow directed upward at the center and downward near the wall.
3. Departure of aggregates from the interface
3.1. Streamline patterns
When the flow given in Eq. (9) is very slow the structure of the layer of settled aggregates remains intact. In general, since this layer was formed by sedimentation of the aggregates in the suspension, the concentration of aggregates in the layer is expected to be that of a random order with a slight additional compression due to the weak attractive force between touching sub-particles of neighboring agglomerates. In such layers it is expected that the volume fraction occupied by the aggregates is ϕ~ 0.6 to 0.65, i.e. a void fraction ofε~ 0.35 to 0.4. (The actual void fraction is somewhat higher since the aggregates themselves are porous, however, this is not particularly relevant to the analysis at hand.) It is expected that there are slight local deviations from the average value ofϕdue to the random nature of the interaction between the aggregates in the sedimentation and consolidation process. Nevertheless, these are localized and have a microscale and are not expected to make significant change in the pattern of flow described by Eq. (9) that is depicted inFig. 3as long as the flow is relatively weak.
We next increase slowly and gradually the pressurep1. The intensity of the flow increases and induces local elevated stresses in the viscous fluid that flows within the porous layer. The aggregates are now subject to an increased viscous force which is directed vertically on the average. This force is resisted by the net gravity force on each aggregate and by the inter-aggregate attraction which is basically isotropic for inter-aggregates in the bulk of D1. Note that if the local deviations from the average value of ϕ are considerable, local failure of the structure in the bulk may occur and subsequently lead to an instability during the consolidation of the porous layer[1].
However, in the case of small deviations from ϕthe most vulnerable region is the upper layer of aggregates atSint. These top aggregates interact with fewer neighbors and, thus, the attraction forces that keep them in the matrix are weaker. Furthermore, the viscous stress acting on an aggregate positioned at the top layer is stronger at its lower side (the porous layer side) than that on its upper side (the viscous layer side) since the permeability increases to infinity along the length scale of a single aggregate when the flow passes from Darcy type to Stokes flow and the actual speed of the fluid decreases. It can be anticipated then that, when the average flow is slightly below the minimum fluidization threshold for a single aggregate there will be spots onSintwhere the flow is slightly above it. In this region, just above such a spot the pattern of streamlines will differ from the uniform parallel upward direction.
[image:3.595.51.286.537.713.2]Consider a region nearSintwhere such a spot exists. We assume that on Sint there exists a small region, Sb, where the normal component of the flow isun=ubandubis larger than the reference velocityuref=k(p1−ρdg2) /μd1that emerges normally over the rest of the entire surface. For illustration we assume that the small region is circular with radius b where bNa such that several aggregates can occupy it. Furthermore, we assume that the dimension of this region is very small,b≪d1,b≪d2andb≪R so that the flow can be simulated as a uniform flow from a source
with radiusbinto a half space, riding on a constant stream with velocityurefwhich also prevails outside this region. We define non-dimensional cylindrical coordinates for the axi-symmetric problem (z,r) normalized byb. The viscous flow problem is formulated in terms of the non-dimensional Stokes stream function,ψ, for the relative velocityv= (u−uref) / (ub−uref), that satisfies
E4w¼0 ð10Þ
whereE2urAAr 1rAAr þAAz22 and with cylindrical velocity compo-nents defined in the usual manner,vz¼1rAAwrandvr¼ 1rAAwz.
The flow is subject to the following boundary conditions on Sint
vz¼1 at 0brb1; vz¼0 atrN1 andvr ¼0 at allr ð11Þ
while elsewhereu→0 asx→∞.
The general solution to Eq. (10) subject to Eq. (11) is[13]
ψ=ψ1+zψ2with E2ψ1,2= 0. The axi-symmetric potentials ψ1 andψ2have the form
w1;2¼r
Z l
0
Að Þk Bð Þk
J1ð Þkr ekzdk: ð12Þ
HereJ1(λr) is the Bessel function of the first kind and first order. In view of the conditions at z= 0 it follows [14,15]
thatAð Þ ¼k J1ð Þk
k andBð Þ ¼k J1ð Þk while the form of the stream
function is, thus,
w¼r
Z l
0
1þkz
ð ÞJ1ð Þkr J1ð Þk ekz
dk
k : ð13Þ
Applying dimensions and adding the undisturbed flow far from the source region we have
̂
w¼ðuburefÞb2wþŵl ¼ðuburefÞb2r
Z l
0
1þkz
ð ÞJ1ð Þkr J1ð Þk ekz
dk k
þ1
2urefb
2r2: ð14Þ
Fig. 4depicts a plot of the dimensionless streamlines.Fig. 4a show the flow relative to the laboratory frame for the caseub= 1.5uref. We see that the streamlines are almost vertical but that there is a slight inclination of the flow to move away from the region above the source. In Fig. 4a we show the relative streamlines expressed in Eq. (13), i.e. as viewed by a spectator moving on a fluid particle moving upward with velocityuref. The drift from the source region sidewise is now vividly clear.
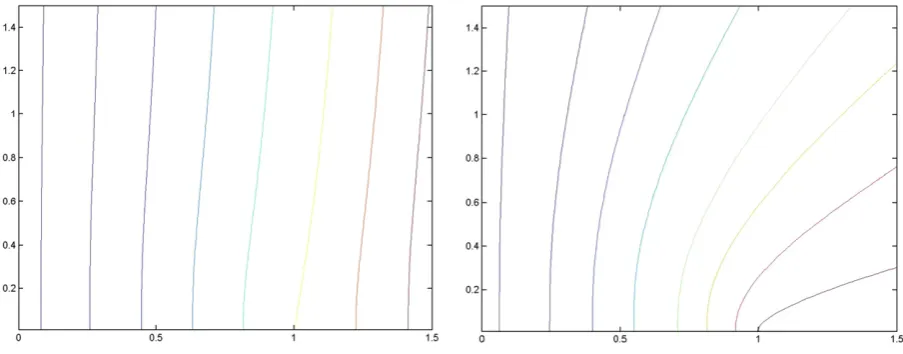
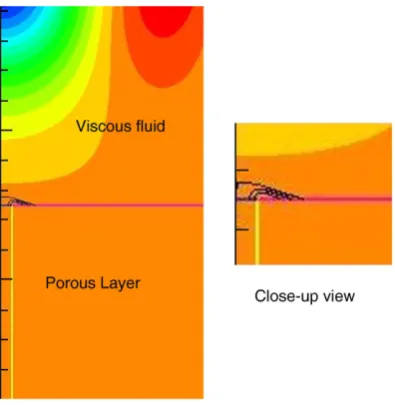
[image:4.595.66.518.69.246.2]Fig. 5 shows patterns obtain for layers with finite dimen-sions, with R=d1=d2= 20b. The conditions on the side walls are no-slip and the source region has under it a cylindrical bed with a permeability that is 1.5 times the average permeability of the bed. A similar pattern is obtained when one forces the side wall to move vertically with the constant speed emerging from the porous layer there. The two boundary conditions apply in the case of non-interaction sources when the side wall is solid or when it is very far apart, respectively. These conditions prevail during most of duration of the process from the onset until the
Fig. 4. Pattern of streamlines emerging from the source regionrbb= 1 at the interface atz= 0, withurefub ¼1:5. (a) Relative to the laboratory. (b) Relative to a fluid
particle moving with velocityuz=uref.
[image:4.595.311.544.534.712.2]final stages where the sources are close enough to interact. Basically, the dimension of the vortex depends on the depth of the viscous fluid layer but changing the latter will not change the pattern qualitatively. The streamlines emerging from the source region at the interface (a circle of radiusb= 1) are bent radially outwards. Hence, fluid particles that emerge from the source area flow radially along the interface and eventually climb upward along the outer wall. With this choice of dimensions (R=d1=d2= 20b) and permeability perturbation, the stagnation point on the axis of symmetry is relatively close to the interface separating the porous layer from the viscous fluid. The location of this point along the axis will change with the size of the vortex above it.
3.2. Particle trajectories
Next we turn to explore the trajectories of aggregates that have detached from the source regionSband are now moving in the viscous fluid while, at the same time, settling under the effect of gravity. The particles are small enough and with the lack of inertia they follow the fluid motion. The addition of the terminal settling velocity is linearly superimposed. Let the trajectory of an aggregate be T(t) with T tð Þ ¼ ffiffiffiffiffiffiffiffiffiffiffiffiffiffiffiffiffiffiffiffiffiffiffiffiffiffiffiTrð Þt 2þ
Tzð Þt 2 q
. The cylindrical components are defined by
Trð Þ ¼t Trð Þ þ0
Z t
0
urdt and Tzð Þ ¼t
Z t
0
uzdt: ð15Þ
For the layers with infinite extent we have the dimensional velocity components calculated from Eq. (14)
ur¼ðuburefÞ
Z l
0
kzJ1ð Þkr J1ð Þk ekzdk
and
uz¼ðuburefÞ
Z l
0
1þkz
ð ÞJ0ð Þkr J1ð Þk ekzdkþurefUg
where the sedimentation velocity isUg¼29ga 2q
aq
ð Þ
A . The initial position of the aggregate onSint, used in Eq. (15), is the radial
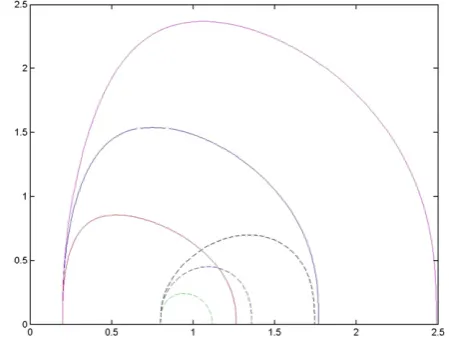
location, (r,z) = (Tr(0),0) at the source region. Sample trajectories of aggregates are shown inFigs. 6 and 7.
In Fig. 6we depict trajectories of particles emerging from various initial radial location on the source circle. The most inner particles experience initially a very weak radial compo-nent (seeFig. 3) and are, thus being lifted higher than the more outer ones. They stay longer in the system before reversing the direction of motion and settling back onto the interface, but at a location outside the source area.
The calculations depicted in Fig. 7 compare aggregate trajectories for various intensity of the reference velocity relative to the sedimentation velocity, Ug. Clearly, and rather expected, the stronger is the reference velocity relative to the sedimentation speed the higher is the extent of elevation and the further is the position of deposition of the lifted particles.
A similar process, yet more profound, is found for the case of layers confined by a side wall at a distance R, and with the permeability under the source area increased by 50% (as inFig. 5). Particle trajectories obtained via numerical calculations are shown in Fig. 8 with R=d1=d2= 20b. Particles that emerge from the source area are lifted but this lift is limited by the structure of streamline that was depicted inFig. 5. Hence, even trajectories of particles that emerge close to the axis of symmetry are confined by the stagnation region near the axis. Nevertheless, particles from all radial locations on the source area follow trajectories that lead them radially outside this area and they eventually pile sidewise. (The discontinuous lines shown in the close-up window are an artifact resulting from the magnification and the choice of resolution of finite elements mesh.)
4. Evolution of aggregate free tubes in the porous layer
[image:5.595.57.279.68.243.2]The erosion process that was initiated atSintcreated a cavity of radiusbat the top of the porous bed. It is anticipated that the resistance to the vertical Darcy flow under this cavity, that was somewhat lower than that in the surrounding layer to begin with, will further diminish since the layer under the circleSbis now depleted from porous material which is replaced by space
Fig. 6. Trajectories of aggregates emerging from the interface atrbb= 1.ub= 1.2ug
anduref= 0.8ug, whereugis the aggregate settling velocity.
Fig. 7. Trajectories of aggregates emerging from the interface at rbb= 1.
Bottom, middle and top curves refer toub= 1.2UgandurefUg ¼0:8;0:9 and 0:95,
[image:5.595.322.547.544.717.2]containing viscous fluid only. The anticipated effect is that the effective permeability underSbwill further increase and, while ∇p remains effectively unchanged, the vertical velocity qz emerging at the bottom of the cavity will be augmented. This is a positive feedback effect that begins as a slight velocity deviation that results in a local lift of aggregates at Sb and continues in the development of a cavity due to the increase in vertical drag on aggregates in the cavity which, as a result, are carried into the viscous layer and are deposited onSintaround the cavity.
The radius of the developing cavity is a result of the balance between the inter-aggregate attraction force on one hand and the tangential shear that is applied on the cavity wall by the vertical flow in it and the drag applied on aggregated by the normal seepage into the cavity from the porous material on the other hand. To illustrate the evolution process assume that a cavity
has already formed under Sb and has the shape of a vertical cylinder devoid of aggregates of radius b. Assume also for simplicity that the bulk of the flow in the porous layer in this region is vertical. If the cavity length isdV, the depth of porous material under this cylinder isdP=d1−dV. It is now a simple exercise to estimate the increase of permeability in the vertical direction there. Let the new developing permeability be denoted by kPV. The effective resistance to flow in the tube and the porous material under it, assuming that∇premains effectively unchanged, is
1 kPV ¼
1 k
dP d1þ
8 b2
dV
d1: ð
16Þ
Since the permeabilityk is much smaller thanb2[16] (recall thatbis larger than the aggregate scalea) it follows that, to a first approximation, the rate at whichkPVincreases equals the rate at whichdPdecreases. In terms of Darcy's equation, the vertical flow under the tube and within it is approximated by
qz¼ kPV
A Ap
Az¼
1
A 1
k dP d1þ
8
b2 1dPd 1
Ap
Az: ð17Þ
If all aggregates at the bottom of the cylindrical cavity are immediately lifted by the flow it follows that the rate at which the cavity evolves is approximated by d dPð Þdt ¼qz. Hence, the time estimate for the evolution of such a tube over the entire thickness of the porous layer is
tf ¼ 1 2
1 kþ
8 b2
Ad1 Ap
Az
: ð18Þ
Note that, sincek≪b2, the time can be estimated by the initial superficial slow vertical velocity in the intact porous layerq(0) under the given pressurep1astfe2qdð Þ10.
We have calculated streamlines and predicted aggregate trajectories for an intermediate state in which the tube devoid of aggregates evolved to half the depth of the porous layer. These are shown inFigs. 9 and 10. The streamlines shown inFig. 9
[image:6.595.60.258.71.274.2]have a pattern similar to the one shown inFig. 5where a cavity did not exist. However, there are two quantitative differences. It is clear that the flow in the porous bed in the vicinity of the
Fig. 9. Streamlines pattern emerging into the viscous fluid from a porous layer having a cavity with radiusb= 1 and depth1
[image:6.595.43.275.543.724.2]2d1.
Fig. 10. Trajectories of aggregates emerging from various radial locations in the cavity. The radius of the cavity isb= 1. The reference velocity isuref= 0.8Ug
[image:6.595.324.530.577.714.2]whereUgis the settling velocity of the aggregate.
cavity is no more unidirectional. Fluid is seeping horizontally into the cylindrical cavity since the resistance to flow there has diminished. As a result, although the permeability under the cavity and elsewhere is constant and uniform, it is evident that the intensity of the vertical flow in it is augmented, and that the flow emerging from the cavity into the viscous fluid layer is stronger than elsewhere. Hence, a rule of thumb is: once a cavity starts to develop the source flow intensifies. As a result, the stagnation point on the axis is pushed upward and fluid particles above the source (cavity) reach higher into the viscous layer before being diverted sidewise.
We conclude that, in this intermediate situation as it is in the initial case discussed in the previous section, the streamlines pattern in the viscous layer has the expected structure that would lead aggregates away from the cavity. It can also be anticipated that the stresses applied by the flow on the aggregates covering the side wall of the cavity are even greater than assumed, thereby leading to enlarge the expected cavity radiusb.
Aggregate trajectories are depicted inFig. 10. They incor-porate gravitational component in the vertical velocity and show again the tendency of the aggregate to deposit around the cavity. Note that the aggregates deposit radially further away from the cavity, compared to what was calculated for the initial case (Fig. 8). This in spite of the fact that the reference velocity here is only 80% of the sedimentation velocity while, when no cavity existed we haduref= 0.95Ug. This is due to the intensity of speed along the diverted streamline which, in the case of existing cavity are much stronger.
5. Conclusions
The peculiar phenomenon, in which tubes void of particles appear when a flocculating suspension is in the final stage of settling and consolidation or when a viscous fluid flows slowly through such settled layer against gravity, has been analyzed. The deviation from a uniform layer is characterized not as an instability but, rather, as a result of deviation in the average permeability of the settled layer. The analysis identified regions in which the permeability is slightly higher than the average in the settled layer and the vertical velocity is strong enough to elevate individual particles from the surface thereby, via a positive feedback process, further augmenting the permeability there. The result is a process of erupting volcanoes in which particles emerge into the flowing fluid, thus creating tubes devoid of particles, and then settle sidewise around these tubes. The theoretical model for infinitely wide layers and for laterally confined layers calculates streamlines and predicts
particles trajectories that demonstrate how such phenomenon can be characterized quantitatively using equations of motion in the porous layer and in the viscous fluid. Indeed, a full quantitative description of the process requires a comprehensive experimental study in which particles and bed parameters are changed, corroborated by appropriated calculations. This deserves a special separate effort.
Acknowledgement
The author thanks R. Spivak and D. Tsemakh for their help in producing the figures.
References
[1] M. Biot, General theory of three dimensional consolidation, J. Appl. Phys. 12 (1941) 155–169.
[2] M.I. Miga, K.D. Paulsen, F.E. Kennedy, von Nuemann's stability analysis of Biot's general two-dimensional theory of consolidation, Int. J. Numer. Methods Eng. 43 (1998) 955–974.
[3] F.J. Gaspar, F.J. Lisbona, P.N. Vabishchevich, A finite difference analysis of Biot's consolidation model, Appl. Numer. Math. 44 (2003) 487–506. [4] R.W. Lewis, C.E. Majorana, B.A. Schrefler, A coupled finite element
model for the consolidation of nonisothermal elastoplastic porous media, Trans. Porous Media 1 (1985) 1573–1634.
[5] N. Salhi, C. Bennouna, H. Bitar, M. Sergent, R.P.T. Luu, P. Vadasz, Convection and stability in a rotating porous layer with alternating direction of the centrifugal body force, Int. J. Heat Mass Transfer 39 (1996) 1639–1647.
[6] J.P. Caltagirone, Stability of a saturated porous layer subject to a sudden rise in surface temperature: comparison between the linear and energy methods, Q. J. Mech. Appl. Math. 33 (1980) 47–58.
[7] M.H. Chang, Thermal convection in superposed fluid and porous layers subjected to a plane Poiseuille flow, Phy. Fluids 18 (2006) 035104. [8] A. Acrivos, E. Herbolzheimer, Enhanced sedimentation in settling tanks
with inclined walls, J. Fluid Mech. 92 (1979) 435–457.
[9] H. Mund, The effect of geometrical structure on the rate of settling of suspensions, M.Sc. Thesis (1978) Technion—IIT (in Hebrew). [10] I.P. Jones, Low Reynolds number flow past a porous spherical shell, Proc.
Camb. Phil. Soc. 73 (1973) 231–238.
[11] A. Nir, Linear shear flow past a porous particle, Appl. Sci. Res. 32 (1976) 313–325.
[12] G.S. Beaver, D.D. Joseph, Boundary conditions of naturally permeable wall, J. Fluid Mech. 30 (1967) 197–207.
[13] L.E. Payne, W.H. Pell, The stokes flow problem for a class of axially symmetric bodies, J. Fluid Mech. 7 (1960) 529–549.
[14] I.S. Gradstein, I.M. Rhyzik, Table of Integrals, Series, and Products, Vth edition, Academic Press, New York, 1994.
[15] H.S. Carslaw, J.C. Jaeger, Conduction of Heat in Solids, Clarendon Press, Oxford, 1959.