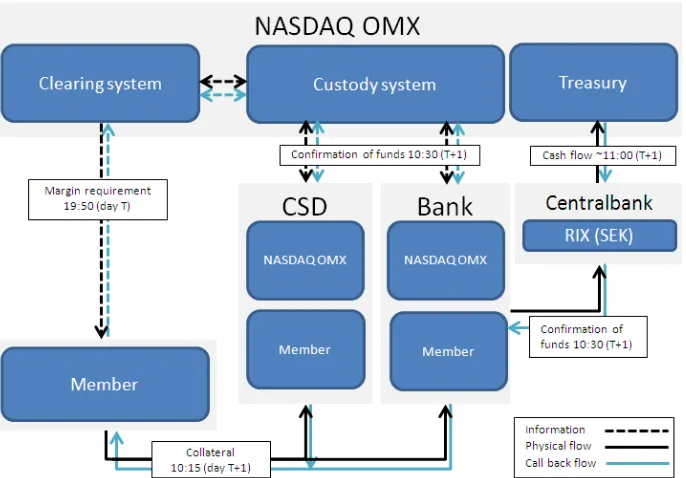
NASDAQ OMX OMS II Margin methodology guide for Equity and Index derivatives
Full text
Figure


Related documents
OEE is a formula that shows the overall performance of a single piece of equipment, or even an entire factory, and is governed by the cumulative effect of three factors:
the Rajya the grade/ the Secretariat Sabha cadre is held. Secretariat continuously in
Dále jsou analyzovány č eské nemovitostní fondy na základ ě realizovaného zisku, výnosové míry investice a podílového listu, ukazatele celkové nákladovosti, ukazatele
Each of the regressions controls for the Profiling Tie Group (PTG) of the recipients. Standard errors are given in parentheses and p-values from one-tailed tests are given
the paper by Gilboa and Schmeidler 1989, who provide the axiomatic foundations to analyze behavior under ambiguity, the distinction between risk and ambiguity has been
This gives us the possibility to observe the features selected by different feature selection approaches and to assess classification performance of different classification
According to that idea, this paper proposes a model for estimating VoIP quality provided by G.729, a common codec used over WAN, that has been created from subjective Mean
The observed difference compared with integrated buoyant jet models can be attributed to four possible effects: (i) entrainment of turbulent kinetic energy from the ambient