Fuel derived pollutants and boating activity patterns in the sea of galilee
Efrat Dinerman, Yael Dubowski, Eran Friedler
*Faculty of Civil and Environmental Engineering, TechnioneIsrael Institute of Technology, Haifa 32000, Israel
a r t i c l e i n f o
Article history:
Received 12 January 2011 Received in revised form 4 July 2011
Accepted 17 July 2011 Available online 6 August 2011
Keywords: MTBE BTEX Lake Kinneret Boating survey Watershed contribution
a b s t r a c t
MTBE (Methyl tert-Butyl Ether) is a fuel additive that replaced lead as an antiknock compound in internal combustion motors. Few years after its introduction, detectable levels of MTBE were found in various water bodies. MTBE has a very low taste and odor threshold and is a potential carcinogen. Another group of fuel derived toxic compounds that has been detected in water bodies is BTEX (Benzene, Toluene, Ethylbenzene and Xylene). Boating activity and allochthonous contributions from watersheds are the major sources of fuel derived pollutants in lakes. Their concentrations in lakes thus vary as a function of boating activity intensity, lake surface area and depth, weather and wind regime, land-use in the watershed, etc. The Sea of Galilee (Lake Kinneret) is the only recreational lake in Israel and an important freshwater source. In the current study, a sampling campaign was conducted in order to quantify MTBE and BTEX concentrations in Lake Kinneret, its marinas and its main contributing streams. In addition, a boating-use survey was performed in order to estimate MTBE and BTEX contribution of recreational boating. The sampling campaign revealed that, as expected, MTBE concentrations were higher than BTEX, and that near shore (i.e., marina) concentrations were higher than in-lake concentrations. Despite the clear contribution from boating, high MTBE concentrations were found following a major inflow event in winter, indicating the importance of the allochthonous contribution. The contribution from boating during summer, as measured indirectly by in-lake concentrations, is likely underestimated due to enhanced MTBE volatilization due to strong winds and high temperatures. MayeSeptember was found to be the main recreational boating season, with continued boating year round. On average, a single boat is active 23 d/y, with 84% of the watercrafts being active only during weekends and holidays. The survey further indicated that boats stay in the lake for 4.5 h on average, which conforms to the unique winds regime that limits afternoon activity due to high winds, and have an average fuel consumption of 14 L/h. The annual load of MTBE and BTEX from recreational boating in Lake Kinneret was estimated at 4430 and 6220 kg/y respectively.
Ó2011 Elsevier Ltd. All rights reserved.
1. Introduction
MTBE (Methyl tert-Butyl Ether) is a fuel additive that replaced lead as an“antiknock“compound for internal combustion motors. MTBE also enriches fuel mixtures with oxygen and thus reduces carbon monoxide (CO) emissions from motors. Today, MTBE is heavily used as a fuel additive (more than other potential additives) due to its high solubility in petrol, low volatility and relatively low cost. While replacement of lead by MTBE led to a significant reduction in environmental lead levels, a few years later, detectable levels of MTBE were found in various water bodies (groundwater as well as surface water).
MTBE is of concern to water suppliers since it is categorized as a potential carcinogen and has a very low taste and odor threshold
(5e15
m
g/L) (Froines et al., 1998; USEPA, 1996). Above this threshold MTBE adds a distinct turpentine taste to water, making it unpal-atable. Due to health concerns, The USEPA recommended that MTBE concentrations in water should not exceed 20e40m
g/L. The toxicity of the MTBE to aquatic organisms is considered low. However, it may have a negative synergetic effect with pesticides even at low concentrations (Hernando et al., 2003; Johanson et al.,1995; Nihlen et al., 1998). MTBE concentrations in gasoline vary
within region and in accordance with local regulations, type of fuel refinery plant, and type of gasoline. In Israel, unleaded petrol (95, 96, 98 octane) contains 15% MTBE, while regular 96 octane petrol (leaded) contains 10% MTBE (BAZAN, 2004).
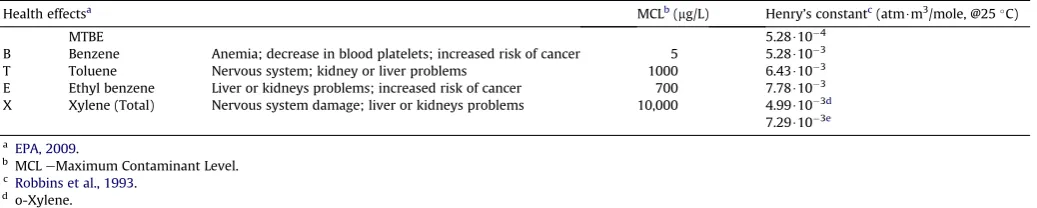
BTEX (Benzene, Toluene, Ethylbenzene and Xylene) is a group of compounds found in petroleum products, with typical proportional concentrations reaching as high as 18% in gasoline. The known health effects and Maximum Contaminant Level (MCL) allowed in drinking water for the BTEX compounds are described inTable 1. *Corresponding author. Tel.:þ972 4 8292633.
E-mail address:[email protected](E. Friedler).
Contents lists available atScienceDirect
Journal of Environmental Management
j o u r n a l h o m e p a g e : w w w . e l s e v i e r . c o m / l o c a t e / j e n v m a n
In multiple use lakes and reservoirs, recreational boating has proven to be a significant source of gasoline derived volatile organic carbons (VOCs), especially MTBE and BTEX (Dale et al., 2000; Gabele and Pyle, 2000; Reuter et al., 1998; U.S.Geological-Survey, 1998). Since MTBE is more soluble, less reactive, and less volatile than other gasoline derived pollutants (Table 1), it is the dominant gasoline derivative found in contaminated waters. MTBE and BTEX are emitted to the water with unburned fuel from marine engines. Two-stroke motors emit as much as 20% of fuel consumption into the water, while four-stroke motors emit about 0.2% (Gabele and
Pyle, 2000;Heald, 2003). Under certain circumstances urban and
road runoff can also be significant sources of MTBE in lakes (Reuter
et al., 1998).
Other sources of MTBE and BTEX could be atmospheric depo-sition especially in lakes and reservoirs located near large urban areas, while in lakes located in rural areas atmospheric deposition is negligible (Achten et al., 2002; Pankow et al., 1997)
Concentrations of fuel derivatives in lakes and reservoirs vary as a function of boating intensity, lake surface area and depth, temperature and wind regime, land-use in its watershed, etc. Most available data regarding the fate of fuel additives in lakes were obtained from North America and (to a lesser extent) from Europe. However, comparison between these lakes is difficult due to different climates, lake properties and boating activity. Not surprising, previous studies found higher concentrations near the shore at anchoring stations and during holidays when boating activity was at its peak (An et al., 2002; Schmidt et al., 2004;
U.S.Geological-Survey, 1998). The present study focuses on the
Sea of Galilee (Lake Kinneret, Israel), which is located in a semi-arid climate and exposed to a unique wind regime.
Lake Kinneret is a warm monomictic lake. It is thermally strat-ified from spring to late autumn (MarcheDecember) and mixed during winter. The surface area of the lake is about 170 km2,its average and maximum depths are about 24 and 42 m, respectively, and its volume ranges between 3.6109m3(lower operational volume) and 4.3109m3(upper operational volume). The lake is located in the northern part of the Jordan rift valley. Most of its watershed is located to its north, where it is drained primarily by the Jordan River, accounting forw70% of water inflows into Lake Kinneret. Additional inflows are the Meshushim stream (w 5%), Yarmuch stream (w4%) and other streams from the Golan Heights (w9% altogether). The natural outlet of the lake is the lower Jordan Riverflowing to the Dead Sea. However, since 1964 the main lake outflow is water pumped by the Israel National Water Carrier (w300106m3/y). The watershed of the lake is predominantly rural.
Lake Kinneret is a classical multiple use, meso-eutrophic lake
(Berman et al., 1995). Until recently it provided about 30% of Israel’s
drinking water and, being the only freshwater lake in the country, is also an important recreational andfishing center. From May to
October (summer), the lake is exposed to strong daily westerly winds having an average speed of 15 m/s at 10 m above the water surface (Antenucci and Imberger, 2003; Rimmer et al., 2006). The winds begin suddenly, usually around 12 to 2 pm.
The onset of lake stratification occurs in spring (usually March), and disappears in early winter (usually December) (Rimmer et al., 2006). During the stratification period, the lake is effectively divided into two water layers with limited water transfer between them. The upper layer, Epilimnion, is relatively warm (w 28C, 14e18 m thick) and rich in dissolved oxygen. The lower layer, Hypolimnion, is much colder (w 16C, 23e27 m thick) and has oxygen-poor conditions due to organic matter oxidation that depletes dissolved oxygen levels. The transition Thermocline layer (2e5 m thick) is characterized by steep temperature and dissolved oxygen gradients.
Despite the intensive recreational boating in Lake Kinneret and its importance as a national source of freshwater, there is no quantitative information that can establish relationships between motor boating activity and MTBE and BTEX concentrations in the lake. To date, no regular monitoring of MTBE and BTEX in the lake has been performed, and only few measurements from the water-shed are available. The current study aimed at supplying such information by conducting a sampling campaign in order to quantify MTBE and BTEX concentrations in the lake and in main boating marinas. Furthermore, a boating-use survey was conducted to evaluate the amount of MTBE and BTEX entering the waterbody from recreational boating. The obtained quantitative data can be used to support boating activity management and control in order to insure that water quality will not be compromised.
2. Methods
2.1. MTBE and BTEX monitoring
Samples were taken in different seasons, at the beginning and end of boating activity day and from different locations in the lake, as well as from the main rivers and streams discharging into the lake.
The monitoring campaign in Lake Kinneret was performed in two stages:
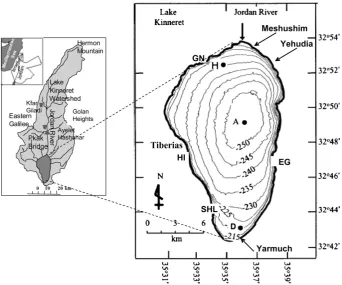
[image:2.595.47.566.85.189.2]1.A preliminary campaign was carried out on three separate occasions during summer-fall 2005. The goal of this campaign was to identify major contributors of the selected pollutants to the lake. Sampling in this campaign included all twelve active shore marinas and three sampling points in the open lake (stations A, D, and H;Fig. 1). Based on the results obtained in this preliminary stage, sampling points for the main campaign were chosen.
Table 1
MTBE and BTEX health effects, maximum contaminant level and Henry’s Law constants (EPA, 2009).
Health effectsa MCLb(mg/L) Henry’s constantc(atm$m3/mole, @25C)
MTBE 5.28$104
B Benzene Anemia; decrease in blood platelets; increased risk of cancer 5 5.28$103
T Toluene Nervous system; kidney or liver problems 1000 6.43$103
E Ethyl benzene Liver or kidneys problems; increased risk of cancer 700 7.78$103 X Xylene (Total) Nervous system damage; liver or kidneys problems 10,000 4.99$103d
7.29$103e
aEPA, 2009.
b MCLeMaximum Contaminant Level. c Robbins et al., 1993.
2.The main campaign was conducted from April 2006 to September 2007 and consisted of four sub-campaigns (one every season). On each sampling date, water samples were taken from multiple depths at the three stations in the open lake (see details below), four main marinas, and four main streams entering the lake. Samples were taken between 10 am and 1 pm, in the middle of boating activity time (which span-ned from approx. 7 ame5 pm). The streams were sampled near their entry into the lake. In total, 124 water samples were collected during the main campaign.
The three in-lake sites (Fig. 1) represented different lake sections; Station H is adjacent to the National Water Carrier intake area at the North West side of the lake (overall water column depth: 10e15 m), station A is situated at the lake center and is the deepest point of the lake (overall depth: 35e40 m), and station D is situated in the southern part of the lake (overall water column depth: 10e15 m). In order to better represent MTBE and BTEX concen-tration profiles in the lake, three water samples were taken at each sampling site from depths of 0.5, 5, and 10 m (Epilimnion layer during stratification period). In station A additional samples were taken from depths of 25 and 35 m, representing the Hypolimnion. A horizontal“Van Dorn”bottle was used for depth sampling. The sampler was lowered to the desired depth in its open position and there tripped closed with a“messenger”weight.
In-situ temperature profiles were measured in each station with an YSI-158 Temperature-Oxygen meter, and were verified by the continuous lake temperature data from Lake Diagnosis System, Lake Kinneret (LDSLK). The latter is located at a stationary point inside the lake (Station A) and provides real-time monitoring of water column temperature stratification and meteorological parameters.
In-lake sites were accessed with a diesel motor boat, because diesel is not expected to discharge MTBE or BTEX. In order to
further prevent contamination from the vessel, the motor was shut down at least 5 min prior to sampling, and samples were retrieved from the up-wind side of the boat. At the on-shore marinas, samples were taken from one-half meter below the water surface, near the launching ramps of the motor-boats and jet-skis.
In order to estimate the contribution of MTBE and BTEX from the watershed, their concentrations were measured in four major streams: Jordan River (the main water source to the lake), Meshushim, Yehudia and Yarmuch (Fig. 1), near the lake inlets. Further, the city of Tiberias has two main stormwater drains that discharge into the lake. These were also sampled during a single rain event.
2.2. Water sampling and analysis
Duplicate water samples were taken in 40 ml glass bottles equipped with Teflon-coated septum stoppers. Each bottle was pre-dosed with thio-sulfate or sodium-sulfite solution (100
m
l of 3% solution), which served as a reducing agent for samples containing chlorine. Sample bottles (completely full with no head space) were kept refrigerated until analysis. Chemical analysis of BTEX and MTBE were performed by MIGAL laboratory (Kiryat Shmona, Israel). The samples were analyzed by GCeMS using a purge and trap method (Method 542.2USEPA, 1995). Concentrations of BTEX presented in this paper are the sum of measured concentrations of its 4 components: Benzene, Toluene, Ethylnebzene and Xylene.2.3. Boating survey
[image:3.595.122.465.443.728.2]The survey was a structured interview-type survey. The objec-tives of the survey were: to quantify the number of motor boats and jet-skis active in the lake, to determine the seasonal and sub-weekly (weekdays vs. weekends) variability of boating activity in
the lake, to estimate the number of hours that a boat is activeper day, and based on the above, to estimate the hourly fuel consumption of recreational boats and the resultant MTBE and BTEX discharge into the water.
In order to interview as many boat owners as possible, the survey was conducted during two Israeli holidays (Rosh Hashana in Sept. 2006 and Shavuot in May 2007) in which boating activity was relatively high. Interviews with boat owners were conducted at the launching ramp at the four main marinas where two interviewers were placed (total of 8 interviewers). The survey started at around 7:00 am, just before the first boats were launched into the lake, and ended around 5:00 pm when most of the watercrafts were taken out of the lake.
Boat owners were asked tofill out two questionnaires:
1.Boat owners interview eThis was conducted in the morning before the first entry into the water, and included questions about technical parameters of the boat, character of activity, expected length of activity and the amount of fuelfilled on that specific day/amount of fuel in the fuel tank.
In order to evaluate the quantity and pattern of boating activity during the year, boat owners were further asked to answer the following multiple-choice questions, where they were instructed to choose the mostfitting answer:
Number of visitsperyear (six possible answers: 1e5, 6e10, 11e20, 20e30, 30e40 and above 40).
Preferable days for boating activity (three possible answers: weekdays, holidays and weekends, or all days are equal). Length of activity day (four possible answers: 1-2, 3e6, 7e8
and over 9 h a day).
Preferred month for water activity (boat owners were asked to classify every month from a scale of: "0"eno visits "1"efew visits and "2"emany visits).
Character of preferred boating activity (six possible answers: cruise, ski, troll, anchoring in the lake,fishing, or else). Night activity (whether or not their boats are active at night).
2.Details table- This questionnaire included technical information and wasfilled by the two interviewers in each marina at the end of activity day. Each row in this table referred to one boat or jet-ski leaving the marina (at the end of the day), and was used as one record in the database. Technical information included: amount of fuel in the fuel tank, engine-hour meter (if existed), boat type, engine type (2 or 4 stroke), boat registration number (in order to identify the craft in data processing) and time entering the water. In addition, the owners were asked about the actual number of activity hours and how long the boat was in open water with the engine turned-off. Due to boat owner subjectivity, this information was used for comparison only.
For analysis purposes, only one recordperboat was allowed on a given day. Length of activity for each boat was calculated by determining the difference between launching and recovery times as recorded by the interviewers. Mean hourly fuel consumption was calculated from the difference between the amount of fuel in the fuel tank in the beginning and the end of the day, and the length of stay in the lake.
The survey also included jet skis, whose owner’s were asked the same questionnaires as the boat owners. Interviewees were asked to mark "boat" or "jet-ski" on the personal interview page. Since jet skis are not allowed to sail at night in Lake Kinneret, the question regarding nightetime activity was not included in their interviews.
3. Results and discussion
3.1. Boating survey
In total, 198 questionnaires werefilled out during the two dates of surveying; 170 for recreational boats and 28 for Jet skies repre-senting 40% and 4% of the active boats and Jet skis in the lake, respectively (unpublished data from Lake Kinneret Administra-tion). Not all questionnaires were answered completely; hence different numbers of answers were available for data processing of each parameter.
3.1.1. Preferred month and number of days in a year for boats activity
Fig. 2A depicts the histogram distribution of the number of days
an average boat is active in the lake, as indicated by boats owners (n ¼ 117). Most categories present similar relative proportion (w15%), while the 11e20 d/y category has the highest proportion (w30%). The weighted mean of these categories is 23 d/y.
Analysis of boat owners’ preferences regarding season-dependent activity indicates (as expected) that summer months (May to Sept.) are most popular for recreational boating in the lake. June to August are especially popular, during which 95% of the interviewees said that they were boating in the lake. Still, 30e40% of the boats remain active during winter (Fig. 2B). This yearelong activity may differ from activity-patterns reported for other lakes, and stems from the relatively mild winter in Israel.
The results further show that most recreational boating takes place during weekends and holidays, with: 84% of boats active only during weekends and holidays, 15% active equally during weekdays and weekends and 1% active only during weekdays.
3.1.2. Length of typical activity day and hourly fuel consumption Most (85%) of the boats entering the lake remain there for three to 6 h (Fig. 3A). Hence, the obtained weighted average length of activity day was calculated to be 4.5 h. Thisfinding agrees well with the wind regime prevailing in the Lake Kinneret area. As mentioned
0% 5% 10% 15% 20% 25% 30% 35%
1-5 6-10 11-20 21-30 31-40 >40
Number of activity days per year
Proportion of active boats Proportion of active boats
A
20% 30% 40% 50% 60% 70% 80% 90% 100%
1 2 3 4 5 6 7 8 9 10 11 12
Month
Summer
[image:4.595.129.481.614.719.2]B
previously, during summer, strong Westerly winds become domi-nant from around noon until the evening, making recreational boating nearly impossible. Furthermore, most of the interviewees (80%) indicated that they do not sail at night, with only 20% of them boating at night for one to 3 h.
All boats to which engine type data was available (n¼81) were found to be four-stroke engines. The overall (all 81 boats) average fuel consumption was found to be 14 L/h (Fig. 3B). The boats were further sorted to three groups according to their engine power: 100e140 Hp, 150e215 Hp, and>220 Hp. The calculated average fuel consumption was 13 L/h for the“150e215 Hp”group (n¼29), and 20 L/h for the“>220 Hp”group (n¼39). A reliable hourly fuel consumption could not be determined for the“100e140 Hp”group due to limited data (n¼4). Nevertheless, boats from this group were considered when calculating overall average fuel consumption.
Although we did not receive reports of 2-stroke engine in our questioners, a boats counting campaign conducted by the Lake Kinneret Authority in 2007 indicated that significant portion of the watercraft active in the lake are 2-stroke boats (see details in equation (1)). Previous study regarding boats fuel consumption reports average fuel consumption of 10 L/h for two-stroke boats and jet-skis (Heald et al., 2005).
3.2. Fuel derivative loads from recreational boating
Based on survey results, average annual MTBE and BTEX loads to Lake Kinneret from boating activity can be estimated following equation(1)
M ¼ ðf$C$h$d$FÞ$
r
$Nb (1)Where: M e Pollutant input load (kg/y); f e Portion of fuel consumed by marine motors that is released to the water. 20% for two-stroke engines and 0.2% for four-stroke engines (Gabele and
Pyle, 2000; Heald, 2003); CeAverage hourly fuel consumption:
10 L/heboats or jet-skies with two-stroke engine (based onHeald
et al., 2005), 14 L/heboats with four-stroke engine (results of the
boating survey); heAverage length of daily activity. (4.5 h/d, see section3.1.2above), deAverage annual activity days of a single boat (23 d/y, see section 3.1.1 above), F e Pollutant volumetric proportion in fuel (15% for MTBE and 18% for BTEX,BAZAN, 2004),
r
ePollutant density (MTBE - 741 kg/m3, BTEXe868 kg/m3), Nbe Number of boats in the lake: 118 boats with two-stroke engines, 70 jet-skis with two-stroke engines, and 310 boats with four-stroke engines (Data from the Lake Kinnerets Authority based on boats census from 2007). It should be noted that jet-ski numbers are most likely underestimated because they are easily towed by vehicles and thus not necessary registered.Based on the above equation, the average annual load inputs of MTBE and BTEX from boating activity to Lake Kinneret was
estimated at 4430 and 6220 kg/y, respectively; with engine cate-gories having the following distribution:
MTBE e 100 kg/y from four-stroke engine boats, 2720 kg/y from two-stroke engine boats and 1610 kg/y from two-stroke engine jet-skis.
BTEXe140 kg/y from four-stroke engine boats, 3820 kg/y from two-stroke engine boats and 2260 kg/y from two-stroke engine jet-skis.
As previously reported, we see that 2-stroke engines are the major contributors of fuel derivatives to the lake.
Afirst approximation of the resulting MTBE and BTEX concen-trations in the Epilimnion during summer can be obtained under several assumptions: a) MTBE and BTEX are released only to the Epilimnion and are fully mixed there, b) the Epilimnion average volume (from May to October) is 2197 million m3(Rimmer et al., 2006), and c) d z 16.1 days/summer (since 70% of the boat activity in the lake occurs during summer, i.e., 230.7¼16.1). Based on these assumptions, Epilimnion concentrations of 1.4
m
g/L MTBE and 2.0m
g/L BTEX are expected as a result of boating activity during summer (equivalent to 3100 kg MTBE and 4350 kg BTEX). It is important to note that these values are upper limits as no loss processes (e.g. volatilization, degradation) were considered.3.3. MTBE and BTEX in marinas and in-lake stations
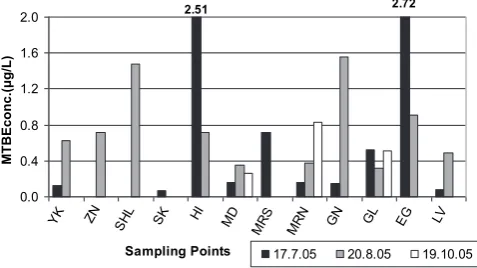
MTBE and BTEX concentrations were measured in all the marinas around the lake during the screening campaign. MTBE concentrations ranged from below detection limit to 2.72
m
g/L(Fig. 4). BTEX concentrations showed the same trend as MTBE but
with concentrations generally below 0.7
m
g/L (except at the 0%5% 10% 15% 20% 25% 30% 35%
6.9 13.9 20.9 27.9 34.9 More Fuel consumption (L/hr)
B
0% 20% 40% 60% 80% 100%
1-2 3-6 7-8 9 Length of activity (hr)
[image:5.595.118.471.67.169.2]Proportion of active boats Proportion of active boats
A
Fig. 3.Length of daily activity and fuel consumption of boats. A - Histogram distribution of the length of daily hours of activity (n¼122); B - Histogram distribution of hourly fuel consumption (n¼81).
0.0 0.4 0.8 1.2 1.6 2.0
K
Y ZN SHL SK I H D
M RS M
N R M
N
G GL EG LV
Sampling Points
MTBEconc.(µg/L)
17.7.05 20.8.05 19.10.05
2.51 2.72
[image:5.595.307.546.559.693.2]Holiday-Inn and Ein-Gev marinas where maximum BTEX concen-trations reached as high as 2.61 and 1.74
m
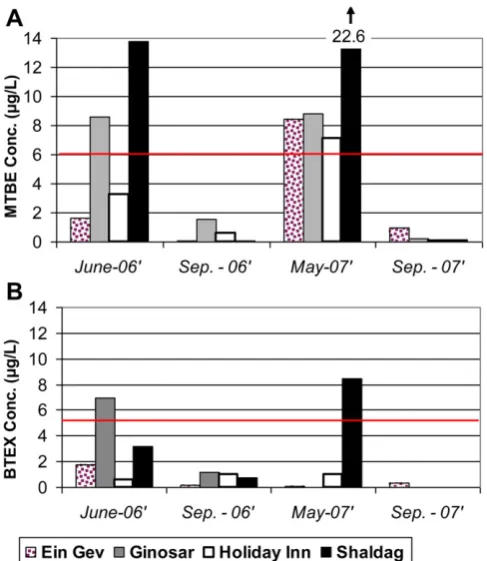
g/L, respectively). The results of the preliminary campaign (conducted during July, August and October 2005) indicate that concentrations of MTBE and BTEX in the marinas are higher during summer, coinciding with the high season for lake boating activity (as indicated by the boating survey). Following the preliminary campaign, a more detailed campaign (referred to as the main campaign from hereafter) was performed. The main campaign focused sampling at four main marinas (Ein Gev, Ginosar, Holiday Inn, and Shaldag) that showed higher fuel additives concentrations (as shown inFig. 4), and boating activity (data from Lake Kinneret Administration).Fig. 5 (AeB) presents concentrations of MTBE and BTEX as
detected in the selected marinas during the main campaign (2006-7), sorted by sampling date. The high values observed in June (2006) and May (2007) coincide with the boating season (Fig. 2B). Furthermore, both samplings dates fell on the Jewish holiday of Shavuot, with high boating activity recorded. Not surprising, samples collected in September 2006 during the Jewish holiday Rosh Hashanah had higher concentrations than those collected in September 2007 (not on the holiday). Nevertheless, levels in samples collected during Shavuot were higher than those in September, in agreement with higher boating activity recorded.
In May 2007, the marinas were sampled twice - in the morning (before the massive boating activity started) and in the evening after an entire day of activity. The sharp increase in MTBE and BTEX concentrations at the end of activity day (Fig. 6), strongly suggests that recreational boating is a major donor of these pollutants into the marinas’vicinity. As observed in the preliminary campaign, evening sample BTEX levels were much lower than MTBE levels
most likely due to their higher volatility, and enhanced evaporation during the day.
For samples taken on the same day, MTBE and BTEX concen-trations in the marinas were generally higher than in-lake samples (i.e., stations A, D, and H). A similar trend was observed in Lake Tahoe (U.S.Geological-Survey, 1998) and in Lake Zurich (Schmidt
et al., 2004), where concentrations of MTBE were about 2e7
times higher near shore than in open lake sites.
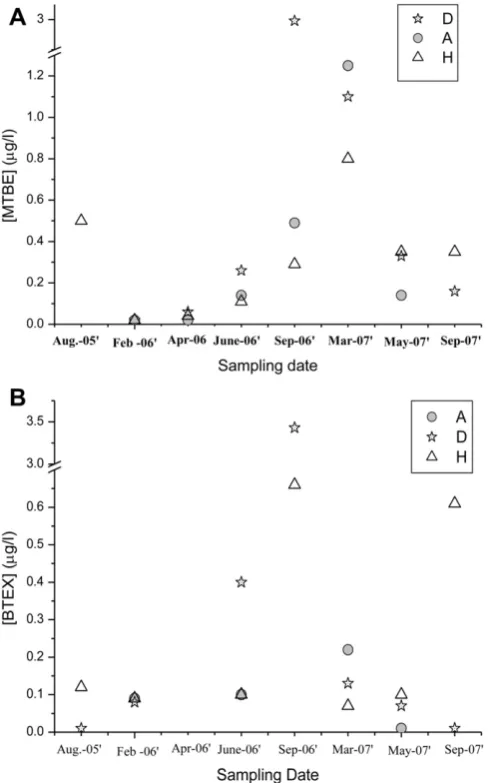
Preliminary survey data from in-lake points showed higher concentrations in August 2005 than in July 2005, suggesting a possible cumulative effect on the concentration of fuel derivatives as a result of motor boat activity during summer months. In support of this, a similar trend was observed during the main campaign. In winter 2006, MTBE concentrations were very low (0.01e0.04
m
g/L) most likely representative of background concentrations. Together with enhanced recreational boating activity during summer (May to September 2006), an increase in MTBE concentrations was observed, reaching levels up to 0.5m
g/L (Fig. 7). Extremely high concentrations of MTBE and BTEX were measured in station D in September 2006, probably pointing at a random local plume. This is not too surprising considering that station D is located in a shallow part of the lake near several marinas, and hence is more likely to be impacted by sporadic boating activity.On the other hand, surprisingly high levels of MTBE were observed in all open lake sites in March 2007 when very limited boating activity occurred (i.e., winter). Performing similar calcula-tions as those for summer months (equation (1), section 3.2), winter fuel derivative loads could be estimated. Since 30% of the boats are active in winter, using a d ¼6.9 d/winter (i.e., 23 d/ yr0.3¼6.9) yielded loads of 1330 and 1870 kg MTBE and BTEX, respectively. Since the lake is fully mixed during winter, the loads can be divided by the average winter lake volume (3284 million m3), which yields concentrations of 0.40 and 0.57
m
g/L for MTBE and BTEX, respectively. These calculated concentrations, which are winter upper limits as explained in section 3.2 (nevertheless, if mixing is not fully complete and some preferential transport occurs even in wintertime, in some localities concentrations could be higher than this estimated maximum.), clearly show that boating activity alone cannot explain the high concentrations observed in March 2007. [image:6.595.317.560.70.180.2]Examination of water inflows from the Jordan River, the major contributor of water to the lake, provided insight into additional MTBE and BTEX sources (Fig. 10). In March 2007, samples were taken one week after an intensive lake inflow event following a heavy rain episode. The high flow rates and turbidity levels measured in the Jordan River during this discharge event, and the relatively high MTBE levels that were measured in the streams of Fig. 5.MTBE (A) and BTEX (B) concentrations (at 0.5 m below surface) in selected
marinas during the boating seasons of 2006-2007. The horizontal red line presents the minimum organoleptic detection limit of MTBE and the MCL (Maximum Contaminant Level) of Benzene (5mg/L ).Missing data represent concentrations below detection limit. (For interpretation of the references to colour in thisfigure legend, the reader is referred to the web version of this article).
0 2 4 6 8 10
Morning Evening Morning Evening Morning Evening Morning Evening
Ein gev Ginosar Holiday Inn Shaldag
M ain marinas
MTBECocnc. (µg/L)
MTBE BTEX
22.63
[image:6.595.46.290.400.681.2]the catchment basin (see discussion later), suggest that the high MTBE concentrations measured in all in-lake stations in March 2007 represent significant basin contribution. Further support for a significant allochthonous MTBE contribution was provided by the fact that this sharp increase in MTBE level was not accompanied by a clear increase in BTEX concentrations. This is in agreement with the higher vapor pressure of BTEX (and Henry’s Law constants,
Table 1), which results in significant volatilization in the watershed
prior to reaching the in-lake stations.
Vertical profiles of MTBE and BTEX concentrations are also affected by the water column mixing in the Lake. In April 2006, the lake was almost fully mixed (Fig. 8) and consequently similar MTBE concentrations at different depths were observed (Fig. 9A). On the other hand, in June, when the lake was well stratifiedFig. 8and recreational activity was high, MTBE concentrations show a distinct vertical profile (Fig. 9B); with lowest levels near the water surface, increasing toward depths of 5e10 m, followed by a relatively constant concentration at the Hypolimnion (25 m and deeper).
BTEX concentrations (Fig. 9C) showed a similar trend but with much smaller vertical and spatial variability (except of high concentrations measured at 5 m depth, which probably represent a local plume as mentioned above). No BTEX was detected near the surface, in agreement with its high volatility. During April and June, increased lake loading of MTBE and BTEX was observed. Since watershed inflows were relatively low at the beginning of June (close to sampling date,Fig. 10), the source of these pollutants is most likely autochthonic (i.e., boating activity).
[image:7.595.37.283.65.457.2]Unlike the common lake pattern where strong winds prevail during winter, in Lake Kinneret, strong afternoon winds are typical
Fig. 7. MTBE (A) and BTEX (B) concentrations at the in-lake sampling stations (A, D, H). Each point is an average concentration of samples at depths 0.5 and 5 m.Missing data represent concentrations below detection limit.
0
5
10
15
20
25
30
35
40
10 15 20 25 30 Temp (oC)
Depth (m)
April 06'
June 06' sep. 06'
[image:7.595.306.548.288.704.2]March 07' May 07'
[image:7.595.38.279.618.726.2]Fig. 8.Lake Kinneret Temperature profiles during sampling days.
during summer time. The combination of strong summer winds (speed of 7e9 m/s) and very high surface water temperature (average around 29-30C), result in high volatilization. In summer, the observed decrease in surface MTBE concentrations relative to that of deeper water suggests that volatilization plays a significant role for the semi-volatile MTBE. If so, the expected increase in MTBE due to enhanced boating activity during summer is partially masked by enhanced volatilization. Indeed, observed concentra-tions were approximately one-third of the calculated "upper limit" concentrations (section3.2).
[image:8.595.47.285.67.248.2]3.4. MTBE and BTEX in river and streams
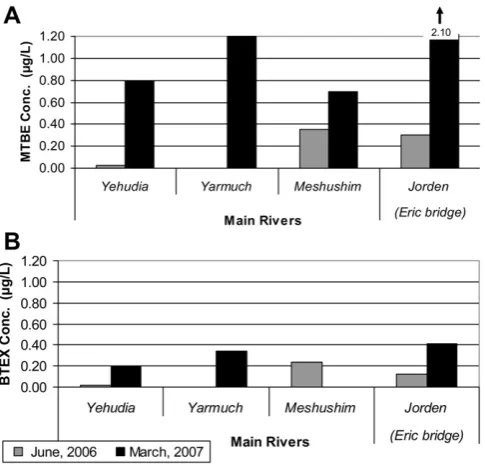
Fig. 11shows concentrations of MTBE and BTEX measured on
June 2006 and March 2007 in the River Jordan (at Eric Bridge),
Yehudia stream and Meshushim stream. As in Lake Kinneret, basin concentrations of MTBE were higher than BTEX, and both MTBE and BTEX levels in all the streams were much higher during the intensiveflows of March 2007, suggesting that contaminated soils in the basin (that are washed only after significant rains) currently act as a source for these pollutants. MTBE and BTEX levels in streams in April 2006, September 2006, May 2007, and September 2007 were below the limit of detection.
As mentioned previously, the Jordan River is the main water source of Lake Kinneret. MTBE and BTEX in the Jordan River were monitored during 2001-2 by the Israel Water Authority (at the "Pkak" bridge, locatedw13 km upstream from its inlet to the lake). The concentrations of MTBE measured in the river in 2001-2 were significantly higher (5e30
m
g/L) than the concentrations measured in the river during the present study (up tow2m
g/L). Even though the current sampling point was located much closer to the river’s inlet to the lake (at Eric Bridge located only 2 km upstream from its discharge point), this can not explain such a large difference in MTBE levels, especially since no significant waterflows enter the river between these two sampling points. It is much more likely that the observed reduction in MTBE levels in the Jordan River during this period is due to source control efforts in the years 2003e2005 that aimed at minimizing gasoline leaks from petrol stations in the basin.3.5. Urban runoff
During two rain events (20.11.05, 11.1.06), water samples were taken from the two main storm drainage outfalls of the city of Tiberias (Fig. 1), located in the Northern and Southern marinas of the town. The average MTBE concentration in these two events was 0.54
m
g/L (range 0.36e0.74m
g/L), while the average BTEX concen-tration was 0.32m
g/L (range 0.06e0.78m
g/L). The concentrations found in this urban runoff water were within the range of those measured in watershed streams. However, since the current data describe only two rain events, it is impossible to estimate the general MTBE and BTEX contribution of urban stormwater from Tiberias to Lake Kinneret.4. Conclusions
Concentrations of two fuel derivatives, MTBE and BTEX, were measured in Lake Kinneret, in its marinas and in its watershed. From the in-lake sampling campaign, two main trends were found: MTBE concentrations were higher than BTEX and in-lake concen-trations were lower than near shore. Additionally, as a result of local plumes, high concentrations were occasionally spotted in the open lake and in the marinas.
In-lake MTBE concentrations were affected by both recreational activity during boating season as well as allochthonous contribu-tions during high winter inflow events (e.g., March 2007). The latter is most likely associated with rinsing and erosion of contaminated soils. BTEX concentrations, on the other hand, are mostly affected by in-lake recreational activity. This is most likely the result of its higher vapor pressure, which leads to significant volatilization of BTEX from the watershed streams prior to reaching the in-lake stations.
Strong winds and very high temperatures in the Lake Kinneret area during summer time seem to significantly increase MTBE volatilization and reduce its concentration in the upper water layer. Considering that this is peak boating season, it is very likely that the observed increase in MTBE levels was underestimated due to volatilization. These unique meteorological conditions dominant in Lake Kinneret can explain why it does not show the typical pattern of much higher concentrations at the end of the boating season due 15/12/2005 15/03/2006 13/06/2006 11/09/2006 10/12/2006 10/03/2007 08/06/2007 06/09/2007
0 1 2 3 4 5 6
6/9 23/5
15/2 10/4 2/6 26/9 7/3
0
1(
w
olf
n
a
dr
o
J
6m 3d 1-)
Date
[image:8.595.48.291.469.703.2]Fig. 10.Jordan River inflows into Lake Kineret (2006-7). Solid squares represent dates of water sampling, continuous line representsflow data.
to accumulation of MTBE (and BTEX), as previously reported for other lakes.
A survey of boat and jet-ski activity was performed and revealed that May to September are the main months for recreational boating activity in the lake, with boating activity decreasing, but not ceasing, during winter. On average, each boat is active 23 days a year, and a large majority of the watercrafts are active only during weekends and holidays. The survey also indicated that boats stay on the lake for 4.5 h on average and have an average hourly fuel consumption of 14 L/h. Based on the obtained information regarding boating activity and the number of registered boats (Israel Water Authority data), an annual average load of MTBE and BTEX from recreational boating was calculated to be 4430 and 6220 kg, respectively. Based on these loads, afirst approximation of MTBE and BTEX concentrations in the Epilimnion during summer were calculated assuming a summer Epilimnion volume of 2197 million m3. Predicted concentrations of MTBE and BTEX were 1.4 and 2.0
m
g/L, respectively. These are "upper limit" values, since loss processes (e.g. volatilization, degradation) were not consid-ered. The concentrations measured in the lake during summer were up to 30% of the calculated value for MTBE and up to 10% for BTEX.These calculations further suggest that summer boating activity is a major contributor to the observed MTBE and BTEX levels in the lake during that period. Furthermore, boating data suggests that almost 98% of the MTBE and BTEX loads were from two-stroke engines. The results indicate that banning two-stroke engine activity is the most efficient management tool for controlling MTBE and BTEX concentrations in Lake Kinneret. Following the outcome of this study, Israel Water Authority and Israel Ministry of Envi-ronment are considering banning all two-stroke engine watercrafts from entering the lake.
Acknowledgement
The research was supported by the Israel Water Authority and by the Grand Water Research Institute, Technion. The authors further wish to thank Dr. D. Markel from Israel Water Authority and Mr. Y. Nitzani from the Lake Kinneret Authority for their invaluable support.
References
Achten, C., Kolb, A., Puttmann, W., 2002. Methyl tert-butyl Ether (MTBE) in river and wastewater in Germany. Environmental Science and Technology 36, 3652e3661.
An, Y.-J., Kampbellb Donald, H., Sewellb Guy, W., 2002. Water quality atfive marinas in Lake Texoma as related to methyl tert-butyl ether (MTBE). Environmental Pollution 118, 331e336.
Antenucci, J.P., Imberger, J., 2003. The seasonal evolution of wind/internal wave resonance in Lake Kinneret. Limnology and Oceanography 48, 2055e2061. BAZAN, 2004. Products datasheet: unleaded petrol 95 octane, unleaded petrol 96
octane, unleaded petrol 98 octaneesuper, regular petrol 96 octane. Israel Oil Refineries.
Berman, T., Stone, L., Yacobi, Y.Z., Kaplan, B., Schlichter, M., Nishri, A., Pollingher, U., 1995. Primary production and phytoplankton in Lake Kinneret: a long-term record (1972e1993). Limnology and Oceanography 40, 1064e1076.
Dale, M.S., Koch, B., Losee, R.F., Crofts, E.W., Davis, M.K., 2000. MTBE in southern California water. AWWA 92, 42e51.
EPA, 2009. National primary drinking water regulations. http://www.epa.gov/ safewater/contaminants/index.html#1(Ed. EPA 816-F-09-004).
Froines, J.R., Collins, M., Fanning, E., McConnell, R., Robbins, W., Silver, K., 1998. An evaluation of the scientific peer-reviewed research and literature on the human health effects of MTBE, its metabolites, combustion products and substitute compound. In: Health & Environmental Assessment of MTBE. Human Health Effects, vol. II. University of California Toxic Substances Research & Teaching Program, Davis, CA Report to the Governor and Legislature of the State of California as Sponsored by SB 521.
Gabele, P.A., Pyle, S.M., 2000. Emission from two outboard engines operating on reformulated gasoline containing MTBE. Environmental Science and Tech-nology 34, 368e372.
Heald, P.C., 2003. Modelling MTBE and BTEX in lakes and reservoirs used for recreational boating. MSc Thesis, University of California, Davis. 101 pp. Heald, P.C., Allen, B.C., Reuter, J.E., Schladow, S.G., 2005. VOC loading from marine
engines to a multiple-use lake. Lake and Reservoir Management 21, 30e38. Hernando, M.D., Ejerhoon, M., Fernandez-Alba, A.R., Chisti, Y., 2003. Combined
toxicity effect of MTBE and pesticides measured with Vibriofischeri and Daphnia magna bioassays. Water Research 37, 4091e4098.
Johanson, G., Nihlen, A., Lof, A., 1995. Toxic kinetics and acute effects of MTBE and ETBE in male volunteers. Toxicology Letters 82/83, 713e718.
Nihlen, A., Walinder, R., Lof, A., Johanson, G., 1998. Experimental exposure to Methyl tert-Butyl EthereII. Acute effects in humans. Toxicology and Applied Phar-macology 148, 274e280.
Pankow, J.F., Thomson, N.R., Johnson, R.L., Baehr, A.L., Zogoraski, J.S., 1997. The urban atmosphere as as a non-point source for the transport of MTBE and other volatile organic compounds (VOCs) to shallow groundwater. Environmental Science and Technology 31, 2821e2828.
Reuter, J.E., Pankow, J.F., Allen, B.C., Richards, R.C., Goldman, C.R., Scholl, R.L., Seyfried, J.S., 1998. Concentrations, sources, and fate of the gasoline oxygenate methyl tert-butyl ether (MTBE) in a multiple-use lake. Environmental Science and Technology 32, 3666e3672.
Rimmer, A., Eckert, W., Nishri, A., Agnon, Y., 2006. Evaluating hypolimnetic diffusion parameters in thermally stratified lakes. Limnology and Oceanography 51, 1906e1914.
Robbins, G.A., Wang, Suya, Stuart, James D., 1993. Using the static headspace method to determine Henry’s Law constants. Analytical Chemistry 65, 3113e3118.
Schmidt, T.C., Haderleina Stefan, B., Rolf, Pfisterb, Richard, Forster, 2004. Occurrence and fate modeling of MTBE and BTEX compounds in a Swiss Lake used as drinking water supply. Water Research 36, 1520e1529.
U.S.Geological-Survey, 1998. Volatile Organic Compounds in Lake Tahoe, Nevada and California, July-September 1997 USGS Fact Sheet FS-055e98.
USEPA, 1995. Method 542.2 measurement of purgable organic compounds in water by capillary column gas chromatography / mass spectrometry Revision 4.1. USEPA, 1996. Proposed guidelines for carcinogen risk assessment. Federal Register