U
NIVERSITY OF
C
OLORADO
B
OULDER
B
ACHELOR THESISBig Data Analytics on
Container-Orchestrated Systems
Author:
Gerard Casas Saez
Supervisor: Kenneth M. Anderson
A thesis submitted in fulfillment of the requirements for Bachelor’s degree in Informatics Engineering
in
Facultat d’Informàtica de Barcelona Universitat Politècnica de Catalunya
iii
University of Colorado Boulder
Abstract
Big Data Analytics on Container-Orchestrated Systems by Gerard Casas Saez
Container-orchestration systems offer new possibilites to software architects seeking to make their software systems more scalable and reliable. In the past, these systems have been used to implement transactional software systems but, more recently, they have been applied to other areas including big data analytics. To understand the ad-vantages and limitations such systems impose on software architects, I migrated an existing big data analytics infrastructure from a software architecture that required lots of work from its developers to deploy and maintain to the new software architec-ture provided by container-orchestration systems. My results show that scalability is increased, maintenance costs are reduced, and reliability is easier to achieve.
v
Acknowledgements
I would first like to thank my thesis advisor, Prof. Kenneth M. Anderson. Thanks to his support I had the opportunity to come to Boulder and work on this thesis. This thesis work would not have been completed without his support and patience. Also, I would like to thank all the Project EPIC members I worked with—Mazin Hakeem, Reem Albaghli, Jennings Anderson, Afnan Meshal and Rsha Mirza—for welcoming me in the group and supporting me through my thesis. I would like to thank the directors of Project EPIC, Prof. Leysia Palen and Prof. Kenneth M. Anderson, who have provided me with this amazing opportunity to conduct my research in their group.
I would like to thank my family for their support and encouragement on moving to the United States to work on this thesis. My college friends back in Barcelona for sharing with me probably the best four years of my life. And to my friends here in Boulder, for helping me integrate into this new environment and supporting me through this last six months.
vii
Contents
Abstract iii Acknowledgements v 1 Introduction 1 2 Background 3 2.1 Project EPIC . . . 3 2.2 Containerization . . . 42.3 Container Orchestration Technologies . . . 4
2.4 Microservices Architecture . . . 5
2.4.1 Coreography . . . 6
2.4.2 Orchestration . . . 6
2.5 Messaging systems . . . 6
2.6 Big Data Storage Systems . . . 7
3 Problem Statement 9 4 Approach 11 4.1 Custom Components . . . 12
5 Implementation 15 5.1 Deploying the System . . . 16
5.2 Front-End Components . . . 16 6 Evaluation 19 6.1 Reliability . . . 19 6.1.1 Current infrastructure . . . 19 6.1.2 System Prototype . . . 20 6.2 Scalability . . . 21 6.2.1 Current infrastructure . . . 22 6.2.2 System Prototype . . . 22 6.3 Performance . . . 23
6.4 Software development and maintenance . . . 25
6.4.1 Current infrastructure . . . 25 6.4.2 System Prototype . . . 25 7 Results 27 8 Related Work 29 9 Future Work 31 10 Conclusions 33
viii
A Microservices code 35
A.1 Twitter Tracker . . . 35
A.1.1 twitter_tracker.go . . . 35
A.2 Twitter Normalizer . . . 38
A.2.1 model.py . . . 38
A.2.2 tweetparser.py . . . 41
A.3 Infrastructure Controller . . . 43
A.3.1 start.py . . . 43
A.3.2 k8scontroller.py . . . 45
B Deploying microservices in Kubernetes 47 B.1 Docker image . . . 47
ix
List of Figures
2.1 Project EPIC Software Infrastructure . . . 4
4.1 System architecture . . . 13
5.1 Event Manager UI . . . 17
5.2 Zeppelin visualization example . . . 18
6.1 Kubernets restarts in eleven days . . . 21
xi
Listings
2.1 Tweets CQL table script . . . 8 6.1 WordCount Spark script . . . 23 6.2 Debug string rdd . . . 24
xiii
To my family,
my parents, my brother, my uncles, my grandfather
who supported and encouraged me at all times on this
1
1 Introduction
Big Data Analytics is a research area undergoing intense interest and rapid devel-opment. Data is being generated by sensors and computing systems at an ever in-creasing rate. Indeed, it is estimated that every month, seventy-two petabytes of information are moved around the Internet [5]. This amount is expected to grow to 232 petabytes/month by 2021 [5]. This rapid growth is a significant challenge to the designers of software systems and to the field of computer science in general. New software infrastructure will need to be designed to support this demand and to extract useful information from it. In addition, a wide range of techniques and technologies must be mastered to keep analysis time low at this scale.
One technique that can be useful in addressing these challenges iscontainerization; indeed, tools and technologies that provide containerization services are seeing in-creased interest and development. The ability to run software in separate environ-ments has been a revolution for the tech industry. Containerization provides a layer of abstraction for a set of services that allow software engineers to avoid long instal-lation processes on each machine a software development team needs to run their software. Containerization is similar tovirtualization but optimized to use system resources instead of simulated resources. Put another way, avirtual machine image contains everything needed to simulate a separate operating system. If you have multiple copies of that image, each image contains a complete copy of the operat-ing system and all other components needed to run your software, wastoperat-ing valuable disk space and consuming extra memory at run-time. With containerization, each container image contains just the software that you want to deploy and its required packages and the containerization run-time system provides a unified operating sys-tem for running all containers. Thanks to companies like Docker, containers are be-coming a de facto standard for software development and deployment.1 The ease of use and consistent behaviour between machines provided by containerization makes it an attractive option for developers.
However, this approach brings with it a few complexities: network configuration, interaction between containers, system updates, and more. To solve these complexi-ties,container-orchestrationsystems were developed. These systems provide another abstraction layer on top of containers, taking over the management of an underly-ing containerization technology. In particular, the container-orchestration system is in charge of coordinating containers, creating them, destroying them, etc. The entire container life cycle is controlled by the orchestration system.
As these orchestration systems become more popular, software architects must cre-ate new software architectures that embrace the possibilities that these systems pro-vide. Some features that previously were difficult to achieve are now available to any software architect. Applications no longer need to have a static infrastructure: container-orchestrated systems can grow and decrease system resources on demand.
2 Chapter 1. Introduction
Systems can be split into small microservices and deployed across a cluster of ma-chines; there is no need to merge components into a big monolithic application. Furthermore, cloud providers are adding support for container-orchestrated sys-tems, making it straightforward to deploy complex infrastructures. Due to the sim-ilarities between different cloud offerings, one can design this new style of software system independent of a specific provider. One benefit to container-orchestrated systems is that it provides a means for finding new ways to solve problems associ-ated with making use of parallelism and scaling a software system to handle ever increasing amounts of data. If properly designed, surges in demand can be met by spinning up additional copies of core system services balanced across the cluster of machines reserved from a cloud provider.
The goal of my thesis is to explore how this new style of software architecture can be used to deploy software infrastructures that are used to performbig data analytics. As part of my thesis work, I migrate an existing big data infrastructure to make use of the techniques and technologies offered by container-orchestrated systems and compare the new version of the system with its previous incarnation along a number of dimensions.
3
2 Background
Before digging into my specific project, I provide background information that will help to understand my problem domain. Here, I present information on three dif-ferent topics: the first provides information on the big data software infrastructure that I use in my work; this infrastructure was developed by Project EPIC [2,16,3] to support research into an area known ascrisis informatics[15,17]. I also present more information on container-orchestration technologies and then discuss microservice architectures in more depth.
2.1
Project EPIC
Project EPIC (Empowering the Public with Information in Crisis) is a project at the University of Colorado Boulder. It conducts research on crisis informatics, an area of study that examines how members of the public make use of social media during times of mass emergency to make sense of a crisis event as well as to coordinate/-collaborate around the event.
Project EPIC has a long history of performing software engineering research. Since 2009, Project EPIC has been investigating the software architectures, tools, and tech-niques needed to produce reliable and scalabledata-intensive software systems, an area known asbig data software engineering [1]. When large amounts of data are being collected, software engineers need to focus on structuring this data so it is easy to perform analysis and they must work to ensure that this data is easily accessible to analysts. Project EPIC’s big data software engineering research has explored these issues in depth during the creation of the Project EPIC software infrastructure that consists of two major components: EPIC Collect and EPIC Analyze.
EPIC Collect is a 24/7 data collection system that connects to the Twitter Streaming API to collect tweets from various crisis events that need to be monitored in real time. Since 2012, this software has been collecting tweets with an uptime of 99% and has collected over two billion tweets across hundreds of crisis events. EPIC Collect’s storage layer makes use of Cassandra. This NoSQL database is focused on writes and provides high throughput. EPIC Analyze is a web-based system that makes use of a variety of software frameworks (e.g., Hadoop, Solr, and Redis) to provide various analysis and annotation services for analysts on the large data sets being collected by EPIC Collect. In addition, Project EPIC maintains one machine—known as EPIC Analytics—with a large amount of physical memory to allow analysts to run memory-intensive processes over the collected data.
The software architecture of EPIC Collect and EPIC Analyze is shown in Figure 2.1. Note, this is a logical architecture that does not show how these systems are de-ployed. For instance, Cassandra is deployed on four machines that run separately from the machines that host the EPIC Collect software, Postgres, Redis, and the
4 Chapter 2. Background
DataStax Enterprise
EPIC Event Editor EPIC Analyze Application Layer Service Layer Storage Layer Twitter Redis PostgreSQL Cassandra Solr Pig Hadoop EPIC Collect
FIGURE2.1: Project EPIC Software Infrastructure
Ruby-on-Rails code that makes up EPIC Analyze. In all, the existing Project EPIC in-frastructure is distributed across seven machines in a single data center maintained at the University of Colorado Boulder.
2.2
Containerization
Containerization is a technique that provides operating-system-level virtualization. This technology allows programs to be run inside asystem container; these containers are isolated from each other as well as from the host machine that is being used to execute them. Containerization works like traditional virtual machines from the point of view of a program, but makes more efficient use of the system resources on the host machine instead of simulating a full-powered operating system.
There are many containerization platforms available; however, the most widely adop-ted project is Docker; I will make use of Docker as part of the prototype I built for testing my thesis work. Docker originated as an internal tool for a PaaS (Platform as a Service) company and was later made available as open source. Thanks to many contributions from different companies, this project has grown to become the most used containerization software. It is able to run on almost any machine and many software packages have been made available as Docker containers, providing a wide range of integration opportunities. Finally, almost all existing container orchestra-tion systems support Docker containers.
2.3
Container Orchestration Technologies
As containerization technologies became more widely adopted—spurred by a re-cent migration to designing systems via microservices—large companies needed a way to manage their containers in a more friendly way. Interconnecting containers, managing their deployment, and scaling them to meet demand, were all possible, but were difficult to achieve. As a result, container orchestration systems were born.
2.4. Microservices Architecture 5
To manage containers, these systems add an abstraction layer over containerisation technologies, making such tasks easier to perform.
There are a few container orchestration systems available at the moment. The most popular ones are Kubernetes and Apache Mesos.1 In this project, I will make use of Kubernetes. The main reason for this is that—thanks to the open source community— it is easier to find tutorials and courses for Kubernetes. In addition, there are a lot of big companies backing this project and contributing to it; this activity provides evidence that this project will be supported well into the future.
Google Cloud seems like the best fit to host Kubernetes as it has a managed cluster option that makes it straightforward to install and connect system components. In addition, thanks to Google being part of the maintenance team for Kubernetes, there is a great support for the Google Cloud infrastructure within Kubernetes.
2.4
Microservices Architecture
Microservices is an approach to distributed systems that promote the use of small services with specific responsibilities that collaborate between them, rather than making use of big components with a lot of responsibilities that make interaction more difficult. They are thus more cohesive units of software with minimal depen-dencies between them. A system designed with loosely-coupled, highly-cohesive software components has always been a highly-desirable goal in software design [4] and microservices help to achieve that goal with distributed software systems. In addition, thanks to new technologies like containers and container-orchestrated systems, microservices are quickly becoming a standard tool in the design of large software systems. This type of software architecture has been adopted by many companies as it makes maintenance of these systems more straightforward.
Another key advantage of the microservices approach is that it makes it easier to adopt different technologies for each component of your software system. In ad-dition to containerization, it decouples different parts of a system. This separation allows for a better optimization of technology depending on the feature that each mi-croservice needs to provide. For example, a mimi-croservice that needs to store highly-related data can make use of a graph database. At the same time, a separate mi-croservice that needs to store and index large documents can use a document store underneath, allowing for a better fit with its needs while allowing both microser-vices to be deployed as part of a single software system.
Having small microservices do specific tasks makes development cycles faster and more independent. It also makes incremental deployment much easier and less dan-gerous. Finally, microservices make it easier to scale software systems since one can individually scale parts of the system depending on their usage [6].
Microservices avoid problems associated with previous approaches to service-oriented architectures by focusing solely on the overall software architecture and letting the architect decide how services are to be deployed or what messaging system is used to communicate between them. In addition, a microservices architecture provides improved reliability and resilience, as each microservice is independent. If one fails, the rest are unaffected. This feature is a perfect match with container-orchestration
6 Chapter 2. Background
systems that can easily perform health checks on microservices and redeploy any that have failed.
In terms of designing a microservice architecture, there are two approaches that are equally used at the moment:choreographyandorchestration[14].
2.4.1 Coreography
Choreography centers all interactions around a publish-subscribe communication model. Events are propagated through the system in an asynchronous manner. When something happens in a microservice, a message gets published on a pub-lic queue. Other microservices can subscribe to this queue and respond when they receive that message.
This approach makes a system more flexible, removing the responsibility of know-ing how to send messages to other microservices. One can add more components easily without having to modify existing ones. However, we need extra components to make sure that all tasks are performed once an event is published. We can accom-plish this by installing and maintaining a monitoring solution.
2.4.2 Orchestration
Orchestration imposes request/response interactions on microservices. Each mi-croservice makes requests directly on other mimi-croservices. For this approach to work, one needs a service discovery mechanism. In addition, if a service is down, we need to make sure that microservices are architected to retry failed attempts and to fail gently if a required microservice is unavailable. The benefit to this approach is that, due to the synchronous nature of these interactions, we know that all steps of an activity have been completed when the original call returns. The limitation is that one non-responsive microservice can bring down an entire set of actions. A more modern approach to orchestration has been developed with service meshes [13]. A service mesh has the responsibility of providing service discovery while also balancing requests across multiple instances of a microservice; they also guard against having an activity fail by retrying requests. A service mesh works by adding a sidecar to all microservices allowing it to act as a proxy between a microservice and the outside network. Unfortunately, service meshes are still new technologies that are rapidly evolving; they often lack features found in other approaches such as the extensibility capabilities found in choreography-based systems. As a result, I do not make use of them in my thesis work.
2.5
Messaging systems
Messaging systems organize queues of messages produced by microservices and notify subscribed components when they arrive. Their main objective is to decouple components and to serve as a cache if consumers cannot process all of the incoming messages. This allows for more reliable systems as a system does not depend on the mutual availability of a sender and a receiver to pass messages as they would if they used other messaging systems, such as HTTP.
2.6. Big Data Storage Systems 7
There are many options available in this space, with the most popular being Apache Kafka and RabbitMQ. Kafka is a decentralized, high-availability messaging system that allows one to publish messages organized by topics. It allows for high par-allelizability thanks to the partitions on topics, which lets one read and write at a higher rate. Each partition can have one consumer associated with it providing faster reads.
Another benefit of Kafka is its persistence system. Thanks to a strong integration with the kernel of the host operating system, it persists data faster than other sys-tems. This is due to the fact that it gives the responsibility of flushing messages to disk to the kernel, taking advantage of optimizations like disk page caching and memory caching implemented in modern operating systems.
In addition, Kafka is one of the most used messaging systems in the industry. Many companies use it in production to decouple their systems. Kafka has a strong com-munity behind it as well, and large organizations (e.g. LinkedIn) take an active role in maintaining it.
Messaging systems are needed for choreography microservice architectures as they serve as the communication layer between microservices.
2.6
Big Data Storage Systems
For my thesis work, I will be collecting data from Twitter via the Streaming API. This API is limited to provide 1% of the total tweets generated in Twitter every minute. Based on a report from 2013, I know that rate is approximately 5700 tweets per sec-ond on average [11]. As a result, I can calculate the total number of tweets per second that I estimate will flow through my system prototype per second and that is approximately 57 tweets per second on average as a minimum bound. Since that corresponds to ˜4.9M tweets/day, I need a data storage technology that scales to han-dle large datasets. As previously studied in Project EPIC [16], I need to use a NoSQL database instead of a relational database to support the high volume of tweets that come from this API, making my system more scalable.
On the other hand I also need a system that allows analytical and operational queries to happen at the same time. I would like to be able to analyze my data in real time without having to stop my data collection process. Given that some analysis tasks may take a few minutes due to the high number of tweets, I need to have a system that supports high throughput for both parts (collection and analsyis). In this case, Cassandra is an excellent option as the number of operations it can perform per sec-ond scales better compared to other NoSQL alternatives, especially with operational and analytical workloads.[7]
To store tweets, I base my table structure on the current EPIC Analyze column family structure in Cassandra as described by the CQL code in Listing 2.1. I have added an index on the event_name attribute so that I can access events faster. I need this index as many queries are performed per event.
8 Chapter 2. Background
CREATE TABLE t w i t t e r _ a n a l y t i c s . tweet ( id uuid , t _ i d t e x t , event_kw t e x t , event_name t e x t , h a s h t a g s l i s t < t e x t > , media_url t e x t , t _ c o o r d i n a t e s t e x t , t _ c r e a t e d _ a t timestamp, t _ f a v o r i t e _ c o u n t i n t, t _ f a v o r i t e d boolean , t_geo t e x t , t _ i s _ a _ r e t w e e t boolean , t _ l a n g t e x t , t _ r e t w e e t _ c o u n t i n t, t _ r e t w e e t e d boolean , t _ t e x t t e x t , u _ c r e a t e d _ a t timestamp, u _ d e s c r i p t i o n t e x t , u _ f a v o u r i t e s _ c o u n t i n t, u _ f o l l o w e r s _ c o u n t i n t, u _ f r i e n d s _ c o u n t i n t, u_geo_enabled boolean , u_id t e x t , u_lang t e x t , u _ l i s t e d _ c o u n t i n t, u _ l o c a t i o n t e x t , u_name t e x t , u_screen_name t e x t , u _ s t a t u s e s _ c o u n t i n t, u_time_zone t e x t , u _ u r l t e x t , u _ u t c _ o f f s e t i n t, um_id t e x t , um_name t e x t , um_screen_name t e x t , u r l s l i s t < t e x t > , PRIMARY KEY ( id , t _ i d ) )
9
3 Problem Statement
The goal of my thesis is to explore the benefits and limitations in using container-orchestration systems to build and deploy software systems that engage in big data analytics. To perform this exploration, I will be redesigning the Project EPIC soft-ware infrastructure as a set of microservices—each inside a separate Docker container— that are deployed on a cluster of cloud-based machines via a container-orchestration system. The current infrastructure was manually deployed on a set of physical ma-chines in a local data center and was not developed using microservices or con-tainerization. My hypothesis is that I’ll be able to achieve greater scalability and reliability with the new architecture with significantly reduced maintenance costs. I will also explore whether I am able to achieve greater query flexibility and overall performance using this new style of software infrastructure. My specific research questions are:
1. What advantages and/or limitations will the new Project EPIC infrastructure have with respect to its predecessor?
(a) Is it more reliable? If so, why? (b) Is it more scalable? If so, why?
2. Does the new infrastructure have lower maintenance costs than the existing infrastructure?
(a) Is it easier to deploy? (b) Is it easier to upgrade?
11
4 Approach
In this section, I present the design of my replacement for the Project EPIC infras-tructure. The primary features of this infrastructure are:
• Event management (creation/deletion/modification of events with specific key-words)
• Real-time collection of streaming Twitter data
• Real-time classification of incoming tweets (assigning tweets to active events)
• Data Analysis (performing queries on collected tweets using batch processing) My goal is to recreate these features with less code and which is easier to deploy and update and is more flexible, scalable, and reliable than the existing infrastructure. As mentioned above, my design will rely on a choreography-based microservices approach that is deployed on a cloud-based infrastructure making use of Docker and Kubernetes. My microservices will rely on Kafka to pass messages to one another via message queues (topics) that are created in response to requests to collect on crisis events.
One goal I have in my design is to make as many of my system components to be stateless. That is, these components will be designed to receive an incoming mes-sage from a Kafka queue that contains all the state they need to perform their oper-ation. They will, in turn, generate messages that contain all the state that is needed for downstream components to process them. This design approach will pay divi-dends as it will allow the underlying container orchestration system to easily replace services that have crashed and to instantiate multiple copies of a particular service when there is a surge in demand for its services.
Not all of my components will be microservices. I will rely on Cassandra to persist the tweets that are collected; the reasons for using Cassandra have already been well documented in Project EPIC’s prior work [2,16,3]. Furthermore, I will be making use of Apache Spark to perform data analytics in my prototype and will provide a web-based notebook user interface for the analysts to easily submit their queries and view the results. Examples of tools that provide notebook user interfaces for data analysis are Zeppelin and Project Jupyter.1 These platforms integrate directly with Apache Spark and provide advanced features for viewing the results of Spark queries as tables and charts. The use of Apache Spark in my infrastructure was driven by the fact that it comes with a specializedCassandra Connectorthat allows it to perform queries on a cluster of Cassandra nodes efficiently. For instance, the Cassandra connector is smart enough to “take the query to the data” and perform a particular query distributed on the data stored in each Cassandra node rather than requiring data to be transferred between nodes before the query is performed. This
12 Chapter 4. Approach
feature is known as preserving data locality and allows Apache Spark to perform queries on Cassandra in near real-time.
4.1
Custom Components
The specific components that I will be developing for my infrastructure are:
• Event Manager: A web-based system that presents a user interface for man-aging data collection events. Each event has a name and a set of associated keywords. For instance, if a hurricane were to threaten the Eastern Seaboard of the United States, an event would be created using the hurricane’s name and the year it occurred. For example, “2012 Hurricane Sandy.” The list of keywords then specify items of interest related to that event; these words are typically place names (new york city), behavior-related terms (evacuate, charging devices, etc.) or event-specific terms (flooding, smoke, etc.). Submitting these terms to the Streaming API represents a request to collect every new tweet that contains one or more of these terms.
Each time there is a change made to the current set of events, the Event Man-ager submits a message with all of the current events and keywords to a Kafka queue to report the change. The Event Manager makes use of its own local database (SQLite) to ensure that its state is saved in the event of a crash.
• Infrastructure Controller:The infrastructure controller is responsible for issu-ing commands to Kubernetes to ensure that all instances of the microservices needed to collect the current set of events are up and running. It receives the messages generated by the Event Manager and updates the Twitter Tracker and Twitter Normalizers (both discussed next) to match the new state.
• Twitter Tracker: The Twitter tracker is a microservice that connects to the Twitter Streaming API, submits a set of keywords provided by the Infrastruc-ture Controller, and then places each tweet that it receives in a Kafka message queue. If a change occurs, no tweet is missed as a new instance of the Twitter tracker is created and is receiving tweets before the old instance is taken down. All configuration for the Twitter tracker is handled via environment variables set by the container-orchestration system, making this microservice stateless.
• Twitter Normalizer:A Twitter normalizer is a microservice that gets assigned the keywords associated with a single event and is plugged into the Kafka queue that receives tweets from the Twitter Tracker. (This particular queue is configured such that all subscribers see all messages; in this case, each message contains a single tweet that was received from the Twitter Streaming API.) When a Twitter normalizer finds a tweet that contains one of its keyword, it normalizes that tweet to match the schema shown in Listing 2.1 and stores the tweet in Cassandra.
Note: since more than one event can specify the same keyword (for instance two hurricanes active at the same time may both containhurricaneas one of their keywords), a tweet may be stored multiple times by my prototype. Since most queries are focused on a particular event, this duplication is not an issue. However, if a query is specified across multiple events, then the onus is on the analyst to remove duplicate copies of a tweet before metrics are calculated.
4.1. Custom Components 13
FIGURE4.1: Proposed system architecture
One Twitter normalizer is created for each event specified by the Event Man-ager. Of course, the Infrastructure Controller has the option of instantiating multiple instances of a Twitter normalizer if, for instance, it has determined that an event has been assigned a lot of high-frequency keywords but that par-ticular functionality has not yet been implemented in my prototype.
Given these descriptions, the software architecture of my prototype is shown in Fig-ure 4.1. In the next section, I will present more information about how my prototype is actually implemented.
15
5 Implementation
In this section, I provide implementation-related details of my software prototype. The prototype is fully implemented and running on a set of nodes hosted by Google Cloud. I created four nodes in total, each with one virtual CPU and four gigabytes of RAM. On those nodes that host Cassandra, we reserve one gigabyte of RAM for Cas-sandra’s exclusive use and allow the remaining memory to be used by other com-ponents deployed on those nodes (such as Apache Spark). The nodes that host Cas-sandra are deployed using a native Kubernetes resource calledstateful sets. This data structure associates persistent volumes with particular system components such that data is preserved across restarts and crashes. They are designed to be used with dis-tributed databases, like Cassandra, making it easy to add and remove nodes that host Cassandra at run-time. Thus, if we add a new node to our Cassandra clus-ter, Kubernetes ensures that a new persistent volume is created and attached to that node and then ensures that each time that component is activated the same persis-tent volume is made available to the database running on that node.
As mentioned above, we also designed our Kubernetes configuration to deploy an instance of an Apache Spark worker on each Cassandra node and then also specified one additional node to serve as the Apache Spark master node. A container with Zeppelin was also deployed configured to send queries to the Spark master node via Zeppelin’s cassandra-spark library.
I now present details on how each of the custom components discussed in Chapter 4 were implemented. In general, microservices were implemented first in python for ease of prototyping and then switched to a different implementation language if performance problems were detected. Furthermore, all microservices were placed in individual Docker containers which were then deployed via Kubernetes as dic-tated by the Infrastructure Manager. Further details on each component are now presented:
• Event Manager: The event manager is implemented as a stateful django web application. It supports CRUD operations on events. Any change of state is pushed out as a message on a Kafka queue (and acted upon by the Infras-tructure Controller). It stores its data in SQLite as a file on a Google Cloud persistent disk. This set-up ensures that it can find its state across restarts.
• Infrastructure Controller: This controller is written in python and makes use of python libraries that allow it to interact with Kafka and Kubernetes. When it receives a message from the Event Manager, it issues commands to Kuber-netes to declare the new state of the world. If an event is no longer active, its associated Tweet Normalizer is shut down. If a new event is specified, a new instance of the Tweet Normalizer is configured and deployed.
16 Chapter 5. Implementation
• Twitter Tracker: The Twitter Tracker was first implemented in Python but I discovered that python’s run-time engine was not fast enough to handle con-sistently high streaming volumes over long periods of time. As a result, I reim-plemented this microservice in Go for better reliability and performance. As discussed above, this service submits keywords to Twitter’s Streaming API and then stores each tweet that it receives in a Kafka topic. The infrastructure controller is the one in charge of deploying and updating this service. A set of all the tracked keywords is passed as an environment variable on start by Kubernetes. To update the keywords, Kubernetes performs a rolling update by creating a new instance and destroying the old one, once the new one has correctly started the stream.
• Twitter Normalizer: The Twitter Normalizer is the one component in my in-frastructure that can be instantiated multiple times and needs to monitor a different set of keywords in each instance. To facilitate this, I had the Infras-tructure Controller direct Kubernetes to pass the keywords needed by each in-stance of the Twitter Normalizer via environment variables. Kubernetes could then deploy an instance of the Twitter Normalizer Docker container onto a node, configure its environment variables to match the keywords of the given event, and launch the microservice. The Twitter Normalizer was implemented in Python but specific C-based libraries were used to implement tasks that it executes over and over, e.g. loading and parsing JSON objects. This technique enabled the Twitter Normalizer to process the incoming stream of tweets with acceptable performance.
5.1
Deploying the System
Deploying my prototype is straightforward given the use of Google Cloud and Ku-bernetes. As mentioned above, I created a four-node cluster with each node allo-cated one virtual CPU and four gigabytes of RAM. Kafka and Cassandra/Spark are deployed first. In my prototype, I created two Kafka brokers that work together to manage the two primary topics needed by my design (the queue between the event manager and the infrastructure controller and the queue between the Twitter tracker and all instances of the Twitter normalizer) and instances of Cassandra/Spark on three of our four nodes. I then deployed the containers for my two front-end com-ponents: Zeppelin and the event manager. Finally, I deployed an instance of the infrastructure controller. All other components will be deployed by the infrastruc-ture controller (including the Twitter tracker) when it receives a message from the event manager. This approach makes sense since there is no need to have the Twitter tracker and the Twitter normalizers running if there are no events to collect.
5.2
Front-End Components
Figure 5.1 shows the user interface of the event manager. Each event is shown in a separate box with information about the event’s keywords. There are controls for creating new events and a separate control for sending a message to the infrastruc-ture controller with the most recent state of the world. Events can be edited/deleted by controls that appear when its box is selected. Figure 5.2 shows the user interface
5.2. Front-End Components 17
FIGURE5.1: Event manager UI
provided by Zeppelin. Queries can be submitted via a textbox and results can be displayed in tables or via bar graphs (as shown).
18 Chapter 5. Implementation
19
6 Evaluation
In order to evaluate my work, I compare the architecture and implementation of my prototype with the existing Project EPIC infrastructure along the dimensions of reliability, scalability, performance, and real time delivery.
6.1
Reliability
In order to evaluate my work, I compare the architecture and implementation of my prototype with the existing Project EPIC infrastructure along the dimensions of reliability, scalability, performance, and real-time delivery.
6.1.1 Current infrastructure
Reliability of the existing EPIC infrastructure needs to be studied separately across EPIC Collect and EPIC Analyze.
EPIC Collect is designed to be highly available. It is implemented as a multi-threaded Java application; some threads are used to read the incoming tweet stream, some are used to classify tweets, and some are used to monitor the other threads. If the mon-itoring threads detect that one of the readers is no longer producing tweets for the classifiers, it can issue a command that causes the current connection to the Twit-ter Streaming API to be dropped and all of these threads to be deactivated. This action, in turn, causes another thread to detect that the Twitter connection is down and it then restarts the connection which causes readers, classifiers, and monitors to once again be instantiated. This approach can ensure reliable performance for many days; however, sometimes errors occur that cause all threads to lock up. To handle this situation, EPIC Collect makes use of a cron job that wakes up once per minute to examine the current length of the EPIC Collect log file. Each reader and classifier will send information to the log file and when data collection is proceeding smoothly, the log file is always increasing in size. As a result, if the cron job wakes up and discovers that the log file has not increased in size over the past minute, it assumes that the collection software has locked up. It will invoke a command to kill the previously running process and it then invokes the collection system, notes the size of the log file, and goes back to sleep.
With these techniques, EPIC Collect has achieved 99% uptime since the summer of 2012. The only problem that these techniques cannot account for is if the data center loses its network connection. When that happens, the cron job will be stuck in a cycle of terminating and restarting the software until the network connection is restored. Fortunately, complete loss of the data center’s connection to the Internet is a very rare event, happening only once in a four year period.
20 Chapter 6. Evaluation
EPIC Analyze does not have the same level of reliability.In order for the web appli-cation to function, it requires that Redis and Solr be up and running. If these systems are not available, then the web application is non-functional. Compounding this sit-uation is the fact that EPIC Analyze is deployed manually by its developers; there is no automated way to deploy it and there is no monitoring system detecting for system failure. As a result, there is also no automated recovery procedure. All as-pects of the system deployment for EPIC Analyze require manual intervention by developers.
6.1.2 System Prototype
In the case of my system prototype, overall reliability is high, due to the use of a container-orchestration system. Kubernetes provides two components to increase the reliability of our system. The first Kubernetes-provided component is the con-troller manager that runs on the master node of our cluster. This component is re-sponsible for keeping track of all containers running on our cluster. It also follows the requests made by the infrastructure controller to ensure that the right number of replicas are created for the components that need them. For instance, in my pro-totype, I specify that there should be two replicas of a Kafka broker available at all times. If any of those replicas go down, Kubernetes will detect that and launch a new one. This functionality extends to all of our containers; if any container stops running, the controller manager detects it and schedules a new instance of that con-tainer to run on an available node. This check is performed when the infrastructure controller makes new requests or when an existing node informs the controller man-ager that one of its containers went down.
The second Kubernetes-provided component is the scheduler. This component makes sure that new containers are scheduled on the best node possible. Kubernetes allows an engineer to configure the amount of memory and cpu permitted by a container; this information allows the scheduler to find the best fit for each deployment request. With these two components, Kubernetes automates the deployment of containers on a cluster of machines and handles any failures automatically. Its services are signif-icantly more advanced than the existing reliability measures put into place by the Project EPIC developers, who were more interested (at the time) in system function-ality and not in automated failure recovery mechanisms beyond what was done to ensure reliable data collection.
Kubernetes provides one additional reliability-related feature and that is related to upgrading containers to provide new versions of the microservice within—this fea-ture is called arolling update. When performing an upgrade, the controller manager first deploys the new version of the component and ensures that it is up and run-ning. It then removes the container containing the previous version of the compo-nent. I make use of this functionality with the Twitter Tracker compocompo-nent. When a new change to data collection is announced by the Event Manager, the infrastruc-ture controller arranges to have a new instance of the Twitter Tracker component deployed with the new state. It starts to collect tweets using the newly updated keyword list while the previous instance is still collecting data on the prior set of keywords. This approach ensures that no tweets are missed when the transition oc-curs. Twitter applications can only have one standing connection. When the new
6.2. Scalability 21
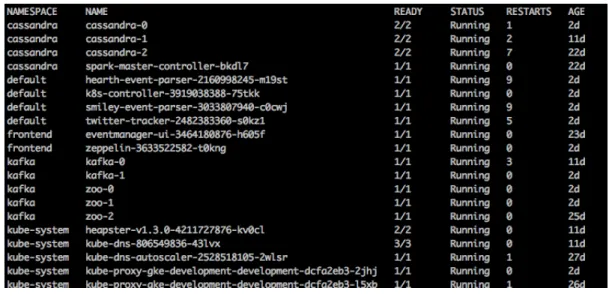
FIGURE6.1: Number of automated restarts by Kubernetes of the sys-tem prototype over a period of eleven days.
instance establishes a connection, Twitter will close the old connection ensuring that there will not be any duplicated tweets stored in the transition.
Figure 6.1 displays a typical report for the number of times the containers in our sys-tem prototype were restarted automatically by Kubernetes over a period of eleven days with no interaction from the user. The first thing to note is that all components remained active for the entire time period; that is data collection proceeded unin-terrupted during those eleven days. However, due to system demands, Kubernetes may have found itself needing to, for instance, delete a container on an overloaded node and move it to a node that had more resources available. Given that my code is now fairly stable, if we increased the amount of memory on each node and added a few more nodes to our cluster, the total number of restarts would go down. But, given the limited resources I had during development, the more important issue is that despite limited resources, the system continued to run 24/7 with no interven-tions required by the developer. Note: that in Figure 6.1, some instances are listed as only existing for two days; this discrepancy is due to the fact that Kubernetes will restart a container’s count if it needs to do a hard restart of the container. This occurs when Kubernetes issues a request for the container to shut down and it stays active, ignoring the request. This might occur due to the contained microservice crashing inside and thus unable to exit gracefully. As a result, Kubernetes is forced to kill the container without a graceful shutdown.
6.2
Scalability
The second dimension I am using for my evaluation is scalability. I am interested in how well both infrastructures deal with the ability to scale to large amounts of data. I want to avoid wasting system resources unnecessarily while having the capacity to scale and I want to understand how scaling impacts overall system performance.
22 Chapter 6. Evaluation
6.2.1 Current infrastructure
Scalability with the existing infrastructure is not a straightforward process. With respect to throughput capacity, EPIC Collect would need a developer to manually launch a new instance with new Twitter credentials and set-up a second cron job to monitor the second instance’s log files. That work is feasible but not straightforward and would have to be performed anew if more capacity was needed and a third instance was required. This situation is one reason why EPIC Collect does not per-form data normalization; it simply classifies tweets with respect to the current set of events and then it stores them in Cassandra. If data normalization was added to the existing EPIC Collect then it would struggle to handle spikes in incoming traffic as it would not be able to automatically scale its capacity to handle demand.
With respect to storage capacity, EPIC Collect is in a better situation since it stores tweets to a four-node Cassandra cluster with terabytes of disk space available. If additional capacity is needed, a developer just needs to configure a new node and add it to the existing cluster. As with the discussion above concerning throughput capacity, while this works, it is hardly an automated approach to scaling the infras-tructure on demand. With respect to EPIC Analyze, the only component that is a target for scaling, apart from storage, is the frontend module that is currently writ-ten in Ruby on Rails. To do that, multiple instances of the application would need to be launched and a load balancer put in front of those instances. To make this work, the existing web application would need to be refactored such that session state can be made consistent across all of the instances. That is a straightforward engineering task but not simple by any means. Furthermore, maintaining a load balancer is a complex process when done manually and, as discussed above, all maintenance on EPIC Analyze has to be performed manually.
I conclude that the existing Project EPIC infrastructure is not easy to scale.
6.2.2 System Prototype
Scaling my system prototype is much easier given the functionality gained from Kubernetes. When deploying a microservice via a container, I can specify how many replicas of that service I would like to deploy alongside it. The controller manager will try to schedule the requested number of replicas as long as there are enough system resources available across the cluster. Our ability to deploy multiple replicas is helped by the fact that most of our services were designed to be stateless. All of the state that a service needs to perform its task is contained in the messages that it receives. As a result, it does not matter which replica handles a given input message. Replicas can also be automatically triggered based on CPU usage. If a container hits 90% CPU utilization because it has experienced a spike in the number of input messages, Kubernetes can automatically spin up new replicas until the utilization goes down, due to the fact that the new replicas can help the existing component handle the spike in messages.
While these services are largely automatic, a developer can always interact with Ku-bernetes directly to manually deploy additional components to help with scalability. The developer can issue these commands using thekubectlcommand line tool or via Kubernetes’s web interface.
6.3. Performance 23
v a l t a b l e = s c . c a s s a n d r a T a b l e ( " t w i t t e r _ a n a l y t i c s " , " tweet " )
v a l words = t a b l e . s e l e c t ( " t _ t e x t " ) . flatMap ( l => l . g e t S t r i n g ( " t _ t e x t " ) . s p l i t ( " " ) )
. map( word => ( word . toLowerCase , 1 ) ) . reduceByKey ( _ + _ ) . map( _ . swap ) . sortByKey (f a l s e, 1 )
Listing 6.1WordCount Spark script
Due to the features of container orchestration systems, my system prototype is much easier to scale than the existing Project EPIC infrastructure.
6.3
Performance
I am unable to provide a comparison between the two infrastructures with respect to performance. Both systems have similar performance with respect to data col-lection but detailed tests and comparisons are not possible since EPIC Collect is a production system that other members of the Project EPIC team depend on for their research. As such, in this section, I provide insight into the performance my system prototype achieves on my small four-node cluster. As a reminder, each node in the cluster has access to one virtual CPU and four gigabytes of RAM. My test involves executing a Spark-based job on the cluster to count the number of words contained in all collected tweets. Each time I ran the query for the evaluation, the total num-ber of tweets collected was different, increasing each time. I selected this particular test since word count is a highly parallelizable operation. It also demonstrates the integration of Spark into my system prototype.
The code entered into Zeppelin is shown in Listing 6.1. The first line establishes a connection to Cassandra and creates a Spark Context object by which queries can be invoked. The second line expresses a series of transformations that Spark will apply to count all of the words of all tweets contained in Cassandra. It starts by selecting the text of the tweet, splitting the text into words, mapping each word into a pair (word, 1) and then reducing all such pairs by adding up the integers for each matching key. Thus all pairs like (cat, 1) would eventually turn into a single pair (cat, 1000) where 1000 represents the number of times that cat appears in the collected tweets. Finally, the pairs are inverted, e.g. (1000, cat), and then sorted in descending order.
The power of Spark is that all of these transformations are applied to every tweet in parallel and, furthermore, as much of the transformations are applied locally on every node before any data is sent to the master node for the final combination of pairs across nodes. Spark provides a mechanism to reveal how it will execute a query known as the debug string.
Each indentation in the debug string is a map stage, and each ‘+’ is a shuffle phase. As we can see in Listing 6.2, Spark delays shuffling data until it is time to execute thereduceByKeystep. This makes sense since it can generate word pairs on each node without having to transfer data across nodes. However, once it needs to count the total number of words, it has to send data across nodes to a master node to create
24 Chapter 6. Evaluation ( 1 ) ShuffledRDD [ 1 1 2 ] a t sortByKey a t < c o n s o l e>:31 [ ] +−(176) MapPartitionsRDD [ 1 1 1 ] a t map a t < c o n s o l e>:31 [ ] | ShuffledRDD [ 1 1 0 ] a t reduceByKey a t < c o n s o l e>:31 [ ] +−(176) MapPartitionsRDD [ 1 0 9 ] a t map a t < c o n s o l e>:31 [ ] | MapPartitionsRDD [ 1 0 8 ] a t flatMap a t < c o n s o l e>:31 [ ] | CassandraTableScanRDD [ 1 0 7 ] a t RDD a t CassandraRDD . s c a l a : 1 5 [ ]
Listing 6.2Debug string rdd
FIGURE6.2: Plot on wordcount time for dataset size
the final counts. It then performs one more shuffle when it sorts the final key-value pairs after swapping them from this format (cat, 1000) to this format (1000, cat). As we can see in Figure 6.2, the word count performance is linear but with a flat slope at the beginning indicating that performance improved with larger numbers of tweets to analyze (see the increase in tweets processed per second in Table 6.1) and then increasing as the total size of the data set went past 2M tweets. The likely reason for this performance curve is that there is a certain amount of overhead that is incurred each time to stage the job and perform the shuffle steps at the end, counting up the pairs and sorting them. However, as the number of tweets increases, each individual node can do more work uninterrupted and can execute as quickly as possible without the need for coordination messages. As a result, the performance per tweet increases as the datasets get larger and this keeps performance acceptable.
6.4. Software development and maintenance 25
Number of tweets Time (s) Tweets/sec
490199 238 2060
1400884 469 2987
21680851 1107 19585
27199614 1500 18133
54395957 4228 12866
TABLE6.1: Number of tweets in dataset and performance metrics
6.4
Software development and maintenance
One of my goals was to develop a system that was easier to maintain. I accom-plished this primarily through the use of microservices. The code associated with a microservice is small, making it easier for new developers to understand and main-tain it. Furthermore, as was the case with several of our components, we wanted to make it straightforward for a developer to reimplement one of our components if there was a compelling reason to do so, such as poor performance.
6.4.1 Current infrastructure
Currently the code for this infrastructure is split at a high-level into two separate, large and complex projects. This presents challenges to new developers on the Project EPIC team in terms of getting to know the code to a point where they feel confident they can contribute to it.
The Ruby-on-Rails portion of EPIC Analyze has 5086 lines of code and is maintained in a git repository on GitHub. It is thus easy for multiple developers to work on it but it takes a lot of work to understand it. It relies heavily on Ruby-on-Rails conventions and that adds an extra layer of difficulty for developers unfamiliar with that frame-work. In addition, EPIC Analyze relies on the use of solr and redis, two middleware services that both have significant learning curves. EPIC Collect is likewise a large system, consisting of thousands of lines of Java code that rely heavily on the Spring Framework.1 Learning that codebase is difficult, even for experienced developers, and requires a sophisticated understanding of a wide range of Java infrastructure: maven, jenkins, Tomcat, and more. Finally, it is difficult to debug changes to both systems: EPIC Analyze requires deploying multiple servers on multiple machines as does EPIC Collect and the latter has additional monitoring software that must be configured and maintained as well. The result is that the current Project EPIC infrastructure is difficult to maintain.
6.4.2 System Prototype
My system prototype is divided into two main parts. The first part consists of the code for the various components, written in both Python and Go. The second part
26 Chapter 6. Evaluation
consists of declarative configuration documents written in YAML that specify how to deploy the infrastructure into Kubernetes.2
• Twitter tracker (Go): 108 lines
• Kubernetes controller (Python): 145 lines
• Event manager (Python/Django): 2090 lines
• Tweet normalizer (Python): 209 lines
The largest component is the Event manager but that is not surprising as it requires all the code that is normally associated with a fully functioning web application. Otherwise, the code is fairly equally distributed among the various microservices. Each service is small and easy to understand. Different developers can work on each microservice and then those services can be linked via Kubernetes and Kafka. Furthermore, due to the use of Kafka, each microservice can be written in a differ-ent technology stack allowing us to choose the tools and languages best suited to each task. As long as the technologies that we select can be containerized, then the resulting microsevice can easily be deployed by Kubernetes.
The YAML files consist of 3345 lines of declarations that knit all of the components together. Kubernetes currently requires developers to manually write and review each YAML file but developers are working on new tools that will reduce the need to generate them by hand.
As a result, my system prototype has significantly reduced maintenance costs. It is straightforward to develop simple microservices and then the use of Docker, Google Cloud, and Kubernetes makes it much easier to deploy those services into a produc-tion environment that can be scaled on demand.
27
7 Results
After comparing both the existing Project EPIC infrastructure and my system pro-totype, I am now going to reflect on possible answers to the questions proposed in chapter 3.
My work suggests that Project EPIC should invest the effort to migrate its existing infrastructure to the new software architecture enabled by container-orchestration systems. While my prototype does not recreate all of the functionality of EPIC Col-lect and EPIC Analyze, I have been able to reconstruct the core aspects of these sys-tems in approximately one semester of effort, using less code, and exceeding the existing infrastructure in terms of scalabilty, reliability, ease of configuration and deployment, and maintainability—all because of the benefits provided by contain-erization, container-orchestration systems, and microservices.
Kubernetes provides many features that makes my prototype more scalable and re-liable. Rather than having to rely on ad hoc monitoring approaches, system moni-toring is built into Kubernetes and provides for a wide range of features: replicas, rolling updates, auto-scaling, etc. None of those features are available in the current Project EPIC infrastructure and would require significant refactoring to add. Fur-thermore, my approach to using stateless microservices provides me with flexiblity and scalability that Project EPIC’s current infrastructure cannot match. Lastly, by making use of Google Cloud, I am able to create clusters with a flexiblity that just is not possible with Project EPIC’s fixed set of machines in a traditional data center. Regarding mantainability, my prototype has several advantages. First, my use of microservices separates responsabilities into different components that are smaller in size than the stateful components found in the existing infrastructure. This size difference makes it easier for developers to engage in the maintenance of individ-ual microservices without having to understand the whole system at once. This design, in turn, means that we do not need experts for the whole system; each mi-croservice can be mantained independently. In addition, Kubernetes offers a plat-form to deploy microservices that provides a better separation between deployment infrastructure and application development. Developers do not need a system ad-ministrator to deploy their code; they just need to understand how containerization works. Once they have wrapped their microservice into a container, it can easily be deployed and plugged into all of the reliablity and scalability features that Ku-bernetes provides. Furthermore, KuKu-bernetes is a platform that allows developers to build their own tools on top of it. Thanks to its open source community, some tools are already built and can be added into existing Kubernetes clusters with ease. For example, with respect to reliability, we can add monitoring tools into Kubernetes clusters in a straightforward way. The API exposes resource usage information al-lowing one to configure alerts if needed and the community has built packages of configuration files that help to deploy monitoring solutions with ease.
28 Chapter 7. Results
With respect to deployment, Kubernetes’s configuration files make it straightfor-ward to specify the configuration of extensible, microservice-based software sys-tems. With these configuration files, it makes it possible to migrate systems from one cloud provider to another, providing a means for saving on infrastructure costs. The Kubernetes scheduler then attempts to deploy the specified software system in the most optimal way, making best efforts to instantiate the described system within the constraints of the resources available on the cluster. Adding nodes to an exist-ing cluster, then provides Kubernetes with the capacity it needs to allow a system to scale and become more reliable.
Finally, Kubernetes makes it possible to upgrade a software system easily. Each mi-croservice can be independently upgraded using the rolling update withough hav-ing to upgrade the whole system at once and new components can be easily added due to the use of a message broker. You can first add a new service that generates a new type of message. You can then add services that will process those messages and then wire those services together by connecting up the message queues.
Given all of these benefits, my thesis work has shown that it is time for a major migration of the Project EPIC infastructure to the new approach represented by container-orchestration systems. Such a migration can build off the work I have invested in creating my system prototype, identifying new microservices that need to be added to further extend the overall functionality of the system and bring it closer to the full extent of services offered by the existing infrastructure.
29
8 Related Work
There has been a lot of research on big data analytics. Open source tools like Hadoop and Spark have made available scalable, distributed computation to the general pub-lic. In addition, thanks to the progress in big data storage, with systems like Cassan-dra, hosting internal storage has never been easier. However there is not a lot of work regarding using container-orchestration for big data analysis systems. There has been a lot work in both fields, but there is not a lot of work about combining them.
The work presented by [8] is probably the closest approach to the system I present here. The main differences are in the actor system and the orchestration platform. Instead of using Mesos for orchestration and Akka for actors, I preferred to use Ku-bernetes with container microservices instead of actors. The stack described also uses Spark Streaming to deploy a Lambda architecture which could be done in the current infrastructure extending the capabilities of the system. The main reason for avoiding Spark Streaming has been that its micro batching focus could involve los-ing tweets durlos-ing the normalization process. Furthermore, the reason to avoid Akka for actors was that it had similar features to Kafka and microservices in Kubernetes. In that way, I considered that adding Akka would make the system more complex and therefore more difficult to maintain.
There has also been previous work trying to approach big data analytics to a higher scalability like this paper from 2014 [10]. This system proposal is agnostic on how to deploy such systems, leaving the developer to deal with it. As container and con-tainer orchestrated systems were not popular at that time, they are not considered. Its main approach to getting these systems to scale is via the use of different Hadoop components. Currently, Spark is preferred over Hadoop, given the increased perfor-mance made possible via its memory-based approch to MapReduce.
In [9], we see a similar approach using Hadoop and Pig in the batch layer instead of Cassandra and Spark. They also incorporate a streaming layer for real-time analysis making use of the lambda infrastructure. In [12], we can see Zeppelin used as a dashboard interface similar to our work. However none of this systems made use of the container-orchestrated approach and so lack the scalability and reliablity benefits that they provide.
31
9 Future Work
This project was focused on demonstrating the advantages achieved by migrating a big data analytics system to a container-orchestration system. My system prototype has an impressive set of features but it is, however, just a proof of concept. As such, there are many areas for improvement including resource usage, security, database optimization, and extensibility.
With respect to resource usage, there is room for improvement on understanding the usage constraints of each of my system components. If I could identify upper and lower bounds for each component, I could provide the Kubernetes scheduler with even more information in which to make optimization decisions and container allocations.
Another feature that is needed is a centralized system for authentication and au-thorization. My research prototype deliberatly avoided imposing any security mea-sures as our focus was on what was feasible with respect to reliablity and scalability. However, if this system were to be transitioned into a production environment, then a wide variety of security-related techniques would need to be adopted: encryption of data, securing of individual components, the addition of user and system roles and authorization of those roles to access particular types of data and engage in particular types of operations.
There is plenty of room for improvement with respect to the structure of my Cassan-dra tables. For my thesis work, I used a naive approach to tweet storage. It works well for what I needed to do but there are plenty of ways in which it could be im-proved. A way to make this better is by upgrading event_name to be a partition key. This would allow Cassandra to cluster tweets that belong to the same event improving all queries that are event-based. In addition, I would need to add logic in the partition assignment for the tweet normalizer, as Cassandra limits the amount of rows a partition can contain and we need a way to make it easier for data to be distributed across all nodes. We could do this by assigning a random partition num-ber when the tweet normalizer starts and choose a new value every one hundred thousand stored tweets. This would need to be studied more carefully in the future. With respect to system extensibility, there are a few ways that the prototype could be improved. For example, I could add a real-time query resolver for a very specific query by plugging it into the raw_tweets queue and make it analyze the data. Or I could add other systems for specific queries like Elastic search for full-text search or analysis. In addition we could extend the system to include better collaboration tools like a notification system plugged into the event_updates queue.
As one can see, there are many possibilities for improvement and due to the bene-fits of container-orchestration system, many of these improvements can be done in isolation without the need to upgrade all of the components at once.
33
10 Conclusions
Container-orchestrated technologies make it easier to develop big data analytics sys-tems. Their abstraction layer allows for a separation of responsibilities between de-velopers and system operators, allowing them to work together without too much overlap in their work. This provides potential for innovation within big data analyt-ics, as improvements can be developed separately for infrastructure and software. It also opens a gate to new approaches to the state of these systems, extracting the state out of the individual system components and into the surrounding container-orchestrated system and the messages that get passed between the componets. In my work, using container-orchestration systems to recreate as much of the core functionality of the existing Project EPIC infrastructure has allowed me to develop a system that has proven to be easier to scale. It also has produced a system with greater reliablity by moving that responsibilty out of the big data system itself and into the orchestration system. My prototype has also proved to be easier to mantain, as components are smaller and it is easier to adopt a more continous development and deployment cycle for each system component. In addition, container systems like Docker allow developers to focus more on an application’s logic instead of wor-rying about deployment infrastructure.
In conclusion, I have demonstrated that container-orchestration systems are a great option for developing big data analytics infrastructures that require flexible scaling and high reliability.