Goran Kraljevi´c, Sven Gotovac
Modeling Data Mining Applications for Prediction of Prepaid
Churn in Telecommunication Services
UDK
IFAC 654.034:004.425.8.0 Professional paper
This paper defines an advanced methodology for modeling applications based on Data Mining methods that represents a logical framework for development of Data Mining applications. Methodology suggested here for Data Mining modeling process has been applied and tested through Data Mining applications for predicting Prepaid users churn in the telecom industry. The main emphasis of this paper is defining of a successful model for prediction of potential Prepaid churners, in which the most important part is to identify the very set of input variables that are high enough to make the prediction model precise and reliable. Several models have been created and compared on the basis of different Data Mining methods and algorithms (neural networks, decision trees, logistic regression). For the modeling examples we used WEKA analysis tool.
Key words: Data Mining applications, Prepaid churn model, Neural networks, Decision trees, Logistic regression Modeliranje Data Mining aplikacija za detekciju churna Prepaid korisnika telekomunikacijskih usluga. U radu je definirana unaprijeena metodologija za proces modeliranja aplikacija zasnovanih na metodama dubinske analiza podataka (Data Mining), koja predstavlja logiˇcki okvir (framework) za razvoj razliˇcitih Data Mining ap-likacija. Predložena metodologija je primjenjena na primjeruData Miningaplikacije za detekciju churna Prepaid korisnika telekomunikacijskih usluga. Glavno težište ovog rada je na definiranju uspješnog modela za predvianje potencijalnih Prepaid churn-era. Najvažniji dio izgradnje modela je definiranje onog skupa ulaznih varijabli koje su u toj mjeri snažne da model predvianja bude toˇcan i pouzdan. Kroz navedeni primjer je kreirano i usporeeno više modela zasnovanih na razliˇcitimData Miningmetodama i algoritmima (neuronske mreže, stabla odluˇcivanja, logistiˇcka regresija). Za primjere modeliranja korišten je analitiˇcki alat WEKA.
Kljuˇcne rijeˇci: aplikacije dubinske analize podataka, prepaid churn model, neuronske mreže, stabla odluˇcivanja, logistiˇcka regresija
1 INTRODUCTION
In the late 20thcentury, scientists were focused on
the-oretical bases for Data Mining, and improvements and up-grading of the Data Mining algorithms and methods [2].
In the 21st century, the focus is moved toward
scien-tific research on Data Mining applications, in other words application of Data Mining methods in real environment, which resulted in real necessity for these applications on the market [1],[3],[16],[17].
Modeling and planning of development process of Data Mining applications has been recognized as a new chal-lenging field for research [5],[6],[7],[8],[9].
Currently, only a small number of users (less than 20%) apply one of the defined methodologies (CRISP-DM, SEMMA etc.) for development of predictive Data Mining applications [4],[11].
There is obviously available space and need for further research that would result in new methodologies that could
meet all requirements today’s business sets for applicative solutions based on Data Mining methods and algorithms.
This paper will define an advanced methodology for modeling of applications based on Data Mining analy-sis that represents a logical framework for development of Data Mining applications. A focus is on a more pre-cise definition of initial stages (defining Business and Data Mining goals), as well as final stages of modeling pro-cesses of Data Mining applications. These stages are rec-ognized as especially important and critical due to the tran-sition between a Business and Data Mining domain (ini-tial stage) and vice versa (final stage), that happen in these steps.
Suggested methodology for modeling process of Data Mining applications has been applied and tested on a Data Mining application for prediction of Prepaid users churn in telecommunications.
doesn’t imply any contractual obligation between users and a telecom operator, so the very definition of Prepaid churn is not simple [13],[14],[15]. In addition, the data available on Prepaid users are much more inadequate as compared to Postpaid users, especially when it comes to customer data domain. This fact adds to complexity of modeling process of predictive Data Mining applications related to Prepaid churn.
2 METHODOLOGIES AND MODELS FOR DE-VELOPMENT OF DATA MINING APPLICA-TIONS
It is often heard in business world that there is a will to use Data Mining applications since they result in visible benefits, but process of knowledge discovering based on Data Mining still seems to be not so easy to understand.
Precisely defined steps within a methodological frame-work and actions to be undertaken at each stage contribute to demystification of the process of Data Mining applica-tion development. Also, big project teams cannot funcapplica-tion properly without such a clearly defined process of applica-tion development and modeling, since it considerably fa-cilitates project design, time scheduling and project super-vision.
According to the Gartner base, two most commercially complete Data Mining tools, in terms of their visions and potentials, are SPSS and SAS. SPSS uses CRISP-DM methodology, while SAS uses its own SEMMA methodol-ogy (although it might be wrong to call SEMMA a method-ology), and for this reason the two methodologies (CRISP-DM and SEMMA) are best known and most commonly used for development of Data Mining applications [4].
Fig. 1. CRISP-DM process
CRISP-DM (CRoss-Industry Standard Process for Data Mining) consists of six phases (Business understanding,
Data understanding, Data preparation, Modeling, Evalu-ation, Deployment) intended as a cyclical process (see Fig. 1.) [12].
The CRISP-DM Special Interest Group was created with the goal of supporting the model. At the moment this groups has more than a hundred members participating ac-tively in work on the version 2.0 [19].
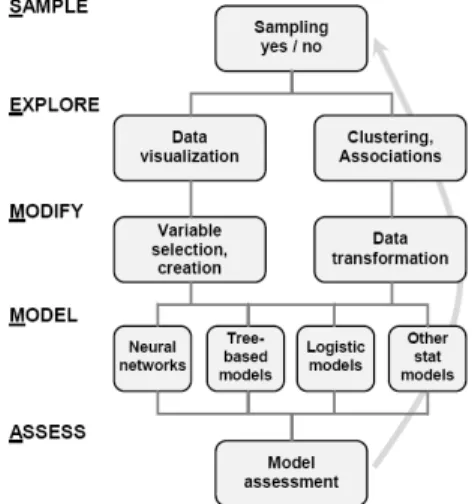
SAS has defined SEMMA (Sample, Explore, Modify, Model, Assess) model that was incorporated into the com-mercial Data Mining platform – SAS Enterprise Miner (Fig. 2) [4].
Fig. 2. Steps in SEMMA process
Latest research prove that less than 20% of consumers use one of the defined methodologies for development of predictive Data Mining applications, among which large majority relates to the most represented CRISP-DM methodology. Half of the users apply “their own” method-ology, and others either doesn’t use any specific one or rely on consulting knowledge of the outside company and their methodological frameworks (Fig. 3). [11].
Fig. 3. Based on 167 respondents who have implemented predictive analytics.
Cios and Kurgan adjusted CRISP-DM model to serve the needs of research in an academic community, and they
did it by adding several feedback mechanisms that did not exist in the previous models, and putting emphasis on the fact that the knowledge revealed within one domain can be applied in other domains (areas) as well [5],[6].
Reinartz’s model combines the tasks of data selection, cleaning and transformation as a single data preparation task [8].
Berry and Linoff have defined a methodology in 11 steps, emphasizing a need for defining a methodology that would help avoid situations in which things learned are not true, or they are true but useless at the same time [1].
Recently there have been attempts to improve existing analytics methodologies and allow them to become more effective and reliable in providing useful insights in busi-ness contexts [9],[10].
However, it is important to stress that the potential value of analytics has not been fully realised or utilised in busi-ness settings as yet.
2.1 Defining a Framework for the Process of Data Mining Applications Development
There is obviously space and need for further research that would result in newly defined methodologies that would meet all requirements today’s business sets for ap-plicative solutions based on Data Mining methods and al-gorithms.
We will define an advanced methodology for modeling process of Data Mining applications which represents a logical framework for development of Data Mining appli-cations.
Fig. 4. Framework for development of DM applications This methodology defines the following stages of devel-opment (Fig. 4):
1) Business goals definition 2) Data mining goals definition 3) Data preparation a) Data selection b) Data cleaning c) Data transformation 4) Data modeling 5) Analysis of results 6) Deployment 7) Monitoring
Data selection, Data cleaning and Data transformation can be named together as Data preparation.
We will present advantages of this methodology as com-pared to the existing one (described previously).
The first systems for knowledge discovering were in-tended primarily for experienced users familiar with Data Mining methods and algorithms. Commercial success of these systems was minimal.
With new tools with graphically intuitive interface, Data Mining has become available to a large number of users, but at the same time grew the number of meaningless data analysis by “experts” without sufficient knowledge on the data they analyzed, or on the Data Mining methods and al-gorithms available (neural networks, decision trees, logis-tic regression, fuzzy expert systems, clustering, Bayesian networks, etc.).
Terms such as „data fishing“ or „data dredging“ were empty terms for (sometimes desperate) attempts to find sta-tistically indicative data, and they are definitely not part of Data Mining analysis [5].
To avoid such “analyses” with no purpose, a change was introduced relating to the initial development stages.
Firstly, each project has to have from the very begin-ning, clearly defined business goals. The second key step is proper mapping of business goals into Data Mining goals. Failure to properly translate the business problem into a Data Mining problem leads to one of the dangers we are trying to avoid - learning things that are true, but not use-ful.
Business goals and Data Mining goals have to be mea-surable, reachable, realistic and well-timed. It is important to avoid words such as improve, optimize, clarify, help etc. These words are vague and a person using them is obvi-ously not capable of measuring their results.
Also, a disadvantage of the existing methodologies is visible in the domain of integration of ready-made Data Mining models into business and analytic information sys-tems of companies (BI, CRM etc.). Even the very defining of Data Mining should include thinking about presentation of the analysis results to the target users, to ensure that the model results become an integral part of a business process
of a company, comprehensible to the users even without Data Mining knowledge.
A crucial step that is often forgotten is control and main-tenance of the model after implementation.
It has been emphasized already that goals set at the be-ginning are to be measurable. Only clearly defined and measurable things can be unambiguously controlled and their efficiency tested (plan/goal vs. implementation).
Control can be on a daily, weekly, monthly or other ba-sis, depending on the type of the analysis performed.
By observing duration of each step within development methodology and its role within a whole development pro-cess, it is visible that most of the time (60-70%) is spent on preparing data for analysis.
About 10% of time is consumed on setting business and Data Mining goals, around 15% on creation of a Data Min-ing model and 10% on implementation, monitorMin-ing and maintenance of the model (Fig. 5).
Fig. 5. Estimate of time (without DW)
If a company owns a Data Warehouse (DW) and time for data preparation, that will reduce time consumption con-siderably (30-40%).
Fig. 6. Estimate of time (with DW)
By applying described methodologies for the process of modeling of applications based on Data Mining analysis, we’ll perform an analysis for prediction of Prepaid users churn in telecommunication industry (Section 4.).
3 CHURN TYPES IN TELECOMMUNICATION INDUSTRY
In the most of the European countries, penetration of mobile network users has gone beyond 100% (e.g. in Croa-tia 130%). Acquisition of new users is made more difficult,
since there are no new users. There are only users of ri-val companies that are exposed to numerous, carefully de-signed marketing campaigns in attempts to win them over. At the same time, a continuous work on customer reten-tion and churn prevenreten-tion becomes a necessity, because the competition has similar acquisition issues. Retention of the existing users is important since it is 5 up to 7 times cheaper to retain a consumer than to acquire a new one [16],[17].
Two basic categories of churners are voluntary and in-voluntary churners (Fig. 7.) [13].
CHURN
VOLUNTARY I NVOLUNTARY
Deliberate Incidental
Fig. 7. Churn taxonomy
Involuntary churners are the customers that telecommu-nication company decides to remove from the subscribers list. This category includes people that are churned for fraud (customers who cheat), non-payment (customers with credit problem), and under-utilization (customers who don’t use the phone).
Voluntary churn occurs when the customer initiates ter-mination of the service contract. When people think about Telco churn it is usually the voluntary kind that comes to mind. Under the category of voluntary churn we recognize two major types of voluntary churn: incidental churn and deliberate churn.
Incidental churn occurs, not because the customers planned on it but because something happened in their lives. For example: change in financial condition churn, change in location churn, etc.
Deliberate churn happens for reasons of technology (customers wanting newer or better technology), eco-nomics (price sensitivity), service quality factors, social or psychological factors, and convenience reasons.
Deliberate churn is the problem that most churn man-agement solutions try to solve.
3.1 Postpaid and Prepaid Churn
When considering Postpaid churn, the deactivation date, i.e. the date that a customer is disconnected from the net-work, is equal to the churn date [14]. After all, this is the actual date a customer stops using the operator’s services.
In contrast to Postpaid segment, Prepaid segment does not imply contractual obligations between users and a tele-com operator, so the very definition of Prepaid churn is not that simple.
In the case of Prepaid churn however, the deactivation date does not necessarily have to match the churn date.
In general, it takes a long period before a Prepaid cus-tomer is actually disconnected from the network. In many cases customers are churned long before they are discon-nected from the network. This is exactly the reason why the deactivation date is not a suitable indicator for churn. Thus, we are interested in a churn definition which indi-cates when a customer has permanently stopped using his Prepaid SIM-card [18].
4 PREDICTING OF PREPAID CHURN IN TELECOMMUNICATION INDUSTRY
Successful detection of potential churners enables com-panies to define activities for their retention. Data Mining enables us to predict behavior of mobile networks users [13],[14],[15].
This example will show a Data Mining application for prediction of Prepaid churn in the telecommunication com-pany HT Mostar (Bosnia & Herzegovina) by using previ-ously defined methodology (see section 2.1).
Data that are going to be analyzed relate to a six-month period (from 1st July 2009 to 1st January 2010).
4.1 Business Goals Definition
As we mentioned earlier, a business goal is to be mea-surable, reachable, realistic and well-timed.
Business goal: To decrease churn rate of Prepaid users by 20% in a three-month time.
What is missing in the definition above to be compre-hensible to everybody without ambiguity is a clear defini-tion of what churn is in a Prepaid segment.
A Prepaid churn user in this example is defined as a user who has neither had any calls or incoming calls during the last three months, nor used any other services (SMS, MMS, mobile internet. . . ), nor any additional payment within these three months.
4.2 Data Mining Goals Definition
One of the greatest risks in the project was definitely mapping of business goals into Data Mining goals. Experts from business and Data Mining domain have to cooperate in defining business and Data Mining project goals.
Failure to properly translate the business problem into a Data Mining problem leads to one of the dangers we are trying to avoid - learning things that are true, but not useful. Data mining goal: To create a model that will predict potential Prepaid churners with 90% accuracy.
4.3 Data Preparation (Data Selection, Cleaning and Transformation)
The data set used throughout this work is from a telecommunication company in Bosnia and Herzegovina (HT Mostar).
HT Mostar company has a DW/BI system implemented in its infrastructure since 2007. Data Warehouse (DW) is organized as a “star-schema” data model (or snowflake-schema” data model when it was necessary), and it con-tains all available data of Postpaid/Prepaid users and ser-vices they used.
ETL procedure enabled data extraction from source sys-tems, their cleaning, transformation and aggregation, as well as data import into DW, so data preparation is con-siderably made shorter and simplified for the Data Mining analysis.
Also, the data warehouse contained aggregated data (on a monthly basis) on services by Prepaid users, which addi-tionally facilitates necessary data preparation.
From DW we extracted data in the period between 1st July 2009 and 1st January 2010.
There are three groups of variables plus target variable that have been combined to create the dataset:
– customer data
– traffic (usage) data (outgoing/incoming) – recharge data
Customer data:
– RATE_PLAN (TARIFF MODEL) – CUSTOMER_MONTH_DURATION Outgoing traffic (usage) data:
– OUTGOING_SMS_NUMBER – ∆OUTGOING_SMS_NUMBER – OUTGOING_CALLS_NUMBER – ∆OUTGOING_CALLS_NUMBER – OUTGOING_CALLS_MINUTES – ∆OUTGOING_CALLS_MINUTES – SERVICE_CALLS_NUMBER – ∆SERVICE_CALLS_NUMBER – COMPETITION_SERVICE_CALLS_NUMBER – ∆COMPETITION_SERVICE_CALLS_NUMBER Incoming traffic (usage) data:
– INCOMING_SMS_NUMBER – ∆INCOMING_SMS_NUMBER – INCOMING_CALLS_NUMBER – ∆INCOMING_CALLS_NUMBER – INCOMING_CALLS_MINUTES – ∆INCOMING_CALLS_MINUTES Recharge data:
– NUMBER_OF_RECHARGES – ∆NUMBER_OF_RECHARGES – TOTAL_RECHARGED_AMOUNT – ∆TOTAL_RECHARGED_AMOUNT
Delta (∆) variables (VAR) relate to the change of a vari-able between the two periods (p1 and p2) according to the following formula:
∆VAR.=VAR.(p2)−VAR.(p1)
VAR.(p1) (1)
where:
p2 = period 2 (October, November and December 2009.)
p1 = period 1 (July, August and September 2009.). E.g. for the variable∆OUTGOING_CALLS_MINUTES(OCM):
∆OCM = OCM(p2)−OCM(p1)
OCM(p1) (2)
where:
OCM = Outgoing_Calls_Minutes
p2 = period 2 (October, November and December 2009.)
p1 = period 1 (July, August and September 2009.) Naturally, the variables indicating changes between the two periods (p1 i p2) are valid only if a condition is met.
CUSTOMER_MONTH_DURATION>= 6
Other variables relate to the period 2 (10th, 11thand 12th
month in 2009). That means that analysis took into con-sideration last three months, i.e. variables relating to the change (∆), and the change within last three months as compared to the previous three month period.
In the data preparing process, most of the time was spent on calculation of variables relating to the change (∆), since these variables are not present in DW.
Target data
The target data for customer is represented by a 0 (FALSE) for non-churner or a 1 (TRUE) for churner. 4.4 Data Modeling
Churn predictive modeling refers to the task of building a model for the target variable (churner or non-churner) as a function of the explanatory variables [2].
Modeling is simply the act of building a model in one situation where you know the answer and then applying it to another situation that you don’t (Fig. 8).
Attr1 Learn Model Apply Model DM Algorithm Model Attr2 Attr3 Target
0 1 ... ... ... ... ... ...
Attr1 Attr2 Attr3 Target ?
... ... ...
Training Set
Validation Set
Fig. 8. Data modeling
Fig. 9. Training and validation set for modeling The most important thing to remember about model building is that it is an iterative process. No single method works best in all cases.
For training and model validation, we used a sample of 3,000 users, out of which 2/3 is training set (2,000 users) and 1/3 the validation set (1,000 users) (Fig. 9).
Users who cannot be churners for any reason were excluded from the sample (test users, employees of HT Mostar).
The training set had 259 churners, and 1,741 non-churners (Fig. 10). The validation set had 123 non-churners and 877 non-churners (Fig. 11).
Fig. 10. Training set for modeling
The predictive power of different Data Mining models (Neural Network, Decision Tree and Logistic Regression) were analyzed and compared.
Fig. 11. Validation set for modeling
We decided to use Open source Data Mining software for analyzing and our choice was Weka. Weka was de-veloped at the University of Waikato in New Zealand, and the name stands for Waikato Environment for Knowledge Analysis. The system is written in Java and distributed un-der the terms of the GNU General Public Licence [2],[20]. It runs on almost any platform and has been tested under Linux, Windows, and Macintosh operating systems.
Evolution of the performance of a prediction model is based on the counts of test records correctly and incorrectly predicted by the model. These counts are tabulated in a table known as a confusion matrix (Table 1).
Table 1. Confusion matrix for a 2-class problem
Confusion matrix is shown for each model. Based on the entries in the confusion matrix we can calculate the total number of correct and incorrect predictions.
Table 2. Confusion matrix (neural network model)
Table 3. Confusion matrix (logistic regression model)
Table 4. Confusion matrix (decision tree model)
4.5 Analysis of Results
Although a confusion matrix provides the information needed to determine how well a prediction model per-forms, summarizing this information with a single num-ber would make it more convenient to compare the per-formance of different models. This can be done using a performance metric such as accuracy and error rate [2].
Accuracy= Number of correct predictions Total number of predictions
Error rate= Number of wrong predictions Total number of predictions Table 5. Comparison of different DM models
Decision tree method proved to be the most successful for concrete application in modeling Prepaid users churn prediction (Table 5).
Decision trees are a Data Mining method aimed at clas-sification of attributes with regard to the set target variable (in this case CHURN).
A record enters the tree at the root node. The root node applies a test to determine which child node the record will encounter next. There are different algorithms for choos-ing the initial test, but the goal is always the same: To choose the test that best discriminates among the target classes. This process is repeated until the record arrives at a leaf node. All the records that end up at a given leaf of the tree are classified the same way. There is a unique path from the root to each leaf. That path is an expression of the rule used to classify the records (churn = TRUE or churn = FALSE) [1].
The main advantage of this method is that it presents its results in the form of easily readable rules that can be of great value, with a possibility of churn prediction for an in-dividual user. Besides, this method can indicate dominant variable.
It is important, though, to stress that variable dominance can be observed in both directions:
– Domination toward churn (user churn) – Domination against churn (user retention) 4.6 Deployment
When defining goals we had a very important and sen-sitive issue of merging business and Data Mining environ-ments (mapping business goals into Data Mining goals). Now we have a similar goal to merge these two environ-ments, only in an opposite direction. It is necessary to transform results from Data Mining environment into busi-ness environment and present them in a more comprehen-sible way.
In this example we created an OLAP cube (by using Microsoft SQL Server Analysis Services 2007) with all re-sults gained from the analysis. Users had direct approach to the cube through Excel 2007 environment.
Based on the data available and identified potential churners, Marketing and Sales decided to undertake reten-tion activities. E.g. an offer to switch to a more convenient tariff model, an account bonus, more favorable price for mobile phone purchase, etc...
Especially important is to undertake activities on reten-tion of profitable Prepaid users (e.g. those with consump-tion of more than 15 EUR).
4.7 Monitoring
Data mining model building is an iterative process that can not be fully automated due to the constant change in business processes and environment.
Model control and maintenance in this example is going to be performed on a monthly basis, when its accuracy will be checked with the new set of data. From the DW data is always extracted for a last six-month period.
According to the needs, this model can be adjusted by e.g. adding new available variables that influence accuracy of the model prediction. It is possible to apply a selected algorithm ( a decision tree), since with a new variable and new set of data some better predictive characteristics might be revealed (neural networks, logistic regression).
Of course that after the first results it is possible to make decisions on adjusting set business and Data Mining goals.
5 FUTURE RESEARCH
Future research will deal with building of the whole sys-tem for prevention of Prepaid churn.
Data Mining model defined and described here for de-tection of potential Prepaid churners is just one part of that system.
Detection model results are to be matched with defined segments of users, and for each segment it is necessary to define appropriate action. This work is with Prepaid users much more complex than in the case of Postpaid users who are mostly bound by their contractual obligations (e.g. for 1 or 2 years), so the most critical points are expire dates of the contracts. Prepaid doesn’t imply contractual obliga-tions which means that users are able to stop using services at any point, without previous notification.
In the Prepaid world it is common for users to have more than one card from different telecom companies. It is then great challenge to detect such users and keep them by ad-ditional cross-sell / up-sell offers within one network and prevent churn in that way.
6 CONCLUSION
This paper emphasizes a necessity for development of Data Mining applications in line with a clearly defined methodological framework.
An understandable development methodology is one of the key parameters for successful modeling of applications for Prepaid users churn prediction in telecommunications, which was proved in the section 4. of this paper.
The main emphasis of this paper was defining of a suc-cessful model for prediction of potential Prepaid churners, in which the most important part was to identify the very set of input variables that were high enough to make the prediction model precise and reliable.
Definition of Prepaid churn and the very modeling of an application is more complex than the same task for Post-paid users. More complexity is brought into modeling by a lower data amount available for Prepaid users, so the vari-ables are often set by using traffic data (calls, SMS, MMS, mobile internet...) and data on additional payments.
A successful model for prediction and prevention of Prepaid churn in telecommunication companies can influ-ence very positively an overall profit of companies, due to the fact that far less money needs to be invested into devel-opment of a predictive Data Mining model and marketing preventive action to retain users, as compared to the possi-ble loss cause by these users churn.
REFERENCES
[1] Michael J. A. Berry, Gordon S. Linoff: „Data Mining Tech-niques: For Marketing, Sales and Customer Relationship Management“, Wiley Publishing, Indidana, 2004.
[2] Ian H. Witten, Eibe Frank: „Data Mining: Practical Ma-chine Learning Tools and Techniques“, Morgan Kaufmann Publishers, San Francisco, 2005.
[3] Paolo Giudici, Silvia Figini: „Applied Data Mining for Business and Industry“, John Wiley & Sons, 2009. [4] David L. Olson, Dursun Delen: „Advanced Data Mining
Techniques“, Springer, 2008.
[5] L. A. Kurgan, P. Musilek: “A survey of Knowledge Dis-covery and Data Mining process models”, The Knowledge Engineering Review, Vol.21, pp.1-24, 2006.
[6] K. Cios, L.A. Kurgan: „Trends in Data Mining and knowledge discovery“– in N.Pal, L.Jain (eds): „Advanced Techniques in Knowledge Discovery and Data Mining“, Springer, pp. 1–26., 2005.
[7] T. Li, D. Ruan: „An extended process model of knowledge discovery in databases“, Journal of Enterprise Information Management, Volume 20, Number 2, pp. 169-177(9), 2007. [8] T. Reinartz: „Stages of the discovery process“ – In W.Klosgen, J.Zytkow (eds): „Handbook of DataMining and Knowledge Discovery“, Oxford University Press, pp. 185–192., 2002.
[9] P. González-Aranda, E. Menasalvas, S. Millán, C.Ruiz, J. Segovia: “Towards a Methodology for Data Mining Project Development: The Importance of Abstraction“, Volume 118/2008, Springer, pp. 165–178., 2008.
[10] M. Van Rooyen: „An evaluation of the utility of two Data Mining project methodologies“– In S.J.Simoff, G.Williams (eds): „Proceedings of the 3rd Australasian Data Mining Conference“, Cairns, Australia, pp. 85-94., 2004.
[11] Wayne W. Eckerson: „Predictive Analytics – Extending the Value of Your Data Warehousing Investment“, TDWI (The Data Warehousing Institute), 2007.
[12] C. Shearer: „The CRISP-DM Model: The new blueprint for Data Mining“, Journal of Data Warehousing, Volume 5, Number 4, Fall 2000, pp.13-22, 2000.
[13] R. Mattison: “The Telco Churn Management Handbook”, XiT Press, Oakwood Hills, Illinois, 2005.
[14] G. Kraljevi´c, I. Krasi´c, S. Gotovac: „Data Mining Tech-niques and Applications in Telecommunication Systems“, MIPRO 2007., BIS – Business Intelligence Systems, pp. 257–261, 2007.
[15] Marko Ferišak: „Intelligent Automata Models in Data Min-ing Processes for Telecommunication Service ForecastMin-ing“, PhD Thesis, FER, Zagreb, 2005.
[16] S.M.H. Jansen: „Customer Segmentation and Customer Profiling for a Mobile Telecommunications Company Based on Usage Behavior“, A Vodafone Case Study July, 2007.
[17] E.W.T. Ngai , Li Xiu , D.C.K. Chau: „Application of Data Mining techniques in customer relationship manage-ment: A literature review and classification“, Expert Sys-tems with Applications: An International Journal, v.36 n.2, pp. 2592–2602, 2009.
[18] A.T.Jahromi, M.Moeini, I.Akbari, A.Akbarzadeh: „A dual-step multi-algorithm approach for churn prediction in Pre-paid telecommunications service providers”, ICIM 2009, Sao Paulo, Brazil, Dec.2009.
[19] CRISP-DM: Cross Industry Standard Process Model for Data Mining (http://www.crisp-dm.org), 2010.
[20] WEKA (Open source, Data Mining software in Java), University of Waikato, New Zealand (http://www.cs.waikato.ac.nz/ml/weka), Weka 3.7.0., 2010.
Goran Kraljevi´creceived B.Sc. degree in 2000. in Computing from the Faculty of Electrical En-gineering and Computing, University of Zagreb, Croatia (FER Zagreb). Since 2003. he has been employed in company HT Mostar. Currently he is Head of Department for Business Information Systems. Since 2004. he has worked as an ex-ternal associate - assistant at the Faculty of Me-chanical Engineering and Computing, University of Mostar (FSR Mostar). His research areas of interest include data mining and knowledge dis-covery, data warehousing and business intelligence systems.
Sven Gotovacreceived B.Sc. degree in 1982. in Electrical Engineering from the Faculty of Elec-trical Engineering, Mechanical Engineering and Naval Architecture University of Split, Croatia. In 1988. he received M.Sc. degree in Computing Science from the Faculty of Electrical Engineer-ing and ComputEngineer-ing, University of Zagreb, Croa-tia. From Technical University Berlin, Germany in 1994. he received Ph.D. degree in Electrical Engineering. Since 1983. he has been employed at the Faculty of Electrical Engineering, Mechan-ical Engineering and Naval Architecture, University of Split, Croatia. Now he is Full Professor, and the head of the Department for Computer Architecture and Operating Systems. His research interest includes em-bedded systems and information system design and analysis.
AUTHORS’ ADDRESSES Goran Kraljevi´c
HT Mostar
Kneza Branimira bb, 88000 Mostar, B&H goran.kraljevic@hteronet.ba
Sven Gotovac
Faculty of Electrical Engineering, Mechanical Engineering and Naval Architecture
Ruera Boškovi´ca bb, 21000 Split, Croatia sven.gotovac@fesb.hr
Received: 2010-07-12 Accepted: 2010-11-13