YSIS TO DEEP SEQUENCING
PORTING FORENSIC DNA ANALYSIS TO DEEP SEQUENCING
Christophe V
FACULTY OF PHARMACEUTICAL SCIENCES
Porting Forensic DNA
Analysis To Deep Sequencing
Van Neste Christophe
Promotor: Prof. D. Deforce
Co-promotor: Prof. W. Van Criekinge Co-promotor: Prof. F. Van Nieuwerburgh
Porting Forensic DNA Analysis To Deep Sequencing
Van Neste CHRISTOPHE
Dissertation presented in fulfillment of the requirements for the degree of Doctor in Pharmaceutical Sciences
Examination committee: Prof. dr. apr. C. Stove, chair Prof. dr. apr. D. Deforce, promotor
Prof. dr. ir. W. Van Criekinge, co-promotor Prof. dr. apr. F. Van Nieuwerburgh, co-promotor Prof. dr. B. Bekaert (KU Leuven)
Prof. dr. E. De Baere (UGent) Prof. dr. ir. T. De Meyer (UGent) Dr. T. Sijen (NFI, Den Haag) N. Oldroyd (Illumina, London)
Alle rechten voorbehouden. Niets uit deze uitgave mag worden vermenigvuldigd en/of openbaar gemaakt worden door middel van druk, fotokopie, microfilm, elektronisch of op welke andere wijze ook zonder voorafgaande schriftelijke toestemming van de uitgever.
All rights reserved. No part of the publication may be reproduced in any form by print, photoprint, microfilm, electronic or any other means without written permission from the publisher.
Dedicated to Anastasiya, Sophia and Elena
Here, in front of you is a work of writing. I am not a writer.
Although I am officially a philosopher and writing and philosophy seem to go hand in hand in history, as a philosopher I would categorize myself more as a Socratic type. The first people I therefore want to thank is anyone who is reading this. Thank you and bear with me. Although some of the paragraphs could potentially have been written better, some of the paragraphs (including some of the ones just mentioned) do contain some interesting points. Nonetheless, I also thank you for reading it critically. Science and philosophy can only go ahead by scrutinizing all our thoughts. A general thank you to the members of my examination committee for their critical suggestions.
My first concrete thanks have to go to my supervisors, Dieter, Wim and Filip. They each played a unique role in the realization of this dissertation. Professor Dieter Deforce, I sincerely thank you for having given me the opportunity to work in your laboratory. You have been the material cause that gave me the possibility to do research in the exciting domain of forensics and without your help there simply would not have been a dissertation. Professor Wim Van Criekinge, a long time ago, in a faculty far far away, you inspired me as a bioinformatician. Little did I know that I would become one myself. Thank you for having been the formal cause in this project. And then there is my efficient cause, professor Filip Van Nieuwerburgh. Sharing the same office, you were the one that kept me going ahead, day to day. I have not counted the number of
PREFACE iii
arguments we had. Sometimes our office sound[ed|s] like the argument clinic, but I sincerely thank you for it. Science cannot go ahead by people thinking exactly the same. And I think we can agree on this, that we both are open-minded enough to change our minds, when the evidence is presented before us.
As my material cause was and is the material cause of many, I now embark on the journey of thanking everyone that I met during my years at LabFBT. Mado, as a scientist, although I am your senior in age, you were definitely an inspiration and full of helpful advice in my first two PhD years. Unfortunately, the only thing that remains of your female touch in the office, is your broken yellow thee pot. Nicky, without being cynical, I have to thank you for not having finished your initial analysis of the 454 data. I hope the endeavors you undertook after LabFBT fared you well, and will continue to do so. Bert, you took over Nicky’s cursed seat and could not dispel it. Nonetheless, in the good year you were working here, we had a blast. I am happy that we kept in touch and are still friends. Sander, you are now sitting in the same seat, I am 99.999% sure that the spell has been lifted and foresee a great academic career if you continue your work exactly so. Yannick, so much weight has fallen off my shoulders when you arrived. All the extra time I could put into my doctorate is definitely thanks to you. Dieter, although I was first skeptical of having a fifth member of the office (oxygen-wise), you are a valued addition, and not afraid to participate to the argument clinic when necessary.
On my journey, I now leave the IT-crowd behind, and go upstairs, to thestrange
world of proteomics. Katleen, I definitely have to start with you. I was only just working here, when you already invited me to your PhD defense and shortly after that your wedding. You are such a warm person. Maarten, you are such a crazy person, lovely. Always fun to hear your travel stories, first going around the world, now more down to earth (“Remy boom vallen”;). Marlies, as Mado’s backup you were often in our office to chit-chat on quality and other items. Thank you for the cheerful distractions. Sandra, your persistence in your project and the effort you put in learning some bioinformatics were very inspiring. Trees, thanks for the discussions on forensics, I hope we will have
many more, as it seems a shared passion. Pieter, it was fun having you as a running partner. Thanks for the philosophical talks. For the record: do not forget, I still owe you a kebab. Liesbeth, always there to lighten up the company with your lovely jokes and laughter. Veerle, thanks for all the old tips and new tricks on finishing a PhD. Bart, thanks for finally having chosen python over R. Except for not having a chair, you are the sixth member of our office. It is always a pleasure seeing you enter, and hearing what new scheme you have come up with. Paulien, you always have a fresh perspective to offer. Ellen, you are a whirlwind of energy. Your enthusiasm is infectious. Shahid, I hope you are doing well in Brussels. Elisabeth, you are an excellent kubb captain. It must be the reason why we are finally winning. Lieselot, for a brief moment I thought you were going to be the new Mado in our office, but understandably you fled away from all the IT jokes. Senne, thanks for introducing me again to the wet lab. I will do my best to guide you further in the dry lab. Yens, it will be funny to see you at the other side of the bar. I think a mustache would fit you when you suit up. Sofie, thanks for being a sometimes fellow commuter. It makes getting home after a late team-building activity so much easier. Laura, after this long paragraph I am speechless, but I was determined to include everyone, even the ones that just started, so thank you and good luck.
Back on the ground floor, I first have to thank Inge, Astrid and Nadine. Your help with organization and administration has been invaluable to me. Thank you Leen for your sunny personality. A special thanks to David and the forensic analysts: Eveli[en|ne], Petra, Sabine, Saskia and Sylvie. You are the intended end-users of much of the work in this dissertation. I hope we can work closer together in the near future, to make a better program for the forensic community. At the university level, my thanks go to the Multidisciplinary Research Partnership ’Bioinformatics: from nucleotides to networks’ for providing funding for my PhD. It also inspired collaborations: Tim, thanks for the adventures in statistics; Klaas and Michiel, thanks for the experience in scrutinizing documentation.
PREFACE v
to thank Cydne. Thank you for your support and always friendly disposition. It gave me the courage to ask about the internship as I figured - worst case scenario - you would have let me known that it was not possible in the nicest of ways. John, thank you for really having made it possible. Mayank, I learned so much from you there, many thanks. The entire BaseSpace team: the kickball breaks were amazing, thanks for including me. Thank you Felix for the talks on statistics. Thanks to anyone I might be forgetting at Illumina.
In the final part of this preface, I like to thank the people who are most important to me personally. Thanks mama and papa, specifically for having tolerated
me to be a student up to the well-rounded age of 33 (a mature Hobbit now). Thanks Karen and Frederik, for your support and encouragement. Danke nana en bompa, om altijd in mij geloofd te hebben. Grazie Margarita e Salvatore, per tutto l’aiuto materiale e spirituale. Спасибо Георгий и Ольга, даже если вы далеко живете, вы всегда в моем сердце.
And finally, thank you Anastasiya. You mean everything to me, I would not have been able to write a single letter without your constant care and love! Ты мой мир, и ты приносишь мне мир. Я тебя люблю! Thank you specifically for the amazing logos and cover design. Also, much more specifically thank you for not giving birth to Elena exactly at the same time that I have to give my public defense. Although, of course, I will not hold it against you, if you must. Thank you for being my close family, together with Sophia and Elena. Sophia, can you say “papa doctor hurray”? Elena, depending on your timing, your father will still be a student or not. . .
Abstract
Forensic DNA profiles of short tandem repeat (STR) loci are currently obtained using PCR followed by capillary electrophoresis (CE). Massively parallel sequencing (MPS) technologies do not rely on size separation and thus relieve the limitations on locus multiplexy. Deep sequencing with MPS creates possibilities within forensics for analyzing degraded samples and mixed samples. Furthermore, in the same analysis single nucleotide polymorphism (SNP) markers can be included, which can generate phenotypic or ancestry leads for forensic investigators.
Data analysis of raw sequencer reads, resulting in a reliable and usable forensic human identification report is still in early development. The aim of the doctoral research was to develop a program for forensic DNA data analysis. The main results are the data analysis framework MyFLq (My Forensic Loci queries) and nomenclature service FLAD (Forensic Loci Allele Database). MyFLq and FLAD can be used together in a forensic workflow that has backward compatibility with CE. To my knowledge, this is the first open-source and complete solution for forensic MPS raw data analysis.
Beknopte samenvatting
Forensische DNA-profielen van short tandem repeat (STR) loci worden momenteel verkregen met behulp van PCR gevolgd door capillaire elektroforese (CE). Technologieën die gebruik maken van massaal parallel sequeneren (MPS) zijn niet afhankelijk van de grootte voor scheiding en verlichten dus de beperking op het aantal loci dat in één analyse bestudeerd kan worden. Diep sequeneren met MPS creëert mogelijkheden binnen het forensische domein voor het analyseren van gedegradeerde monsters en mengmonsters. In dezelfde analyse kunnen ook singulier nucleotide polymorfisme (SNP) merkers worden opgenomen, die fenotypische of genealogische indicaties kunnen genereren voor forensische onderzoekers.
Gegevensanalyse van ruwe gelezen sequenties, resulterend in een betrouwbaar en bruikbaar forensisch identificatie verslag is nog in volle ontwikkeling. Het doel van het promotieonderzoek was om een programma te ontwikkelen voor forensische DNA-analyse. De belangrijkste resultaten zijn het data-analyse pakket MyFLq (Mijn Forensische Loci queesten) en nomenclatuur dienst FLAD (Forensische Loci en Allelen Database). MyFLq en FLAD kunnen samen worden gebruikt in een forensische analyse die compatibel is met CE. Voor zover bekend, is dit de eerste open-bron en complete oplossing voor forensische MPS ruwe data-analyse.
Abbreviations
A adenine
bp base pair(s)
C cytosine
CODIS combined DNA index system CPI combined probability of inclusion
ddNTP dideoxyribonucleotide triphosphate DIP deletion insertion polymorphism DNA deoxyribonucleic acid
dNTP deoxyribonucleotide
ESS European standard set
EVC externally visible characteristic
FFT Fast Fourier Transform FLAD Forensic Loci Allele Database
FSIG Forensic Science International-Genetics
G guanine
HVI mitochondrial hyper-variable region I HVII mitochondrial hyper-variable region II
INDEL insertion-deletion
ISFET ion-sensitive field-effect transistor
ISFG International Society of Forensic Genetics
kb kilo bases
LabFBT Laboratory of Pharmaceutical Biotechnology LR likelihood ratio
MPS massively parallel sequencing MyFLq My Forensic Loci queries
NDNAD United Kingdom national DNA database NW Needleman-Wunsch algorithm
OFDAT Open Forensic DNA Analysis Toolbox
RFLP restriction fragment length polymorphism RFU relative fluorescence units
RMNE random man not excluded
SGS second generation sequencing SNP single nucleotide polymorphism STR short tandem repeat
SW Smith-Waterman algorithm
ABBREVIATIONS xiii
Contents
Abstract vii
Contents xv
List of Figures xxi
List of Tables xxv
List of Listings xxvi
1 Introduction 1
1.1 Forensic DNA analysis . . . 1
1.1.1 Brief historical overview . . . 1
1.1.2 DNA typing . . . 2
1.1.3 Beyond STRs . . . 7
1.2 DNA analysis workflow . . . 8
1.2.1 Sample collection . . . 9
1.2.2 PCR amplification . . . 9
1.2.3 Capillary electrophoresis . . . 10
1.2.4 Processing the data . . . 12
1.2.5 Forensic conclusion . . . 13
1.3 Sequencing technologies . . . 14
1.3.1 Sanger sequencing . . . 14
1.3.2 Massively parallel sequencing . . . 16
1.3.3 Nanopore sequencing . . . 20
1.4 MPS data processing . . . 20
1.4.1 Variant analysis software . . . 20
1.4.2 Alignment algorithms . . . 22
1.5 DNA databases . . . 23
1.6 Legal and ethical considerations . . . 24
1.6.1 Belgian legal context . . . 24
1.6.2 Who and what is suspect? . . . 26
1.6.3 Balancing false positives and negatives . . . 27
1.6.4 The CSI effect . . . 28
2 Aim and outline 29 3 Exploring forensic DNA analysis using MPS 31 Abstract . . . 32
3.1 Introduction . . . 32
CONTENTS xvii
3.1.2 Experimental setup . . . 34
3.1.3 Data analysis . . . 35
3.2 Materials and methods . . . 36
3.2.1 Samples . . . 36
3.2.2 Electrophoresis and SGS . . . 37
3.2.3 Theoretical profile . . . 38
3.2.4 Data analysis . . . 38
3.3 Results . . . 41
3.3.1 General properties of the GS FLX dataset . . . 41
3.3.2 Single contributor sample . . . 42
3.3.3 Mixed samples . . . 43 3.4 Discussion . . . 47 3.5 Conclusion . . . 52 4 My-Forensic-Loci-queries 53 Abstract . . . 54 4.1 Introduction . . . 55
4.2 Materials and Methods . . . 57
4.2.1 Sample Preparation and Processing Using Illumina Chemistry . . . 57
4.2.2 MiSeq data Analysis . . . 58
4.3 Results . . . 61
4.3.2 General properties of the Illumina dataset . . . 62
4.3.3 STR allele calls in four and five person DNA mixtures . 63
4.3.4 Progressive abundance threshold . . . 64
4.3.5 Locus quality analysis . . . 65
4.4 Discussion . . . 67
4.4.1 Framework performance . . . 67
4.4.2 Accuracy and detection of minor contributors . . . 67
4.4.3 Loci performance . . . 68
4.4.4 Dynamic flank calculation . . . 69
4.5 Conclusion . . . 70
5 User-friendly implementation of MyFLq for forensic analysts 71
Abstract . . . 72
5.1 Introduction . . . 72
5.2 Materials and Methods . . . 73
5.2.1 Samples . . . 75
5.2.2 Launching MyFLq . . . 75
5.3 Results . . . 78
5.3.1 Initial sequence-based result display . . . 78
5.3.2 Detailed allele candidate information . . . 79
5.3.3 Allele candidates proportionally sorted according to length 82
5.3.4 Final profile . . . 83
CONTENTS xix
5.5 Conclusion . . . 85
6 FLAD: Forensic Loci Allele Database 87
Abstract . . . 88 6.1 Introduction . . . 88 6.2 Methods . . . 90 6.3 Results . . . 90 6.4 Discussion . . . 91 6.5 Conclusion . . . 93 7 General discussion 95 7.1 In the beginning . . . 95 7.2 Algorithms . . . 96 7.2.1 Assignment . . . 97 7.2.2 Determining flanks . . . 100 7.2.3 Typing algorithms . . . 103 7.2.4 Nomenclature . . . 108 7.2.5 Configuration files . . . 110 7.3 Race to market . . . 112 7.4 Future research . . . 115 7.4.1 Other technologies . . . 115 7.4.2 Validation . . . 117 7.4.3 Database searches . . . 117
7.4.4 Benchmarks and a common platform . . . 118
7.4.5 FLAD: spread the name . . . 118
Conclusion 121
A Samenvatting 125
B First paper supplementary material 129
C MyFLq source code 135
D Application logos 145
Bibliography 147
Curriculum vitae 157
List of Figures
1.1 The chemical structure of DNA . . . 3
1.2 RFLP analysis of VNTR locus D1S80 . . . 5
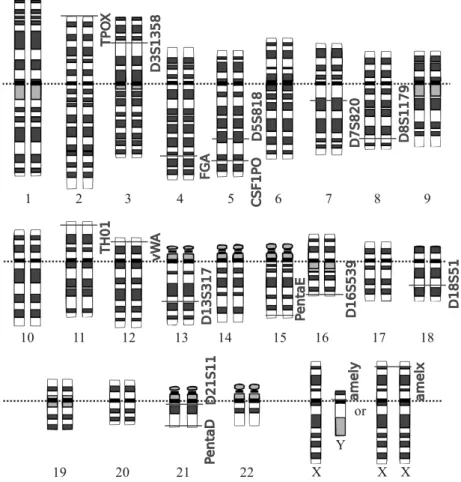
1.3 Important forensic loci in the human genome . . . 6
1.4 ABI Genetic Analyzer 3500xL . . . 11
1.5 Electropherogram profile example . . . 12
1.6 Sanger sequencing . . . 15
1.7 MPS sequencing devices . . . 17
1.8 Comparison of homopolymer stretch accuracy . . . 19
1.9 Nanopore sequencing . . . 21
1.10 Needleman-Wunsch pairwise sequence alignment . . . 23
3.1 Pipeline . . . 39
3.2 STR profiles for the single contributor sample . . . 43
3.3 STR profiles for Mixture 1 . . . 45
3.4 STR profiles for Mixture 2 . . . 46
3.5 Full sequence STR profiles for single contributor. . . 49
4.1 Flanks and region of interest in the reference allele database . . 60
4.2 Histogram of the full-sequence abundances . . . 62
4.3 Sample 1 profile . . . 63
4.4 Sample 2 profile . . . 64
4.5 Sample 3 profile . . . 64
4.6 Sample 4 profile . . . 64
4.7 Percentage of error free ROI . . . 65
4.8 Proportion of clean flanks . . . 66
5.1 STR data processing. . . 74
5.2 Primary analysis settings . . . 76
5.3 Initial display of analysis result. . . 78
5.4 Alleles proportionally sorted and stacked according to length. . 79
5.5 Information blocks for true D8S1179 alleles . . . 81
5.6 Unknown Penta E allele . . . 82
5.7 Final profile for sample 9947A_S1 . . . 84
6.1 FLAD service website . . . 91
7.1 LobSTR repeat sensing . . . 99
7.2 Top-down versus bottom-up STR read analysis . . . 99
LIST OF FIGURES xxiii
7.4 K-mer versus alignment flankout . . . 102
7.5 Benchmark of k-mer and alignment flankout . . . 102
7.6 MyFLq sequence relations with transform-codes . . . 105
7.7 Population allele frequencies . . . 111
7.8 Match probabilities STR multiplex and AmpliSeq Identity panel 113
7.9 ForenSeq result . . . 114
7.10 The OFDAT website . . . 119
D.1 MyFLq logo . . . 145
List of Tables
1.1 Genotypes for a locus with three alleles . . . 4
1.2 Possible issues in the forensic workflow . . . 13
1.3 Considered MPS sequencing technologies . . . 16
1.4 Loci core sets . . . 25
3.1 Composition of the 3 experiment samples . . . 37
3.2 Number of wells and reads in the Roche GS FLX dataset . . . 42
3.3 Number of reads in forward and reversed direction . . . 42
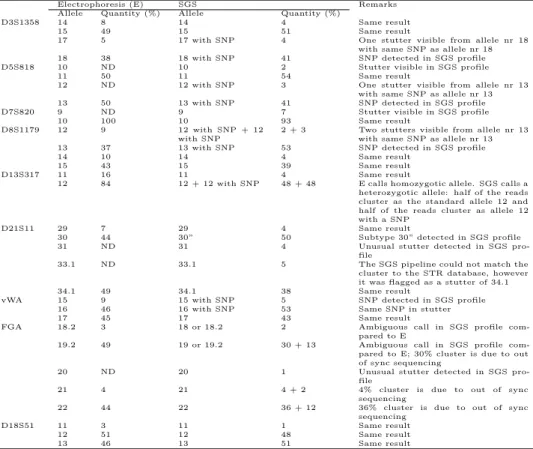
3.4 CE and SGS STR comparison single contributor . . . 44
3.5 CE and SGS STR comparison Mixture 1 . . . 45
3.6 CE and SGS STR comparison Mixture 2 . . . 46
4.1 DNA composition of samples . . . 57
4.2 General Illumina samples characteristics . . . 63
4.3 MPS signal percentage of theoretical abundance . . . 66
5.1 Profile of DNA standard 9947A . . . 76
5.2 General analysis launch options . . . 77
6.1 FLAD service API . . . 91
7.1 Comparison of STR analysis tools . . . 97
7.2 FLAD ID examples with transform-codes . . . 109
7.3 FLAD versus Mutalyzer . . . 110
List of Listings
7.1 Homopolymer compression in STRbySGS . . . 107
7.2 Homopolymer compression in MyFLq . . . 107
B.1 STRbySGS script for assigning reads to loci . . . 129
B.2 STRbySGS result for the single contributor sample . . . 131
C.1 MyFLq framework interface . . . 135
C.2 Flexible flanking . . . 138
C.3 Alignment algorithm . . . 140
Chapter 1
Introduction
There is nothing more important than human life; there is no punishment greater than death. A murderer gives life for life: the law shows no mercy. But to obviate any regrets which might be occasioned by a wrong infliction of such punishment, the validity of a confession (...) and the sentence passed are made to depend on a satisfactory examination.
The washing away of wrongs - Song Ci (1186-1249)
1.1
Forensic DNA analysis
1.1.1
Brief historical overview
The word “forensics” comes from the Latin forensis, which in turn means pertaining to the forum. The Roman forum or court was of course the place of legal trials. As such, the current meaning of for example “forensic science” has not drifted far away: the application of scientific knowledge and methodology to
legal problems and criminal investigations. Forensic DNA analysis particularly has proven itself valuable for establishing guilt or innocence in legal proceedings. It is also applied to find missing persons, to identify the different individuals in mass victim disasters, and, to determine parentage.
1.1.2
DNA typing
With forensic DNA analysis, the DNA profile is determined for a sample or an individual. This is also called DNAtyping orfingerprinting. The analysis types the DNA at different places - called loci - scattered throughout the sample genome. The genome of an individual is its combined genetic material. For a human, it comprises the 23 chromosome pairs and the circular DNA-molecule found within the mitochondria of human cells. Each DNA molecule consists of two complementary strands that are built up out of 4 molecular building blocks known as bases or nucleotides: adenine (A), cytosine (C), thymine (T), and guanine (G). The genome comprises around 3 billion pairs of these bases. Figure 1.1 shows the structure of DNA and how the 4 blocks are combined together to form DNA.
Averagely the genome between two random human individuals is very similar. For two random humans, 99.9% of their nucleotides will be identical [37]. However, some regions in the genome tend to have more variation than others. The former - with few variations - are called conservative regions, the latter polymorphic. A polymorphic region is a good marker for determining identity, as there is more chance that different persons will have different variants for that region. Variants of the same region or locus are called alleles. Except for the mitochondria and some loci on the sex chromosomes, a person will have two alleles at a certain locus. The genotype of a person for that locus is the combination of his/her two alleles.
Table 1.1 shows the possible genotypes and their prevalence for a locus with three known alleles A, B, and, C, with the following assumed prevalence in the population, 20%, 30%, and, 50%. In this example, 12% of the population
FORENSIC DNA ANALYSIS 3
Figure 1.1: The chemical structure of DNA. © Madeleine Price Ball/Wikimedia Commons/CC0
is expected to have the genotype AB. Consequently if this genotype would be present in a crime scene sample, a random person would still have a 12% chance of having an identically matching genotype. Wrongfully convicting 12% of the accused is of course not acceptable. However, when combining several independent loci, it is possible to multiply the matching probabilities of the individual locus genotypes. This combined matching probability is called the
combined probability of inclusion (CPI) orrandom man not excluded (RMNE) value.
Choosing sufficient loci to combine will create an average RMNE value as low as desired, for instance lower than one on the population size of the world. This would make the matching probability acceptably unique, with the exception of identical twins. Two random persons can still have the same DNA profile, but with a very low probability.
Table 1.1: Genotypes for a locus with three alleles Genotype Prevalence AA 4% AB 12% AC 20% BB 9% BC 30% CC 25% Total: 100%
There are two important assumptions about the previous paragraph to note. 1) It is necessary to choose independent loci, which means that they are inherited independently. Two loci that do not fulfill that requirement will have conditional probabilities. Take for example a locus 1 with alleles A,B, and C, and a locus 2 with alleles D, E, and F. If locus 1 and 2 are physically closely linked then the probability of a person having allele D, would depend on the fact whether this person also has allele A, B or C. In this case it is not possible to simply multiply the individual probabilities to calculate the general matching probability. Loci that reside on different chromosomes can safely be assumed to be independent. If they are on the same chromosome, the further they are apart the more independent they will be. 2) The second assumption is that random people are being compared. Relatives are not random people, and matching probabilities between persons that share a blood tie will always be higher than with a random person.
The first markers used for DNA typing were variable number of tandem repeat (VNTR) orminisatelliteloci, which were discovered by Alec Jeffreys in 1985 [36]. Any DNA sequence that repeats itself over a longer stretch within the genome is a VNTR if there are several alleles for that locus with a different number of repeats of that sequence. Initially they were analyzed with restriction fragment length polymorphism (RFLP) analysis, which isolates the sequence repeat pattern by cutting in the flanks of the VNTR locus with restriction enzymes and separates the fragments based on length. Figure 1.2 shows an RFLP analysis on the VNTR locus D1S80. The amount of DNA needed for this technique is
FORENSIC DNA ANALYSIS 5
Figure 1.2: RFLP analysis of VNTR locus D1S80. The allelic length variation can be seen among 6 individuals.
© User:PaleWhaleGail/Wikimedia Commons/CC-BY-SA-3.0
quite substantial, and crime scene samples are usually not very abundant in DNA. The polymerase chain reaction (PCR), which was also first published in 1985 [59], allows amplifying the DNA of a specific location in the genome. Amplifying the specific regions also alleviates the need to further isolate the fragments.
In the early 1990’s it was established that the best fingerprinting results were obtained with very short VNTR’s, ideally with a repeat sequence of only 4 or 5 base pairs (bp). Any VNTR with a repeat sequence shorter than 8 bp is now known as a short tandem repeat (STR) ormicrosatellite[12]. STRs are more easily amplified by PCR than VNTR’s with a longer repeat sequence. Because of the shorter repeat sequence the overall sequence tends to be shorter, which is also beneficial when analyzing degraded DNA. One STR or VNTR locus is never enough to have a reasonably unique matching probability, as clarified above. Currently, forensic laboratories will analyze between 10 to 20 STR loci when determining a profile. All loci that are referenced in this thesis are shown on a map of the human genome in Figure 1.3. Governments and international institutions sometimes require a minimal set of common loci that need to be analyzed in order to compare analyses between laboratories. This is discussed in Section 1.5 on DNA databases.
v W A a m e lx a m e ly C S F1 P O D 3 S 1 3 5 8 D 5 S 8 1 8 D 7 S 8 2 0 D 8 S 1 1 7 9 D 1 3 S 3 1 7 D 1 6 S 5 3 9 D 1 8 S 5 1 D 2 1 S 1 1 FG A Pe n ta D Pe n ta E T H 0 1 T P O X
FORENSIC DNA ANALYSIS 7
1.1.3
Beyond STRs
The advantage of STR’s is that the different alleles for an STR locus can be identified easily by separating the DNA fragments based on their length. There are other types of polymorphisms that do not have alleles with different sizes. The most common of them are single nucleotide polymorphisms (SNP). A SNP locus usually only has two alleles within the population that differ in a single nucleotide position.
Advancing knowledge in human SNP markers, generated by projects such as the International HapMap Project [21], raised the question within the forensic DNA typing community if SNP markers have the potential to replace the currently used STR loci [8, 72, 73].
Apart from the different DNA sequence nature of STR and SNP polymorphisms, they differ in some other characteristics as well. The occurrence for STRs is about 1 in every 15 kb, and for SNPs 1 in every 1 kb [12]. SNPs are therefore much more frequent in the genome, but due to their usual bi-allelic nature, they are less informative. However, their mutation rate is also much lower: ≈1 in 100 000 000 for SNPs and≈1 in 1000 for STRs [12]. This makes them more suitable to assess ancestry than forensic STR loci, which are not very useful for ancestry inference [40]. Furthermore, SNPs are also much more frequent in coding regions, and some SNPs can serve as a direct phenotypic marker. STRs are usually not found in coding regions, and the forensic STR loci in use have in fact specifically been chosen not to correlate with phenotypic characteristics.
Ideally it seems STRs and SNPs should be used together. STRs to establish identity and SNPs for ancestry and other phenotype characteristics. Currently most forensic STR analyses already include one phenotype marker: amelogenin. This locus is situated on the X and Y chromosomes. The X chromosome allele has a 6 bp deletion within intron 1 of the amelogenin gene compared to the Y allele [65]. It is used as a sex marker which is useful to investigate whether a sample originates from a male or a female. Amelogenin is technically not a SNP but an INDEL (insertion-deletion) or DIP (deletion insertion polymorphism).
This is precisely the reason why this locus could be included in the current STR analyses as its alleles can be identified in the same length-based workflow used for the STR loci.
Because SNPs inherently have the same length, the length-based systems for STRs and DIPs cannot be used. SNP alleles can be identified by sequencing or sequence hybridization assays. Forensic laboratories do already sequence samples for certain applications. Samples can be in such a degraded state that they do not lead to a useful STR profile. In those cases, the mitochondrial DNA can be analyzed. Each human cell contains several hundred mitochondria. Consequentially, there is much more mitochondrial DNA available to analyze than nuclear DNA which makes a successful analysis more likely in case of degraded or sparse DNA. Although the mitochondrial genome contains around 16570 bp, mitochondrial DNA profiles are currently based on a 1122 bp region. This region does not code for any gene products and is therefore also known as the “non-coding” region. Precisely because it does not code for specific gene products, there is more polymorphism in this region between individuals. Forensic laboratories will usually sequence two hyper-variable sub-regions of the non-coding region: hyper-variable region I (HVI) and II (HVII).
1.2
DNA analysis workflow
DNA profiles can only be meaningful as evidence in court, if they have been obtained with a strict scientific, and general accepted procedure. Samples collected from a crime scene must be handled carefully. At any step, contaminating DNA could be introduced, or if improperly stored, the DNA of the sample could be (further) degraded. In both cases the evidential power would decrease. Forensic laboratories need to validate all steps for determining DNA profiles. They need to have quality assurance measures in place and participate in accreditation programs to demonstrate that they obtain valid results.
DNA ANALYSIS WORKFLOW 9
1.2.1
Sample collection
There are two basic types of samples that forensic laboratories analyze: unknown evidence samples and known reference samples. The sampling procedure for the latter is straightforward. Usually a swab, which is a small piece of cotton on the end of a short stick, will be rubbed against the inner cheek of a known person. For unknown samples, e.g. at a crime scene, there can be different types of objects of which the forensic investigators want to discover if these are of human origin, what tissue the sample originates from (blood, saliva or semen), and finally if it results in a useful DNA profile. The initial tests for species and tissue origin are part of the sample characterization.
The DNA then needs to be extracted, both for known and unknown samples. Most laboratories will then quantify the extracted DNA, though that is not strictly necessary. In our laboratory (LabFBT), DNA quantification prior to PCR amplification is not a standard procedure. Usually the data analysis will indicate whether there was too much or not enough DNA for a good analysis, and appropriate actions can be performed accordingly. In the case of mitochondrial profiles, DNA is also not quantified before amplification, but measured after amplification.
1.2.2
PCR amplification
Polymerase chain reaction allows minute amounts of DNA to be amplified to measurable quantities. It is an enzymatic process that is able to copy specific DNA regions exponentially. Enzymes that enable this process are called DNA polymerases. At LabFBT the Hotstar Taq DNA polymerase is used. This polymerase has an initial heat activation step. After the activation step a sample is cycled through 34 cycles: 1 step at 94 °C to denature the DNA, then at 59 °C for annealing and 72 °C for the elongation step in which the DNA fragments actually get copied.
polymerases available [63, 29]. Scientists try to make the polymerases as fast and efficient as possible. However, the price for speed and efficiency is accuracy. Taq
DNA polymerase lacks an exonucleolytic editing activity and is therefore much more error-prone than human DNA polymerases. The error rate per nucleotide synthesized is between 10-5 to 10-4[74]. Most errors are base substitutions and
most sequences containing errors therefore still have the same length. However, theTaq DNA polymerase is also known to make a systematic INDEL error in the case of STR loci. With a repetitive sequence being amplified, the polymerase can stutter over one of the repetitions and the copy will then be one repeat unit smaller. Most STR loci that are used in commercial kits have a repeat sequence period of four and a stutter of around 10%.
Crime scene samples can contain very low amounts of DNA, or have a contributor with low DNA amounts. In these cases, there can be significant variation in the amplification of different alleles. An optimal PCR reaction will start with around 1 ng of DNA, which is approximately 150 copies per allele [12]. When only a few DNA molecules are present for every allele, allelic dropout could occur purely by chance. Furthermore, two alleles could have a high quantitative imbalance in case of a heterozygous individual. Different replicates of low DNA amount samples can therefore give different results.
1.2.3
Capillary electrophoresis
Finally, after the amplification the different fragments need to be detected. Capillary electrophoresis (CE) is still the gold standard in forensics today. It separates the fragments based on their length and detects them by means of fluorescent markers that were attached to the primers used in the PCR reaction. The same machine can also be used for Sanger sequencing, which is useful when the mitochondrial profile needs to be determined. Figure 1.4 shows the ABI Genetic Analyzer 3500xL, which is currently used in LabFBT.
Smaller DNA fragments move faster through the gel-filled capillary than longer fragments. When a fragment passes the detector its fluorescence is measured.
DNA ANALYSIS WORKFLOW 11
Figure 1.4: ABI Genetic Analyzer 3500xL. Common instrument for CE analysis [44].
The intensity of the signal is proportional to the amount of DNA molecules of that size present. If the intensity of a certain fluorescent dye gets too high, it can flow over in the signal of a neighboring dye. This process is called spectral bleeding. It can make the analysis more difficult to interpret if there are also DNA molecules present of the same size with a different dye. In general there is always noise on the fluorescence signal, making it difficult to determine exact quantities.
For every analysis run, an internal size standard is added. In this standard there are fragments of known size. Environmental conditions, such as temperature, can impact the speed with which the DNA fragments move through the capillary. With the internal standard the machine can be calibrated for every sample. Allelic ladders are also analyzed regularly. They contain a mixture of common alleles and are analyzed with the internal standard to determine the size of these population alleles. Sample alleles sized with the internal standard can then be binned with their allelic ladder counterparts.
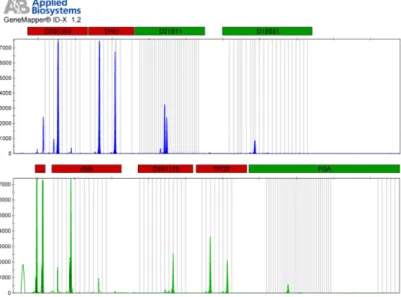
Figure 1.5: Electropherogram profile example with 8 STR loci and amelogenin.
1.2.4
Processing the data
The CE result is an electropherogram, as displayed in Figure 1.5. It shows the intensities for the dyes used in the analysis with relative fluorescence units (RFU) on the Y-axis. A DNA fragment with a high abundance should have a higher peak than a lower abundant fragment. If a DNA fragment has a very low abundance, it can be difficult to distinguish it from signal noise or other technical artifacts.
The X-axis correlates to the size of the fragments. It is the time it took a DNA fragment to pass through the capillary and reach the detection cell. The allelic ladder is used to calibrate the time measurements with which the length of the fragments is estimated in bp. The standard error on the size estimate is around 0.5 bp [12]. Software that analyzes electropherograms usually requires an allelic ladder data file, an STR kit file containing bins for the allele repeat number for each STR locus and panels that define the STR loci present in the kit. All this information together transforms the DNA size information from the sample
DNA ANALYSIS WORKFLOW 13
data into STR allele repeat numbers for each observed peak [13]. The list of STR allele repeat numbers approved by a forensic analyst constitutes the DNA profile of the sample.
1.2.5
Forensic conclusion
When the DNA profile has been determined, it can be compared to other profiles. For example, if there is a crime scene sample it can be compared to the DNA profile of a suspect. If all the alleles of the suspect are within the crime scene DNA profile, the suspect is considered included in the crime scene profile. Because crime scene samples are unique and subject to errors at different points in the workflow (see Table 1.2), suspects cannot be included or excluded with 100% certainty. If, for example, the crime scene sample was in a degraded state, the result of matching to a suspect could be inconclusive if a few of the suspects alleles could not be detected due to the degradation (provided that he/she really contributed to the sample). This is called allelic dropout. The probability of dropout can be considered in the statistical analysis to include or exclude the suspect. However, if there are no indications for dropout and not all the suspect alleles are present the suspect can be excluded from the crime scene sample.
Table 1.2: Possible issues in the forensic workflow
Step Issues
DNA sample collection Contamination, degradation PCR amplification PCR sequence errors
Drop out due to primer mismatch Multiplexing issues
Stochastic effect Capillary electrophoresis Signal noise
Spectral bleeding Limited number of dyes
1.3
Sequencing technologies
In the previous sections, the current golden standard workflow was described for forensics. Except for mitochondrial profiling, it is not necessary to know the exact DNA sequences to determine an STR profile, as that only requires detecting length differences of the alleles. However, as Table 1.2 illustrates, there are several issues with this workflow. Some of them would benefit from having full sequence data. The main advantages can be summarized as follows:
• There is no need to mark loci with dyes such as in CE, because the sequence itself indicates in a proper design to which locus it belongs. Consequentially there is no limit to the amount of loci that can be combined in a profile, other than multiplexing limitations in the PCR step.
• Same-sized alleles with a different sequence can be detected, increasing the uniqueness of profiles and the potential evidential value of crime scene samples.
• Potential errors can be investigated by taking account of sequence specific errors. There is no general signal noise.
Of course, there are also problems with sequencing, as with any technology. In the following sections the sequencing technologies relevant for this dissertation are briefly presented, with emphasis on their potential benefits and pitfalls for application in forensics.
1.3.1
Sanger sequencing
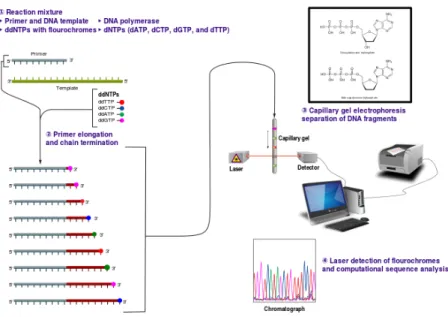
Sanger sequencing was the first widely applicable form of DNA/RNA sequencing [60]. Dideoxyribonucleotide triphosphates (ddNTPs) are added to the PCR mix together with normal deoxyribonucleotides (dNTPs) and incorporated during the amplification cycles. A ddNTP does not have a hydroxyl
SEQUENCING TECHNOLOGIES 15
Figure 1.6: Sanger sequencing.
© User:Estevezj/Wikimedia Commons/CC-BY-SA-3.0
group at the 3’-end necessary for elongation. Consequently, When a ddNTP is incorporated in a DNA sequence, the sequence stops there. The result of a PCR with a certain percentage of ddNTPs, is a range of sequences with different lengths, depending on where the ddNTP was incorporated. When the ddNTPs are linked to fluorochromes they can be detected similarly to the STR fragments with standard CE equipment. The fluorochrome of each fragment will indicate the base at the position in the sequence equaling the length of the fragment. Figure 1.6 gives an overview.
The major disadvantage of Sanger sequencing is that it is very slow and not highly parallelizable. A second disadvantage is that different alleles cannot be easily detected. In the case of SNP alleles for a heterozygous sample, at the SNP position two fluorochromes will be present in the fragment that determines that base in the sequence. In most cases, this is interpretable as a SNP event and both allele sequences can be determined. However, for INDELs the resulting
signal becomes uninterpretable, as all fragments beyond this point will be shifted in length between the two alleles. Such heterozygous alleles can be separated by cloning [15], but this would be too laborious for routine use in forensics.
Currently Sanger sequencing is applied in forensics for analysis of the mitochondrial DNA. When massively parallel sequencing technologies will be used in forensics, it will be possible to analyze the STR and mitochondrial DNA analysis on the same platform. At that point Sanger sequencing will no longer be necessary for forensics, except for initial validation of the new systems.
1.3.2
Massively parallel sequencing
As indicated in the previous section, the main disadvantage of Sanger sequencing is its low throughput and time-consuming nature. Massively parallel sequencing (MPS) technologies remedy that by parallelizing the sequencing reactions and
using different detection schemes.
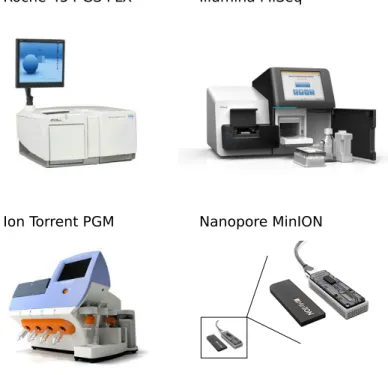
There are many sequencing technologies in use, and several on the horizon. Only the MPS technologies that have been tested for forensic DNA analysis will be discussed. Table 1.3 lists the different technologies and companies that commercialize them. Figure 1.7 shows a device as example for each technology.
Table 1.3: Considered MPS sequencing technologies
Sequencing technology Company Release year
Pyrosequencing 454 Life Sciences 2005
Ion semiconductor sequencing Ion Torrent Systems 2010
Terminated-dye sequencing Illumina 2006
Nanopore sequencing Oxford Nanopore 2014
Pyrosequencing
Pyrosequencing is biochemically very similar to Sanger sequencing, except that it uses normal nucleotides instead of ddNTPs. For the detection, it analyses the amount of pyrophosphates released when dNTPs are incorporated. The released
SEQUENCING TECHNOLOGIES 17
Roche 454 GS FLX Illumina MiSeq
Ion Torrent PGM Nanopore MinION
Figure 1.7: MPS sequencing devices
pyrophosphates activate luciferase, which upon activation emits visible light. In a pyrosequencing reaction the different dNTPs (A,C,T,G) are cycled. In any cycle only one specific dNTP is present, implying that all emitted light in the cycle corresponds to that dNTP. Reading the sequences is then accomplished by detecting the different amounts of light in the different dNTP cycles.
By performing the pyrosequencing reactions in a micro- or picotiter plate, it is possible to sequence many DNA molecules at the same time and detect the light separately in the different plate wells. Its main disadvantage is that homopolymer nucleotide stretches are sequenced with a high error rate. The amount of light emitted in pyrosequencing is not linear to the amount of identical consecutive bases. Ideally it approximates linearity up to 8 bases [46]. Nonetheless, even stretches of 4 bases will already contain around 10% deletion errors, going to 20% for stretches of 7 bases [45].
Ion semiconductor sequencing
Instead of detecting pyrophosphate as in pyrosequencing, ion semiconductor sequencing detects the hydrogen ions that are released when a nucleotide is built into the complementary strand. The hydrogen ions increase the pH which is detected by an ion-sensitive field-effect transistor (ISFET). Homopolymer stretches release a corresponding number of ions and longer stretches therefore generate a higher pH and electronic signal. However, as for pyrosequencing, this is not a linear relationship and long homopolymer stretches have high error rates. Figure 1.8 compares the sequencing error for homopolymers between pyrosequencing and semiconductor sequencing, showing that the latter has even higher homopolymer error rates than pyrosequencing.
Terminated-dye sequencing
Similar as the previous two technologies, terminated-dye sequencing uses cycles to determine the different bases in the DNA molecule. Unlike the previous technologies, it adds all four nucleotides at the same time instead of a single type nucleotide. The four nucleotides are linked with reversible dye-terminators. When they are added, only one nucleotide can be incorporated into the complementary strand because of the reversible termination. Subsequently a single camera can analyze the dyes to determine which bases were incorporated, and finally the dye-terminators can be removed.
Because the four nucleotides are added at the same time, there is a natural competition between them for strand incorporation. Also because only a single nucleotide gets incorporated per cycle, there is no significant sequencing dependent homopolymer miscalling. Homopolymer sequencing errors do occur but have only been detected for homopolymer stretches longer than 20 bases[54]. There are also other sequence-specific errors: the motif GGC has been shown to generate strand-specific errors if followed by GC-rich motifs[54].
SEQUENCING TECHNOLOGIES 19
454 GS Junior 1+2 (deletions)
Read position
Frequency of deletion errors
0.0 0.2 0.4 0.6 0.8 1.0 0 20 40 60 80 100 454 GS Junior 1+2 (insertions) Read position Frequency of inser tion error 0.0 0.2 0.4 0.6 0.8 1.0 0 20 40 60 80 100
Ion Torrent PGM 1+2 (deletions)
Read position
Frequency of deletion errors
0.0 0.2 0.4 0.6 0.8 1.0 0 20 40 60 80 100
Ion Torrent PGM 1+2 (insertions)
Read position Frequency of inser tion error 0.0 0.2 0.4 0.6 0.8 1.0 0 20 40 60 80 100 Homopolymer Length 1 2 3 4 5 6 7 >= 8
Figure 1.8: Comparison of homopolymer stretch accuracy between pyrosequencing (454 GS Junior) and semiconductor sequencing (Ion Torrent). Charts show the frequency of erroneous insertions or deletions associated with homopolymeric stretches of lengths 1-7, and 8 or greater [45].
1.3.3
Nanopore sequencing
All previously discussed technologies are categorized as sequencing by synthesis. The DNA synthesis is essential to establish the sequence: either before detection, as in Sanger and terminated-dye sequencing, or at the moment of detection, as in pyrosequencing and semiconductor sequencing. With the third generation of sequencing, it will not always be required to synthesize new DNA. Nanopore sequencing transports a DNA single-strand molecule through a small pore of the order of 1 nanometer in internal diameter with an applied voltage. When the DNA molecule is passing though the nanopore it changes the electric current. Figure 1.9 shows how this works.
Nanopore sequencing is still under intensive development. Currently the nanopore systems of Oxford Nanopore do not detect single nucleotides of the passing DNA molecule. Instead it detects all the sub-molecules of three nucleotides in the DNA molecule. Because of this, there is a complicated base calling procedure and an increased likelihood for sequence specific errors.
1.4
MPS data processing
1.4.1
Variant analysis software
The main difference in using MPS technologies in forensics instead of CE is handling the different nature of the resulting data. MPS technologies will usually process the raw data and provide the analyst with a file containing DNA sequences. The two most common sequence file formats are FASTA and FASTQ. One entry in such a file is called a read and corresponds with one sequenced DNA molecule. FASTA files contain an annotated header and the sequence for every read, FASTQ files also contain information on the quality of each base called in the sequence. The DNA profile from an MPS processed sample is the set of sequence variants that can be attributed to the known or unknown contributor(s) of the sample. The sequences in the MPS data files
MPS DATA PROCESSING 21
Figure 1.9: Nanopore sequencing. The sequencing technique of Oxford Nanopore is displayed. (a) Double-stranded DNA is separated into single-stranded DNA by a polymerase such as phi29. This also slows down the ssDNA through the nanopore. The dark blue diamond reads the ssDNA sequence. (b) The ionic current is altered by the ssDNA sequence translocating through the nanopore. Each level represents one nucleotide residing inside the nanopore at a specific point in time. By detecting these levels, the sequence of the DNA can be decoded [64].
usually do not immediately match to the original sequences of the contributor and need to be processed:
• DNA adapters attached to the DNA molecules in the library preparation, could still be present in the sequences and need to be removed.
• Some technologies contain noise at the end of the sequence that needs to be removed.
After processing, the sequences need to be compared to each other and reference data to establish what variant alleles are present. To compare sequences they need to be aligned to each other. The main difficulty for the data processing
is the repetitive nature of the sequences of forensic loci, as this makes the alignment ambiguous and therefore non-trivial.
Research in MPS data analysis has not been focused on STR variant analysis. For medical applications, SNP variants are more relevant than STR variants because they are more frequent in coding regions. Furthermore, current MPS technologies have a general difficulty with sequencing VNTR and STR regions. They are therefore studied less and algorithms for the analysis of STRs have lagged behind.
1.4.2
Alignment algorithms
One of the first algorithms to compare biological sequences was the Needleman-Wunsch algorithm [51]. It dynamically constructs a global alignment between two sequences. The algorithm can be configured with different scoring systems. Figure 1.10 gives a detailed example. There is also the Smith-Waterman algorithm that is a variation on Needleman-Wunsch for local alignment [61]. A local alignment does not try to align both sequences from beginning to end, but tries to find the best scoring sub-alignment between the best two sub-strings of the sequences.
Processing time and memory requirements of both algorithms is of the computational order O(nm) with n and m the length of the two sequences aligned. Because MPS generates so much data (some technologies in the order of million sequences), it is computationally unfeasible to use these algorithms generally for MPS data analysis. The advent of MPS has therefore been accompanied by the development of new alignment algorithms. Most of them will not search for the optimal matching alignment, but will use heuristics to find significant matches. Word or k-mer methods first look up matching short sub-sequences. If two sequences have sub-regions with several matching identical k-mers at similar distances, a more sensitive algorithm is applied to align the sub-regions.
DNA DATABASES 23
Figure 1.10: Needleman-Wunsch pairwise sequence alignment. The algorithm finds the best possible alignments between two strings. It takes three score parameters: match, mismatch, and gap. The possible best matches are found by tracing back the highest scores indicated by the blue, red or black arrows. © User:Slowkow/Wikimedia Commons/CC-BY-SA-3.0
1.5
DNA databases
Given the difficulties with STRs, both in terms of sequencing as in data processing, some researchers conjecture that the current STR loci will be disregarded and that forensic profiles will be obtained mainly with SNP loci [62]. Irrespective of arguments pro SNP loci, there is a compelling reason why this is not likely to happen: the current state of the DNA databases.
A DNA database is a collection of DNA profiles and generally contains profiles from known offenders and unknown crime scene samples. It serves to link the crime scene samples to possible offenders, or to other crime scene samples to identify unknown repeat offenders. The first DNA database was the United Kingdom national DNA database (NDNAD) in 1995. In 2013 it contained 7 million individual profiles which represents 10% of the total UK population. A crime scene sample has a 61% chance of having a match [5]. The United States DNA database is called the combined DNA index system (CODIS) and was
started three years later. In 2014 it contained 13 million individual profiles [4], which is around 4% of the total US population.
Building DNA databases of the UK and US sizes, is a substantial investment up to the order of hundreds of million US$ [12]. The current databases contain mainly STR profiles. Based on this historical legacy, and taking account of the minor benefits of SNP loci information, it has no sense redoing all the profiles that are currently in the databases. Future searches need to be compatible with the current state of the databases, which means future profiles also need to contain the current STR loci.
This does not imply that future technologies need to be able to provide accurate results for all currently used STR loci. The different national databases do not contain the same set of loci either: US DNA databases are required to contain at least the CODIS core set of 13 loci, European databases have a minimal standard set of 12 loci known as theEuropean standard set (ESS). Table 1.4 shows both core sets. Future technologies should aim at a minimum to provide accurate results for a substantial overlap between those two different sets [24].
1.6
Legal and ethical considerations
1.6.1
Belgian legal context
Forensic DNA analysis is regulated by laws. Countries can have different regulations within their laws on how forensic DNA analysis should be carried out and can be used in the court room. For the sake of brevity, only the Belgian legal context is described. There are two laws that are important for forensic DNA analysis: 1) the specific law that regulates the identification procedure for criminal cases by means of DNA analysis (DNA law) [1, 2]; and 2) the general law for protection of the private life (privacy law) [3].
The DNA law states that a DNA profile is an alphanumerical code based on non-coding sequences from the human genome. It needs to be determined
LEGAL AND ETHICAL CONSIDERATIONS 25
Table 1.4: Loci core sets
CODIS ESS CSF1PO D1S1656 D2S441 D5S818 D3S1358 D3S1358 D8S1179 D8S1179 D7S820 D10S1248 D12S391 D13S317 D18S51 D18S51 D21S11 D21S11 D16S539 D22S1045 FGA FGA TH01 TH01 TPOX VWA VWA
according to international standards. The analysis needs to minimally include the loci TH01, vWA, D21S11, FGA, D8S1179, D3S1358, D18S51, D10S1248, D22S1045, D2S441, D1S1656, D12S391, and amelogenin. The technology used for the analysis is not specified. A laboratory that wants to use MPS for forensic DNA analysis in Belgium, needs to acquire accreditation and be accepted by the federal minister of Justice.
The privacy law applies to all information concerning identified or identifiable natural persons. As DNA profiles are considered unique for an individual it applies also to the DNA law. As the privacy law states that any use of private information must be with a specified, explicit and legitimate purpose, anything that is not explicitly allowed in the DNA law is forbidden. Hence, forensic analysis of phenotypic SNPs is not (yet) allowed in Belgium.
1.6.2
Who and what is suspect?
There are two ethical considerations that have to be made about the forensic DNA analysis itself: who and what should be profiled. Suspects of a crime are the first group whose DNA should be analyzed. Because they are suspect, there exists other evidence linking them to the crime. The DNA analysis will then corroborate or contradict the other evidence. Many times investigators do not yet have a suspect. Who should then be profiled?
One specific way to rephrase this is: Who should be in the DNA database? At one extreme, some believe everybody should be in a population-wide database. Their usual argument is: If you did nothing wrong you have nothing to hide and if everybody is in the database most crimes could be solved. However, there are quality, cost, privacy and security concerns that need to be considered with this radical solution.
Assuming that population-wide is not a good option, the first group to exclude from a national database would be the innocent, or at least those not previously convicted under the assumption of innocence. Notwithstanding an assumption of innocence, it is clear that suspects need to be profiled. In those cases, it would seem a waste not to do a database search, to see if the suspect can be linked to other crimes. And if you search the database once, why would you not maintain them in the database, at least until they are exonerated?
There is a slippery slope in deciding who should be profiled. Until 2009, the UK NDAD database maintained DNA profiles of previously arrested individuals that were not convicted. In a ruling of the European Court of Human Rights it was decided that retaining such DNA profiles was a violation of the right to privacy [12].
When database searching does not generate investigative leads, sometimes DNA mass screenings or dragnets are organized. In a DNA dragnet a group is targeted of which it is assumed the perpetrator is a member. All group members are requested to voluntarily donate a DNA sample. With larger groups this strategy
LEGAL AND ETHICAL CONSIDERATIONS 27
is very costly. A minor ethical concern is that it turns every group member into a suspect until proven innocent.
When nothing is known about the perpetrator, investigators would like to use the DNA itself to generate an image of the perpetrator. This is possible with the analysis of SNPs that correlate with externally visible characteristics (EVCs) [38]. Currently, the EVCs that can be extracted from a crime scene sample are not very discriminatory [48]. They can only assist the investigators to exclude certain suspects. Because of that, careful thought should be given to its implementation. Particularly, it does not seem justified informing the general public that the police is searching for a suspect with the following EVC profile: black eyes, black hair, darker skin.
One last method on which some countries place legal restrictions is called familial searching. In familial searching a database is searched to find close matches [10, 41]. By broadening the search the goal is to find a close family member of the suspect, such as a son or nephew. Further investigations are then necessary to find the real perpetrator.
1.6.3
Balancing false positives and negatives
Forensic sciences make mistakes, just as any science. Because of the implications on society it is important to reflect on the consequences of these mistakes. In the context of a forensic DNA analysis a false positive would be an innocent person, wrongfully linked to a crime. A false negative would be a perpetrator that is not properly linked to the crime, despite of a forensic DNA analysis. The strategies discussed in the previous section all have their own selectivity and sensitivity characteristics. Each strategy that is added to the forensic science toolbox should strike a good balance between both types of mistakes. This balance is generally preferred to be conservative for the perpetrators, to minimize the risk of wrongfully convicting an innocent person.
personal liberties. An extreme of 100% public safety will imply a higher rate of false positives. For 100% safety the population wide database would probably be necessary. Imagine you are living in such a country and at a certain moment in the future your country becomes a dictatorship with a new set of arbitrary laws. Would you still want to be in the database, not knowing which of the dictator’s laws you might be breaking?
1.6.4
The CSI effect
Television shows such asCSI: crime scene investigation have had an impact on the public expectations of what can be achieved with forensic DNA analysis. It has been dubbed theCSI effect [17]. Although a significant impact on the decision making of jurors [17, 32] has not been found, we should also be wary about the CSI effect in policy making and specifically the extent to which politicians will try to implement the previous mentioned strategies. Being a good forensic researcher should include asking the questionWhat is the good balance between public safety and personal liberties?
Chapter 2
Aim and outline
The ethical framework that forms the basis for forensic sciences is of the utmost importance. Nonetheless, the aim of this doctoral research was technical: to what extend can we improve forensic DNA analysis by using massively parallel sequencing technologies, instead of capillary electrophoresis? How much extra information can be obtained?
Chapter 3 is an exploratory study. At the outset of this doctoral research the theoretical advantages of MPS over CE were clear. However, it was necessary to establish if the MPS technologies were already sufficiently mature. The aim was straightforward: discovering if early MPS technologies were already capable of providing a competitive advantage in practical use. In order to ascertain that, we made a direct comparison between a standard STR kit processed by CE and MPS respectively.
There were several issues with the pipeline developed for the first study: it only processed STR loci and the different scripts in the pipeline did not work efficiently together. A second aim was to develop an integrated framework to process MPS STR data. This framework was namedMy Forensic Loci queries
(MyFLq) and is presented in Chapter 4. It combines all the algorithms necessary
for processing MPS STR and SNP data for forensics. Programmers can use it to build their own workflow for processing such data.
The end-users of forensic DNA analysis tools are forensic analysts. They are generally not versed in programming, therefore a user-friendly graphical user interface program was made for these potential users and is presented in Chapter 5. The aim of the program was to provide the analysts with a data-analysis workflow as close as possible to the current CE data-analysis workflow. This should enable an easy transition to MPS technologies for the forensic analysts.
In the previous papers, questions concerning the nomenclature for sequenced alleles were mostly disregarded. Compatibility with CE nomenclature was ensured, but the extra nomenclature necessary to annotate sequenced alleles was organized arbitrary. Chapter 6 aims to provide a future-proof solution. It discusses the question of nomenclature: How should sequenced alleles be reported? It presents the Forensic Loci Allele Database (FLAD) service that assigns unique and permanent identifiers to forensic allele sequences.
In the general discussion - Chapter 7 - MyFLq is compared in detail to the data analysis tools of other scientific groups. Currently available commercial products for MPS in forensics are also discussed.
Chapter 3
Exploring forensic DNA
analysis using MPS
Aim:
At the outset of this doctoral research the theoretical advantages of MPS over CE were clear. However, it was necessary to establish if the MPS technologies were already sufficiently mature and capable of providing a competitive advantage in practical use. In order to ascertain that, we made a direct comparison between a standard STR kit processed by CE and MPS respectively.
Adapted fromFSIG 6, 6 (DEC 2012):
Forensic STR analysis using massive parallel sequencing
Van Neste, C.* Van Nieuwerburgh, F.* Van Hoofstat, D. Deforce, D. * contributed equally 31
Abstract
We explore the applicability of second generation sequencing (SGS) to sequence multiplexed forensic STR amplicons, both in a single contributor sample as in multiple-person mixtures with different ratios. We compare the results of a commercial STR profiling kit (Applied Biosystems AmpFlSTR® Profiler Plus®),
analyzed both with capillary electrophoresis and with Roche GS FLX sequencing. An easy to use open-source software pipeline is provided, chaining together the different steps needed to start the analysis from a GS FLX FASTA file, resulting in a FASTA file containing the called and quantified alleles present in the data. Sequencing of multiplexed STR amplicons using Roche GS FLX titanium technology is technically feasible but the technology is not ideal for this purpose. The fraction of full length reads is small and the homopolymer sequencing error rate is high. The pipeline compresses the homopolymers to a single base to avoid false results caused by these homopolymers. The qualitative and quantitative results from the SGS STR analysis pipeline are comparable to the electrophoresis method. Additionally, the SGS method provides extra information and is able to call allele subtypes based on STR sequences in a database. In mixed samples, all alleles were reported from individuals that contributed at least 10% to the mixture.
3.1
Introduction
3.1.1
Background
Short tandem repeat (STR) profiling using PCR and capillary electrophoresis is currently the most commonly used method to obtain a forensic DNA profile. Advancing knowledge in human single nucleotide polymorphism (SNP) markers, generated by projects such as the International HapMap Project [21], raised the question within the forensic DNA typing community if SNP markers have the potential to replace the currently used STR loci. Second generation sequencing


![Figure 1.4: ABI Genetic Analyzer 3500xL. Common instrument for CE analysis [44].](https://thumb-us.123doks.com/thumbv2/123dok_us/10171290.2919381/44.680.233.459.113.350/figure-abi-genetic-analyzer-common-instrument-ce-analysis.webp)