Procedia Computer Science 00 (2010) 000–000
Science
www.elsevier.com/locate/procediaWCIT 2010
Estimating customer lifetime value based on RFM analysis of
customer purchase behavior: case study
Mahboubeh Khajvand
a *, Kiyana Zolfaghar
a, Sarah Ashoori
a, Somayeh Alizadeh
b aPost graduate student, IT Group - Faculty of Industrial Engineering K. N. Toosi University of Technology, Tehran, Iran b
Assistant professor, IT Group - Faculty of Industrial Engineering K. N. Toosi University of Technology, Tehran, Iran
Abstract
Since the increased importance is placed on customer equity in today’s business environment, many firms are focusing on the notion of customer loyalty and profitability to increasing market share. Building successful customer relationship management (CRM), a firm starts from identifying customers’ true value and loyalty since customer value can provide basic information to deploy more targeted and personalized marketing. In this paper, customer lifetime value (CLV) is used to customer segmentation of a health and beauty company. Two approaches are used: in the first approach, RFM (Recency, Frequency, and Monetary) marketing analysis method is used in order to segmentation of customers and in the second approach, the proposed extended RFM analysis method with one additional parameter - called Count Item - is used. Comparing results of these approaches, shows that adding count Item as a new parameter to RFM method makes no difference to clustering result, so CLV is calculated based on weighted RFM method for each segment. The results of calculated CLV for different segments can be used to explain marketing and sales strategies by the company.
Keywords: Customer relationship management; Customer lifetime value; Data mining, RFM analysis; Customer segmentation.
1. Introduction
Facing with more complexity and competition in today’s business, firms need to develop innovation activities to capture customer needs and improve customer satisfaction and retention [1]. In this regard, Customer relationship management is a broadly recognized strategy for acquisition and retention of customers. The main objective of CRM is to make long-lasting and profitable relationships with customers [2].
In this context, there are large databases containing extensive data about demographic information and customer transaction. Different CRM tools can be used to analyze this data for assessing the customer equity. The concept called Customer Lifetime Value (CLV) in CRM is the present value of all future profits generated from a customer [3]. Calculating CLV has had lots of applications and several authors have developed models for the applications such as performance measurement [4], targeting customers [5], marketing resources allocation [6,7], product offering [8], pricing [9], and customer segmentation [10, 11,12].
In this paper, CLV is used to customer segmentation of a health and beauty company. Two approaches are used: in the first approach, RFM marketing analysis method is used in order to segmentation of customers and in the second approach, the proposed extended RFM analysis method with other parameters is beside RFM parameters is
*Mahboubeh Khajvand. Tel: +98 21 09125337560 E-mail addresses: [email protected]
www.elsevier.com/locate/procedia
1877-0509 c⃝2010 Published by Elsevier Ltd.
doi:10.1016/j.procs.2010.12.011
c
⃝2010 Published by Elsevier Ltd.
Selection and/or peer-review under responsibility of the Guest Editor.
Open access underCC BY-NC-ND license.
used. Comparing results of these approaches, CLV is calculated based on suitable method for each segment. The results of calculated CLV for different segments can explain marketing and sales strategies by the company.
The rest of this study is organized as follows. Section 2 outlines the background and reviews related work on customer lifetime value, CLV divisions and classifications, data mining definitions and its application in calculating CLV, and customer segmentation. Section 3 describes our research methodology, case study and the approaches which are used to calculating CLV. Finally, Section 4 draws conclusions and discussion.
2. Background
This part introduces the reader to three concepts which are referred to later in this paper. In particular, it discusses the concept of CLV, RFM and weighted RFM models, Data mining methods, and Customer segmentation. 2.1. Customer lifetime value definitions and categories
CLV is going from customer relationship management (CRM) issue. CRM is an enterprise approach to understanding and influencing customer behavior through meaningful communication to improve customer acquisition, customer retention, customer loyalty, and customer profitability [13]. The goal of CRM is to forge closer and deeper relationships with customers and to maximize the lifetime value of a customer to an organization [14].
In literature review, there are some classifications for CLV models. One of these divisions was proposed by Gupta et al. (2006). Gupta et al. (2006) described six modeling approaches: RFM Models which is based on Recency, Frequency, and Monetary; Probability Models that is based on Pareto/NBD model and Markov chains; Econometric Models like probability model is based on Pareto/NBD model and customer acquisition, customer retention, and customer margin and expansion; Persistence Models is Based on modeling the behavior of its components, that is, acquisition, retention, and cross-selling; Computer Science Models which is based on theory (e.g., utility theory) and are easy to interpret [15]. In contrast, the vast computer science literature in data mining, machine learning, and nonparametric statistics has generated; Diffusion/Growth Models that is based on customer equity (CE). This study works on RFM model and exploits computer science tools. The most powerful and simplest model to implement CRM may be the RFM model – Recency, Frequency, and Monetary value [16]. Bult and Wansbeek (1995) defined RFM as: (1) R (Recency): the period since the last purchase; a lower value corresponds to a higher probability of the customer´s making a repeat purchase; (2) F (Frequency): number of purchases made within a certain period; higher frequency indicates greater loyalty; (3) M (Monetary): the money spent during a certain period; a higher value indicates that the company should focus more on that customer [17].
In recent researches, some authors proposed WRFM –Weighted RFM- instead of RFM. They dedicated weights to R, F, and M. depends on characteristics of the industry, different weights should be assigned to RFM parameters. For example, Stone (1995), suggested placing the highest weighting on the Frequency, followed by the Recency, with the lowest weighting on the Monetary measure [18], but in Chuang and Shen (2008), Monetary had the most value and Recency had the least value [1]. The AHP method is used to determine the relative importance (weights) of the RFM variables.
Some researches try to develop RFM model and add some parameters to these three parameters. For example, Cheng et al. (2009) derived an augmented RFM model, called RFMTC model (Recency, Frequency, Monetary value, Time since first purchase, and Churn probability), using Bernoulli sequence in probability theory.
In this study, we aim at comparing two approaches of customer segmentation based on RFM parameters and extended RFM parameters which is described later. Finally, CLV will be calculated based on appropriate approach. 2.2. Data mining and its methods
Simply stated, data mining is the process of automatically discovering useful information in large data repositories. Data mining techniques are deployed to scour large database in order to find novel and useful pattern that might otherwise remain unknown [19]. Data mining methods are two categories: descriptive and predictive. Classification is predictive method and clustering is descriptive method. Classification is the process of finding a model (or function) that describes and distinguishes data classes or concepts, for the purpose of being able to use the
model to predict the class of objects whose class label is unknown [20]. Unlike classification and prediction, which analyze class-labeled data objects, clustering analyzes data objects without consulting a known class label.
This paper used k-means clustering methods for customer segmentation in order to assess CLV for each segment. K-means is one of the well-known algorithms for clustering, originally known as Forgy’s method [21], and it has been used extensively in various fields including data mining, statistical data analysis and other business applications.
3. Case Study
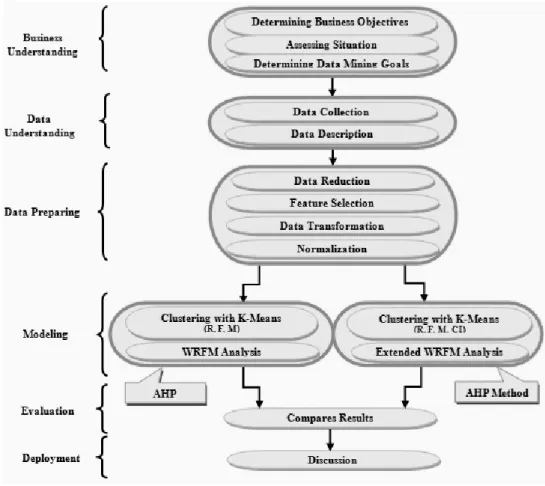
The structure of this paper is based on CRISP methodology, which is shown in figure 1:
Figure 1. Research approach
Phase1: Business Understanding
The case concerns a health and beauty company that manufactures shampoo, soaps and etc. This company presently produces over 100 products. Its decision-makers must target customer groups and develop market strategies to satisfy customer needs and thereby increase the market share of the company. For this study, one year of data on purchase transactions, approximately 7,000 records, have been collected. The customers of company can be classified in two general groups: Chain stores and retailers. Since the sale strategy of the company is designed based on retail sale, we just focus on the second group of customer. Our main goal is customer segmentation based on customer lifetime value (CLV). After segmenting customers, the average CLV is calculated based on it then a
CLV rank is assigned to each segment. The result of this study can be used as a guideline for making the sale and marketing strategies of company.
Phase2: Data Understanding
This phase involves taking a closer look at the data available for mining consist of data collection, data description and verifying the quality of data. The company databases include a wide variety of data. Among the existing data, transactional data meet our needs for customer segmentation and calculating CLV.
Phase3: Data preparing
Data preparation is one of the most important and often time-consuming aspects of data mining projects. This phase involves four steps: Data reduction, feature selection, data transformation and normalization. Consistent with what we said in business understanding phase, the data from chain store are eliminated from our dataset. Since our segmentation is on the basis of CLV and RFM methods, the selected features according to this method are included last purchase date, count purchase which is the frequency of customer purchases, total money that customer spent during one year and count item which refers to variety of customer purchased products. The last feature is selected based on expert point of view. In data transformation step, the data is transformed in a way that can be exploited by data mining tools. The following table shows the transformed data.
Table 1. Transformation of data
Initial data Transformed data
Last purchase date (type: date) Recency (type: number)
Count purchase Frequency
Total money Monetary: Total money/ count purchase
Min-max normalization method is used for normalization step. This method performs a linear transformation on the original data. Suppose that minA and maxA are the minimum and maximum values of an attribute, A. Then
Min-max normalization maps a value, v, of A to v’ in the range of [newminA,newmaxA] by computing in equation (1):
(1)
Phase4: Modelling
4.1. Clustering
Clustering method is used for customer segmentation. In this paper two modelling approaches to customer clustering are following. In the first approach, RFM parameters are just included in clustering. K-means clustering is employed to segment customers. In K-means clustering technique, the number of clusters should be determined by decision maker. To identify optimal k, various metrics can be employed. In this study, one of the DUNN index is used which is defined in equation (2):
k is the number of clusters in each clustering. Ciand Cj are clusters; max dist in Ci is the maximum distance
between mean of Ci and other objects in Ci;dist Ci, Cj is distance between the means of Ci and Cj. For each
clustering with k clusters, equation (2) is calculated k*(k-1) times because it must be done for each pairwise of clusters in a clustering. In next step, the maximum of them is compared with the maximum of the other clustering and finally, the clustering which has minimum of the maximum dij is chosen as the best clustering (Equation (3)).
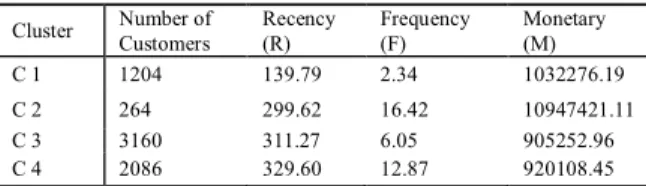
The best k in this study is 4, so there are 4 clusters of customers that have similar RFM behavior. Table2 is a summary of the clustering with real value of R, F, and M.
Table 2. Customer clustering based on RFM parameters Cluster Number of Customers Recency (R) Frequency (F) Monetary (M) C 1 1204 139.79 2.34 1032276.19 C 2 264 299.62 16.42 10947421.11 C 3 3160 311.27 6.05 905252.96 C 4 2086 329.60 12.87 920108.45
In the second approach, the forth factor - named Count Item (CI) - is included in modelling technique beside RFM parameters according to business experts’ idea. The result of clustering based on extended RFM (consist of Recency, Frequency, Monetary and Count Item) is shown in table 3.
Table 3. Customer clustering based on extended RFM parameters Cluster Number of Customers Recency (R) Frequency (F) Monetary (M) C 1 1143 132.82 2.09 981344.53 C 2 218 299.45 18.23 12247710.42 C 3 3193 308 6.21 953099.21 C 4 2160 328.01 12.24 1018776.53
Comparing the results of table 2 and 3 shows that adding count Item as a new parameter to RFM method makes no difference to clustering result. According to DUNN indices, the number of optimum clusters obtained 4 in both approaches and the average of RFM parameters did not change significantly.
Pearson’s correlation coefficient is calculated to measure the association between new added parameter (CI) and other existing parameters which are usually included in RFM method. The result shows an inconsiderable correlation between this parameter and the two of RFM parameters (Recency, Frequency), but it is not strong enough to be considered. Since the new parameter had no significant impact on clustering result and also had no strong correlation with other existing parameters, it can be concluded that this parameter is neutral in our calculation and should be removed from the list of effective parameters in clustering.
4.2. Estimating CLV for clusters
To calculate CLV for each cluster, weighed RFM method is used. According to the assessments obtained by the AHP, the relative weights of the RFM variables are as follow: WF is 0.637, WM is 0.258 and finally WR is 0.105. Average CLV value of each cluster can be calculated with equation (4):
NRci refers to normal Recency of cluster ci, WRci is Weighted Recency, NFci is normal Frequency, WFci is weighted Frequency, NMci is normal Monetary, and WMci is weighted Monetary. According to equation (4) the average CLV is estimated for each cluster, as it is shown in table 4.
Table 4. Normal amount of RFM parameter in each cluster Cluster Percent of Customers NR NF NM CLV Value C 1 18 0.408206 0.014725 0.007253686 0.054113069 C 2 4 0.878294 0.169451 0.077360921 0.22012 C 3 47 0.912559s 0.055495 0.00635554 0.132808406 C 4 31 0.966471 0.13044 0.006460579 0.186236241
To analysis clusters, we need to categorize the R, F, and M parameters in five categories (Very Low, Low, Medium, High, and Very High). These categories were determined by expert of the company as shown in table 5.
Table 5. RFM Categories
Very Low Low Medium High Very High
Recency 1 – 68 69 - 136 137 – 204 205 - 272 273 - 341 Frequency 1 – 18.4 18.5 – 36.9 37 – 55.4 55.5 – 73.9 74 – 92.4 Monetary 6400 - 11870920 11870920 - 23735440 23735440 - 35599960 35599960 - 47464480 47464480 - 59329000
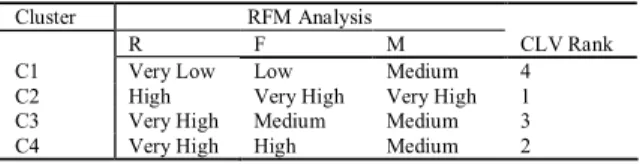
Comparing the result of RFM parameters’ values in each cluster with categorical values shown in table 5, the category of each parameter is identified to determine the CLV rank for each cluster.
Table 6. Categorized RFM and CLV ranking and CLV value for each clusters
Cluster RFM Analysis
R F M CLV Rank
C1 Very Low Low Medium 4
C2 High Very High Very High 1 C3 Very High Medium Medium 3
C4 Very High High Medium 2
Phase5 and 6: Evaluation and Deployment
The evaluation step assesses that which business objectives are met by the proposed model, and seeks to determine if there is some business reason why this model is efficient. Developing sale and marketing strategies is the most obvious object that can be covered by this study. According to the CLV ranking, different strategies can be developed. This should be done on the basis of expert point of view in the sale and marking department of company. Development step starts with the evaluation results and concludes with a strategy for deployment of the data mining results into the business. Deployment of current research result could be as our future work.
4. Conclusion
Customer segmentation is one of the CLV applications which focused on in current study. The Customers data for a beauty and heath company is analyzed as case study. We clustered customers into segments according to RFM and Extended RFM parameters using K-means Algorithm. Clustering customers into different groups helps decision-makers identify market segments more clearly and thus develop more effective marketing and sale strategies for customer retention. Since the RFM weights vary with the characteristics of industry, AHP method was applied to determine the relative importance of RFM variables based on expert point of view in sale department. According to weighted RFM parameters, CLV value was calculated for each customer segment. Then CLV rank was assigned to each segment on the basis of its CLV value. The current value provides financial viewpoint and potential value indicates cross-selling opportunities. By analyzing the CLV rank of segmented customer groups, we can develop refined marketing strategies for each segment. Deployment of these strategies in the company is our future work
Reference
1. H.M. Chuang and C.C. Shen, A study on the application of data mining techniques to enhance customer lifetime value based on the department store industry, The seventh international conference on machine learning and cybernetics 168-173.
2. V. Ravi, Advances in Banking Technology and Management: Impacts of ICT and CRM. Information science reference, Hershey, New York, Yurchak Printing Inc, (2008).
3. S. Gupta and D.R. Lehman, Customers as Assets, Journal of Interactive Marketing 17 1 (2003) 9-24.
4. Rust and Lemon and Zeithaml, Return on Marketing: Using Customer Equity to Focus Marketing Strategy, Journal of Marketing 68 1 (2004) 109-127.
5. M. Haenlein and A.M. Kaplan and D. Schoder, Valuing the Real Option of Abandoning Unprofitable Custorners When Calculating Customer Lifetime Value, Journal of Marketing 70 (2006) 5-20.
6. W.J. Reinartz and J.S. Thomas and V. Kumar, Balancing Acquisition and Retention Resources to Maximize Customer Profitability, Journal of Marketing 69 (2005) 63-79.
7. M. Ming and L. Zehui, and C. Jinyuan, Phase-type distribution of customer relationship with Markovian response and marketing expenditure decision on the customer lifetime value, European Journal of Operational Research 187 (2008) 313–326.
8. Y.Y. Shih and D.R. Liu, Product recommendation approaches: Collaborative filtering via customer lifetime value and customer demands, Expert Systems with Applications 35 1-2 (2008) 350-360.
9. P. Hidalgo and E. Manzur and S. Olavarrieta and P. Farías, Customer Retention and Price Matching: The Afps Case, Journal of Business Research 61 6 (2007) 691-696.
10. S. Rosset and E. Neumann and U. Eick and N. Vatnik and Y. Idan, Customer Lifetime Value Modelling and Its Use for Customer Retention Planning, Paper presented at the SIGKDD ’02 (2002).
11. M. Haenlien and A.M. Kaplan, and A.J. Beeser, A Model to Determine Customer Lifetime Value in a Retail Banking Context, European Management Journal 3 5 (2007) 221-234.
12. F. Benoit Dries and P.D. Van den, Benefits of quantile regression for the analysis of customer lifetime value in a contractual setting: An application in financial services, Expert Systems with Applications 36 7 (2009) 10475-10484.
13. R.S. Swift, Accelerating Customer Relationships - Using CRM and Relationship Technologies, Upper Saddle River, NJ: Prentice Hall, (2000).
14. D. Peppers and M. Rogers and R. Dorf, Is your company ready for one-to-one marketing, Harvard Business Review 77 (1999) 151–160. 15. S. Gupta and D. Hanssens and B. Hardie and W. Kahn and V. Kumar and N. Lin, Modelling Customer Life-Time Value, Journal of
Service Research 9 2 (2006) 139-155.
16. C.H. Cheng and Y.S. Chen, Classifying the segmentation of customer value via RFM model and RS theory, Expert systems with Applications (2009) 4176-4184.
17. J.R. Bult and T. Wansbeek, Optimal selection for direct mail, Marketing Science 14 (1995) 378-395. 18. B. Stone, Successful Direct Marketing Methods, NTC Business Books, Lincolnwood (1995). 19. P.N. Tan and M. Steinbach and V. Kumar, Introduction to data mining. pearson education, (2005).
20. J. Han and M. Kamber, Data Mining: Concepts and Techniques, CA: Morgan Kaufmann, San Francisco, (2006). 21. E. Forgy, Cluster analysis of multivariate data: Efficiency versus interpreability of classification, Biometrics 768.