AN ON-LINE PHOTOVOLTAIC MONITORING SYSTEM
USING THE ZIGBEE BASED WIRELESS NETWORK
FARIHAH BINTI SHARIFF
FACULTY OF ENGINEERING
UNIVERSITY OF MALAYA
KUALA LUMPUR
AN ON-LINE PHOTOVOLTAIC MONITORING
SYSTEM USING THE ZIGBEE BASED WIRELESS
NETWORK
FARIHAH BINTI SHARIFF
DISSERTATION SUBMITTED IN
FULFILMENT OF THE REQUIREMENTS FOR THE
DEGREE OF MASTER OF ENGINEERING SCIENCE
FACULTY OF ENGINEERING
UNIVERSITY OF MALAYA
KUALA LUMPUR
UNIVERSITY OF MALAYA
ORIGINAL LITERARY WORK DECLARATION
(1) I am the sole author/writer of this Work; (2) This Work is original;
(3) Any use of any work in which copyright exists was done by way of fair
(6) I am fully aware that if in the course of making this Work I have infringed any copyright whether intentionally or otherwise, I may be subject to legal action or any other action as may be determined by UM.
(5) I hereby assign all and every rights in the copyright to this Work to the University of Malaya (“UM”), who henceforth shall be owner of the copyright in this Work and that any reproduction or use in any form or by any means whatsoever is prohibited without the written consent of UM having been first had and obtained;
dealing and for permitted purposes and any excerpt or extract from, or reference to or reproduction of any copyright work has been disclosed expressly and sufficiently and the title of the Work and its authorship have been acknowledged in this Work;
(4) I do not have any actual knowledge nor do I ought reasonably to know that the making of this work constitutes an infringement of any copyright work; I do solemnly and sincerely declare that:
Name of Candidate:FARIHAH BINTI SHARIFF(I.C/Passport No: Registration/Matric No: KGA100049
Name of Degree: MASTER OF ENGINEERING SCIENCE
Title of Project Paper/Research Report/Dissertation/Thesis (“this Work”):
AN ON-LINE PHOTOVOLTAIC MONITORING SYSTEM USING THE ZIGBEE BASED WIRELESS NETWORK
Field of Study: SOLAR ENERGY
Candidate‟s Signature Date:
Subscribed and solemnly declared before,
Witness‟s Signature Date:
Name: Designation:
ABSTRACT
The increase of global energy demand and depletion of fossil energy has brought tremendous growth in renewable energy particularly solar energy. For grid-connected photovoltaic system (PV), monitoring is considered as a crucial aspect to observe the stability and performance of the system. Various methods are used in monitoring system. The simplest method is to have data collection done in an offline manner, where data acquisition system is installed on the plant and the data are stored locally over a period of time before being manually extracted for processing. However, this restricts the effectiveness of the monitoring system, as the data are not collected in real time. For real time monitoring system, cables are commonly used to transmit data from sensors to the data acquisition system. Due to the cost and technical limitations of the data cable, the monitoring station needs to be located reasonably close to the monitored plant. Apart from being inconvenient, the use of data cable often adds capital and maintenance cost to the system. Simpler wireless connection was introduced with similar capabilities as wired monitoring system. This research proposed an online monitoring system for grid-connected photovoltaic system by integrating monitoring system with Zigbee embedded system. The system is developed using Java and C programming language. Analysis and calculation of raw data is done in real time. Parameters like temperature, irradiation, PV power output and grid inverter output are being monitored in order to study the efficiency and stability of the system. In addition to monitoring features, this system is also equipped with user friendly control function. Another advantage of this system is with availability of internet connection; the data is accessible from anywhere around the world. The system monitored 1.25 kWp grid-connected photovoltaic system
located at 3rd and 4th floor of the Wisma R&D, University of Malaya in Kuala Lumpur,
Malaysia. The PV panels are mounted on the 3rd floor balcony of the Wisma R&D
base station, where the host PC is placed, is located at the other end of the 4th floor.
Wireless monitoring system for 1.25 kWp grid-connected inverter with a simple
web-based data acquisition system and its control has been developed. The system has provided an uncertainty of ≤ ±5%.
ABSTRAK
Peningkatan permintaan tenaga di dunia dan pengurangan tenaga fosil telah membawa kepada peningkatan dalam tenaga boleh diperbaharui terutamanya tenaga solar. Untuk sistem photovoltaik (PV) grid berkaitan, pemantauan dianggap sebagai aspek penting untuk memastikan kestabilan dan prestasi sistem. Pelbagai kaedah digunakan dalam sistem pemantauan. Kaedah yang paling mudah adalah dengan mengumpul data secara luar talian, di mana sistem perolehan data dipasang terus pada panel dan data disimpan dalam suatu jangka masa sebelum diekstrak secara manual untuk pemprosesan. Walau bagaimanapun, keberkesanan sistem pemantauan terhad kerana data tidak diambil dalam masa nyata. Untuk sistem pemantauan masa nyata, kabel selalu digunakan untuk menghantar data dari sensor ke sistem perolehan data. Oleh kerana kos dan batasan teknikal kabel data, stesen pemantauan perlu berada berhampiran dengan kawasan pemantauan. Selain mendatangkan kesulitan, penggunaan kabel data meningkatkan lagi modal dan kos penyelenggaraan kepada sistem. Sambungan tanpa wayar yang lebih ringkas telah diperkenalkan dengan keupayaan yang sama seperti sistem pemantauan berwayar. Kajian ini mencadangkan satu sistem pemantauan atas talian untuk sistem photovoltaik grid berkaitan dengan mengintegrasikan sistem pemantauan dengan sistem Zigbee terbenam. Sistem ini dibangunkan dengan menggunakan bahasa pengaturcaraan Java dan C. Analisis dan pengiraan data mentah dilakukan dalam masa nyata. Parameter seperti suhu, radiasi solar, output kuasa PV dan output penyongsang grid dipantau untuk mengkaji kecekapan dan kestabilan sistem. Selain ciri-ciri pemantauan, sistem ini juga dilengkapi dengan fungsi kawalan mesra pengguna. Satu lagi kelebihan sistem ini adalah dengan adanya sambungan internet, data boleh diakses dari mana-mana sahaja di seluruh dunia. Sistem ini memantau 1.25 kWp sistem photovoltaik grid berkaitan yang terletak di
tingkat 3 dan 4 Wisma R&D, Universiti Malaya di Kuala Lumpur, Malaysia. Panel PV dipasang di balkoni tingkat 3 Wisma R&D, manakala penyongsang diletakkan di makmal pemantauan di tingkat 4. Kawalan utama iaitu PC diletakkan di hujung tingkat 4. Sistem pemantauan wayarles untuk 1.25 kWp penyongsang grid berkaitan dengan
sistem perolehan data mudah berasaskan web dan kawalannya telah dibina. Sistem ini telah menyediakan ketidaktentuan ≤ ± 5%.
ACKNOWLEDGEMENTS
First and foremost, I would like to express my gratitude to my research project supervisors, Prof. Dr. Nasrudin Abd Rahim, and Prof. Dr. Hew Wooi Ping for the guidance and advice throughout the research.
I would like to express my appreciation to UMPEDAC members especially Ally, Tiesha, Kak Nanu, Kak Min, Naz, Kak Nurul for their support and help towards my postgraduate affairs. My acknowledgement also goes to all the technicians and office staffs of UMPEDAC for their kind co-operations.
Sincere thanks to all my friends especially Rahimah, Tan, Atai, Hang Seng, Rosmadi, Fayzul, Rivai, Hamdan, Aimi, Dzulhafizi and others for their advice, help, kindness and moral support during my study. Your kindness means a lot to me.
Last but not least, my deepest gratitude goes to my beloved parents; Mr. Mokhtar Mohd Yassin and Mrs. Rohana Abd Ghani and also to my siblings for their endless love, prayers and encouragement.
Special thanks also go to those who indirectly contributed in this research. Thank you very much.
TABLE OF CONTENTS
Abstract ... iii
Abstrak ... v
Acknowledgements ... vii
Table of Contents ... viii
List of Figures ... xi
List of Tables... xiv
List of Symbols and Abbreviations ... xv
List of Appendices ... xx
CHAPTER 1: INTRODUCTION ... 1
1.1 Research Background ... 1
1.2 Problem Statement ... 4
1.3 Objectives of the Study ... 5
1.4 Scope of the Study ... 5
1.5 Outline of the Report ... 6
CHAPTER 2: LITERATURE REVIEW ... 7
2.1 Chapter Overview ... 7
2.2 Factors Affecting Efficiency of PV Performance ... 7
2.3 Zigbee Characteristics and Features ... 9
2.4 Zigbee System Technology ... 12
2.5 Previous Monitoring Works ... 15
2.5.1 Previous Photovoltaic Monitoring Works ... 17
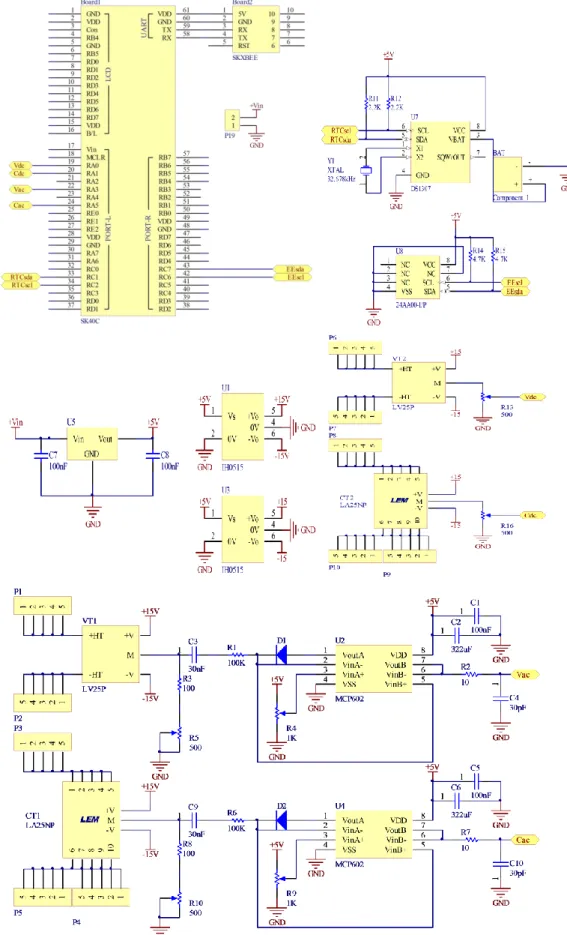
CHAPTER 3: RESEARCH METHODOLOGY ... 29 3.1 Overview... 29 3.2 System Architecture... 29 3.3 Hardware Design ... 33 3.3.1 Sensor Components ... 33 3.3.2 Logging Point 1 ... 39 3.3.3 Logging Point 2 ... 41 3.3.4 Data Transmission ... 42 3.3.5 24LC1026 EEPROM ... 43
3.3.6 Real Time Clock ... 44
3.4 Software Design... 44
3.4.1 System Control ... 44
3.4.2 Data Transmission ... 50
3.4.3 Displaying Data Online ... 51
CHAPTER 4: RESULTS AND DISCUSSION ... 54
4.1 Results of System Control ... 54
4.2 Results of Daily Power Generation ... 56
4.3 Results of Online Monitoring ... 61
4.4 Uncertainty Analysis ... 63
CHAPTER 5: CONCLUSIONS AND RECOMMENDATIONS ... 68
5.1 Conclusions ... 68
5.2 Recommendations... 68
References ... 70
List of Publications and Papers Presented ... 80
Appendix B: Figure of equipment/component used in research ... 84 Appendix C: Specifications of equipment/component used in research ... 87 Appendix D: Source codes ... 93
LIST OF FIGURES
Figure 1.1: Evolution of global annual PV market scenarios per region until 2017 (MW)
(Masson et al., 2013) ... 2
Figure 1.2: World PV cell/module production from 2000 to 2011 (Jäger-Waldau, 2012) ... 2
Figure 2.1: Zigbee agreement structure diagram (Lin et al., 2007; Labiod, Afifi, & Santis, 2007; Sung & Hsu, 2011) ... 11
Figure 2.2: Topology of Zigbee wireless networks (Hsu, 2010) ... 11
Figure 2.3: Tree addressing and stochastic addressing (Wheeler & Corporation, 2007) 13 Figure 3.1: System structure of monitoring system ... 31
Figure 3.2: Overall architecture of the grid-connected photovoltaic system ... 32
Figure 3.3: LP2 view from main base control room at level 4 ... 32
Figure 3.4: PV voltage and current transducer sensor‟s circuit (DC) ... 34
Figure 3.5: Inverter voltage transducer sensor circuit (AC) ... 35
Figure 3.6: Measurement circuit for dc input from inverter ... 35
Figure 3.7: Measurement circuit for ac input from inverter... 36
Figure 3.8: Inverter‟s current transducer sensor circuit (AC) ... 37
Figure 3.9: Location of temperature sensors ... 38
Figure 3.10: Temperature sensor circuit ... 38
Figure 3.11: Logging point 1 circuit ... 40
Figure 3.12: Logging point 2 circuit ... 41
Figure 3.13: SKXBee development board from Cytron (Technologies, 2013) ... 42
Figure 3.14: SKXBee to microcontroller connection ... 43
Figure 3.15: EEPROM data storage circuit ... 43
Figure 3.16: Real time clock circuit ... 44
Figure 3.18: Flowchart for button „Initialize‟ ... 45
Figure 3.19: Flowchart for button „Start‟ ... 47
Figure 3.20: Flowchart for button „Stop‟ ... 47
Figure 3.21: Flowchart for button „Delete‟ ... 47
Figure 3.22: Flowchart for LP1 ... 49
Figure 3.23: Flowchart for LP2 ... 49
Figure 3.24: Flowchart of XBee-PRO settings ... 50
Figure 3.25: Direction of transmission with source and destination address for main base, LP1 and LP2 ... 51
Figure 3.26: Flowchart of table display ... 53
Figure 3.27: Flowchart of graph display ... 53
Figure 4.1: Output of control system ... 55
Figure 4.2: String format for data transmitted: (a) Logging point 1 (b) Logging point 2 ... 57
Figure 4.3: View of CSV file (11 February 2014) ... 57
Figure 4.4: Comparison of measured and actual PV voltage ... 58
Figure 4.5: Comparison of measured and actual PV current ... 59
Figure 4.6: Comparison of measured and actual inverter voltage ... 59
Figure 4.7: Comparison of measured and actual inverter current ... 60
Figure 4.8: Online monitoring system web-page on 11 February 2014 (10:13 hours) ... 62
Figure 4.9: View of CSV file (11 February 2014) ... 62
Figure 4.10: Graph view of completed monitored data (11 February 2014) ... 63
Figure A.1: PV voltage and current transducer sensor‟s circuit (DC) ... 81
Figure A.2: Inverter voltage transducer sensor‟s circuit ... 81
Figure A.4: Logging Point 1 (LP1) circuit ... 82
Figure A.5: Logging Point 2 (LP2) circuit ... 83
Figure B.1: LV 25 voltage sensor ... 84
Figure B.2: LA 25 current sensor ... 84
Figure B.3: LM35DZ temperature sensor ... 84
Figure B.4: LICOR pyranometer ... 85
Figure B.5: XBEE-Pro Series 1 ... 85
Figure B.6: FLUKE 345 power quality clamp meter ... 85
Figure B.7: FLUKE 179 digital multimeter ... 86
Figure B.8: FLUKE 435 Series II Power Quality Analyzer ... 86
LIST OF TABLES
Table 2.1: Difference between Bluetooth and Zigbee (Sikora, 2006) ... 14
Table 2.2: Summarize of previous monitoring works ... 22
Table 3.1: List of GUI buttons and functions ... 45
Table 4.1: Summary for device uncertainties ... 64
Table 4.2: Summary for system uncertainties ... 67
Table C.1: Specification of LV 25 voltage sensor ... 87
Table C.2: Specification of LA 25 current sensor... 88
Table C.3: Specification of LM35DZ temperature sensor ... 89
Table C.4: Specification of LICOR pyranometer ... 89
Table C.5: PV module specification ... 90
Table C.6: Grid-connected inverter specification ... 91
Table C.7: 24LC1026 EEPROM specification ... 91
Table C.8: XBEE-Pro Series 1 specification ... 92
LIST OF SYMBOLS AND ABBREVIATIONS
µc : Microcontroller
AC : Alternating current
ADC : Analog-to-digital Converter
AES : Advanced Encryption Standard
CDMA : Code Division Multiple Access DAQ : Data Acquisition
DC : Direct current
DSP : Digital Signal Processing
Eac : AC energy
ED : Energy detection
EEPROM : Electrically Erasable PROM Elec. : Electrical
Epv : PV energy
ESC : Enhanced self-configuration
ETSI : European Telecommunications Standards Institute
f : Frequency
FF : Fill factor
FFD : Full-function device
FP : Field Point
G : Solar Radiation
G1 : Irradiance on plane of PV array
GC : Grid-connected
Go : Irradiance on horizontal plane GPRS : General Packet Radio Service
GSM : Global system for mobile communications GUI : Graphical user interface
GUM : Guide to the Expression of Uncertainty in Measurement
H : Hybrid
HMI : Human machine interface
H : Humidity
HSCHD : High-speed circuit switched data
Iac : AC current, grid current
Ib : Battery current
iEDM : Intelligent Energy Distribution Management
Il : Load current
Imax : Maximum current
Ipv : PV array current
Isc : Short circuit current
LC : Losses array capture
LP1 : Logging Point 1 LP2 : Logging Point 2 LQI : Link quality indication MAC : Media storage control layer
MANET : Mobile ad hoc wireless sensor network MCU : Microcontroller unit
Met. : Meteorological
MPPT : Maximum Power Point Tracking NI : National Instrument
OS : Operating system
P : Active power
Pac : AC power
PAN : Personal Area Network
PAR : Photosynthetically Active Radiation
Pb : Battery power
PC : Personal Computer
PCI : Peripheral component interconnect
PF : Power factor
PHP : Hypertext preprocessor PHY : Physical layer
Pl : Load power
PLC : Programmable Logic Controller
Pmax : maximum power
PPEs : Personal protective equipment
Ppv : PV power
ɸq : Soil heat flux
PV : Photovoltaic
PV-DG : Photovoltaic distributed generator PVT : Photovoltaic-thermal
Q : Reactive power
RAM : Random Access memory
RF : Radio Frequency
RFD : Reduced-function device
RFID : Radio Frequency Identification Devices
S : Apparent power
SCADA : Supervisory Control and Data Acquisition
SDir : Wind direction
Sv : Wind velocity
Sw : Wind speed
SWC : Soil water content
Ta : Ambient temperature
Tm : Module temperature
Ts : Soil temperature
uc : Total expanded uncertainty for current
ue : Uncertainty for energy
ui : Total expanded uncertainty for irradiation
up : Uncertainty for power
ut : Total expanded uncertainty for temperature
uv : Total expanded uncertainty for voltage
Vac : AC voltage, grid voltage VB : Microsoft Visual Basic
Vb : Battery voltage
VI : Virtual Instrumentation
Vl : Load voltage
Vmax : Maximum voltage
Voc : Open circuit voltage
Vpv : PV array voltage
W/Gc : Wind generator current
W/Gs : Wind generator rotational speed
W/Gv : Wind generator voltage
WSN : Wireless Sensor Network
Z : Utility grid impedance
γ : Array yield
γr : Reference yield
η : Efficiency
LIST OF APPENDICES
Appendix A: Actual photo of circuit……… 83
Appendix B: Figure of equipment/component used in research……….. 86
Appendix C: Specifications of equipment/component used in research………... 89
CHAPTER 1:INTRODUCTION 1.1 Research Background
As the global energy demand increases with the growth of world population, countries all over the world are putting more and more emphasis on the development of renewable energy. Among the many sources of renewable energy, solar energy is considered as the most promising and reliable energy source (Tyagi, Rahim, Rahim, & Selvaraj, 2013). In this light, governments in many countries have provided various incentives to setup solar energy-based power plants, to complement the existing power plants which are running on fossil fuel. Photovoltaic (PV) technology is used to convert solar energy into electricity. PV contains cells which are built from layers of semiconductor material. It reacts to sunlight and produce electricity. Since year 2000, PV distribution has increased tremendously. In Europe, PV covers 2.6% of the electricity demand and 5.2% of the peak electricity demand. PV global market was expected to increase up to 48 GW by 2017 (Masson, Latour, Rekinger, Theologitis, & Papoutsi, 2013). Figure 1.1 shows the evolution of global annual PV market scenarios per region until 2017. Production of solar cells also increased worldwide (Laird, 2010). According to European Photovoltaic Industry Association report (2013), the highest PV market was in Germany with 7.6 GW of newly connected system while China is the leading country in Asia region with 5 GW followed by Italy, United States of America and Japan (Masson et al., 2013). As for PV cell and module production, China is the leading country (Jäger-Waldau, 2012). Figure 1.2 shows world PV cell and module production trend since 2000. However, European countries remain the world‟s leading region in terms of cumulative installed capacity, with more than 70 GW as of 2012 which represent 70% of world‟s capacity.
Figure 1.2: World PV cell/module production from 2000 to 2011 (Jäger-Waldau, 2012)
Monitoring process is a crucial aspect for many technical systems, including solar energy conversion system. Bartle (2007) defines monitoring as regular observation and
Figure 1.1: Evolution of global annual PV market scenarios per region until 2017 (MW) (Masson et al., 2013)
recording activities in a project by collecting information on all aspects of the project. Monitoring is essential to observe the project progress. Monitoring also plays an important role in making decisions for project improvement thus facilitates the project planning and implementation. Implementation of monitoring provides valuable information for data analyzing, ensure the objectives gain, identifying problems and solution, and ensure that the system is operating properly. In order to ensure data is handled in systematic manner, user should implement monitoring function to their system.
In recent years, many solar energy conversion systems have included monitoring function as an integral part of the systems. Sugiura et al. (2003) implement monitoring program on residential PV systems in Japan. From the data obtained, factors that affected PV performance such as inverter loss, shading loss, inverter Maximum Power Point Tracking (MPPT) mismatch loss, array temperature rise loss and other loss were identified. Monitoring functions are applied not only to stand-alone PV system (Benghanem, 2010; Forero, Hernández, & Gordillo, 2006; Gagliarducci, Lampasi, & Podestà, 2007; Krauter, 2004; Park, Shen, Kim, & Rho, 2012; Ranhotigamage & Mukhopadhyay, 2011; Soler-Bientz, Ricalde-Cab, & Solis-Rodriguez, 2006), but also to grid-tied PV system (Anwari, Dom, & Rashid, 2011; Ayompe, Duffy, McCormack, & Conlon, 2011; Boonmee, Plangklang, & Watjanatepin, 2009; Carullo & Vallan, 2012; Drews et al., 2007; López, Mantiñan, & Molina, 2012; Pietruszko & Gradzki, 2003; Wittkopf, Valliappan, Liu, Ang, & Cheng, 2012), as well as hybrid PV system (Kalaitzakis, Koutroulis, & Vlachos, 2003; Koutroulis & Kalaitzakis, 2003; Papadakis, Koutroulis, & Kalaitzakis, 2005).
Conventional wired monitoring system provides reliable solution in data transmission but suffers from several limitations. Apart from the physical constraints
during the laying of data cables, the use of these cables also increases installation and maintenance cost. Besides, for outdoor application such as PV systems, continuous exposure to sun beam and rains may reduce the lifespan of the system (Spertino & Corona, 2013). Therefore, wireless monitoring system is favored over conventional cable-based monitoring system. Web-based monitoring system (Benghanem, 2010; Kalaitzakis et al., 2003; Krauter, 2004; Papadakis et al., 2005) can be an attractive monitoring method, as it enables data to be distributed among remote users and users will have the convenience to view data from any device with internet connectivity.
In this research, a Zigbee-based wireless monitoring system is designed and built as a replacement to the conventional cable-based monitoring system for a grid-tied PV system. Various aspects of the system development, from the design to construction and testing, are explained in detailed afterwards. A simpler Zigbee network topology is implemented. Besides that, a PC-based application is designed and implemented in order to allow remote controlling of the system. In addition to the previous works done, web-based function is added which allows easy access of the data over the internet to provide timely evaluation on the system performance, as well as to provide counter measures if any failures detected.
1.2 Problem Statement
Nowadays, solar monitoring is important in photovoltaic system. It is important to measure the efficiency of the system and factors leading to malfunction in the system. Many problems and limitations occur when doing monitoring for solar system. Conventional cable-based monitoring system requires high cost in laying the cables for installations and incurs high maintenance over the years. Due to this, research concern arises in the area of method used to monitor performance of the system for either wired
or wireless. Few researches applied wireless methods to monitor performance of photovoltaic system in unattended mode and from afar.
In this research, the development of a new data acquisition system has been proposed. The system is equipped with online features and is able to monitor and control the PV system from afar. Zigbee is chosen as the wireless medium for data transmission. Parameters like PV voltage; PV current; inverter voltage; inverter current; ambience temperature; panel temperature and irradiation are measured and recorded. For electrical sensors, calibration is done by using Fluke power quality meter, Fluke power quality analyzer and Fluke digital multimeter in order to determine the accuracy of the system proposed.
1.3 Objectives of the Study
This research is designed to cater the needs of monitoring grid connected photovoltaic system in order to monitor its performance and collecting data on environmental aspect. The purposes of this study are as follow:
To design and implement a remote monitoring and controlling system for grid-connected photovoltaic system using Zigbee wireless sensor network.
To build a web-based data system that can monitor data collected from the grid-connected photovoltaic system via online.
1.4 Scope of the Study
This research study intends to focus on the development of a new wireless data acquisition system in order to monitor the performance of grid-connected photovoltaic. The scope of study for the research includes:
Design and implement a monitoring system that can be placed in remote area and controlled via Zigbee.
Design an algorithm for wireless data processing system to store data in server.
Develop a PC-based control application for the monitoring system via Zigbee.
Develop a web-based application to view and monitor the system online.
1.5 Outline of the Report
Chapter 2 contains the literature review of the research. In this chapter, factors affecting efficiency of PV performance are discussed. Zigbee characteristics, features and technology are further explained here. Besides that, previous monitoring works which includes previous photovoltaic monitoring works done and previous Zigbee monitoring applications are also discussed in this chapter.
Chapter 3 explains the system architecture in this research. In this chapter, the overall system structures are discussed. Besides that, this chapter describes hardware and software methods used in order to implement the system.
Chapter 4 focuses on the results obtained from the system. Discussions on data obtained are further explained in this chapter. In this research, data obtained are displayed in web-based to enable other user to monitor the results. Furthermore, calculations on system uncertainty analysis are also described in this chapter.
Chapter 5 states the conclusion of the research. The advantages of wireless monitoring instead of wired monitoring are discussed in this chapter. In addition, future recommendations are also included in this chapter in order to enhance and improve any imperfection of this research.
CHAPTER 2:LITERATURE REVIEW 2.1 Chapter Overview
Grid-connected photovoltaic system has been widely utilized throughout the world as one of the alternatives to replace conventional energy. People have started to have awareness over capabilities of renewable energy to replace conventional energy. Monitoring becoming crucial aspects in order to ensure grid-connected photovoltaic system provide high performance and stability. Nowadays, many methods and devices used in monitoring either wired or wireless. Zigbee is chosen as wireless medium to monitor data in this research. In this chapter, factors affecting efficiency of PV performance is discussed. Zigbee characteristics and features as wireless transmission device have been investigated in section 2.3. Zigbee system technology is discussed in section 2.4 while previous monitoring works are discussed in section 2.5. Previous photovoltaic monitoring works and Zigbee monitoring applications are listed in section 2.5.1 and 2.5.2.
2.2 Factors Affecting Efficiency of PV Performance
Santos, Barrio, and Garcia (1986) proved that as the solar irradiance increases, the PV module efficiency also increases due to the high number of photons hitting the module. Many electron-hole pairs can be formed if the level of irradiance increase thus will produce more current. Yoo (2011) collected data on PV efficiency and solar irradiance. From his research, he found out that PV system efficiency directly proportional to the amount of solar irradiance received. Besides irradiance, there are also other factors that affected performance of PV system such as cell temperature and dust.
Losses occur in terms of array capture losses, system losses, cell temperature losses, soiling and degradation. Losses such as soiling and degradation are hard to estimate as
they give small effects over large fluctuations in operating conditions (Ayompe et al., 2011). There are a few additional losses that can be observed under real operating conditions such as optical reflection losses; low irradiance levels; thermal losses; reduction of output current; wiring losses; decreasing conversion efficiency (Krauter SCW, 2006).
Shadowing of a single cell in a series string of solar cells leads to reverse bias of the shadowed cell. Reverse bias and consecutive microplasma breakdown have been physically described and modelled (Spirito & Albergamo, 1982; J W Bishop, 1989; J.W. Bishop, 1988). Bishop (1988) investigated shadowing effects on solar cells and found out that shadowing will reduce array efficiency and caused hot spot heating. Due to shadowing, cell encapsulation is damaged while array power output reduced. Kovach (1995) performed a thorough analysis of the reverse-biased solar cell and applied Bishop‟s model in order to draw conclusions on hot spot formation and yield reduction of PV arrays. For commercially available crystalline and amorphous cells, model parameters for both models were derived from measurements by Alonso and Chenlo (1998). Solar cell I–U characteristics in reverse bias show more variation than in forward bias. Kovach (1995) also found that under shadowing conditions a poor PV array lay-out can lead to large energy losses and those even small shadows can appreciably affect the energy yield.
Increasing module temperature will lead to decrease in efficiencies in PV module (Yamaguchi et al., 2003). An effective way of improving efficiency and reducing the rate of thermal degradation of a PV module is by reducing the operating temperature of its surface. This can be achieved by cooling the module and reducing the heat stored inside the PV cells during operation. As an example, solar-water pumping system can be given. Such a system consists of a PV module cooled by water, a water pump, and a
water storage tank. Cooling of the PV module is achieved by introducing water trickling configuration on the upper surface of the module (Endecon Engineering, 2001).
Based on European Photovoltaic Technology Platform (2011) report, dust was identified as one of the factors affecting PV efficiency. The occurrence of dust may block the coming irradiance onto PV modules. Goossens & Van Kerschaever (1999) investigated the effect of wind velocity and air borne dust concentration on the PV cell performance caused by dust accumulation on such cells. From the investigation, they found out that as dust density increase, PV power output will drop. Jiang, Lu, and Sun (2011) tested the effect of air borne dust on three types of PV modules which are (1) monocrystalline (2) polycrystalline and (3) amorphous silicon. The experiments were conducted in a lab, using a solar sun simulator and dust generator. They concluded that air borne dust will reduce the short circuit current and thus affect the efficiency of the PV module and the efficiency drop linearly with the dust deposition density. The results of this study also indicated that dust pollution has a significant impact on PV module output. With dust deposition density increasing from 0 to 22 g/m2, the corresponding
reduction of PV output efficiency grew from 0% to 26%. The reduction of efficiency has a linear relationship with the dust deposition density, and the difference caused by cell types was not obvious.
2.3 Zigbee Characteristics and Features
Zigbee is a low power and transmission rate wireless communication technology. It was developed based on IEEE 802.15.4 stack model. It was set by IEEE 802.15.4 and Zigbee Alliance organizations. Development of the physical layer (PHY), media storage control layer (MAC), and the data link layer is led by IEEE, while the ZigBee Alliance is responsible for determining logic networks, data transmission encryption mechanisms, application interface specifications, and communication specifications
between system products. ZigBee agreement structure diagram is revealed in Figure 2.1 (Lin, Liu, & Fang, 2007; Labiod, Afifi, & Santis, 2007).
Zigbee device was built to support sensor networking-based applications which utilized radio frequency. Zigbee devices are designed for simple and lightweight wireless networks. Zigbee‟s transmission ranges are up to 100 m indoor and 1.5 km outdoor (line-of-sight). Zigbee is a low power device which operates at 2.4 GHz frequency. Initial version of Zigbee devices has transmission rate of 20 to 250 kbps; supports different topologies such as star and mesh; addressing based on short 16 bits or normal MAC (64 bits) address; support simple access and slotted allocation with guarantees; support acknowledge data transfer and optional beacon structure; energy detection (ED); link quality indication (LQI); and multilevel security (Labiod, Afifi, & Santis, 2007).
The MAC level of ZigBee utilizes a talk-when-ready collision prevention mechanism: data is transmitted immediately when there is need, and each transmitted data packet is confirmed to be received by receiver and is responded to with a confirmation message; if a confirmation message is not received in response, then a collision has occurred and the data packet is transmitted again. This method greatly increases the reliability of the system‟s data transmission.
In addition, a ZigBee network can include a maximum of 255 nodes, making it highly expandable (Lin et al., 2007; Sung & Hsu, 2011).
Zigbee devices support three network topologies which are centralized star, cluster-tree-based and mesh network as shown in Figure 2.2 (Hsu, 2010). Zigbee devices have two types of capabilities which are reduced-function device (RFD) and full-function device (FFD). RFD circuits are less complex compared to FFD and less memory.
Normally, RFD functions as a slave or regular node which has no master-slave communication while FFD may functions as master (coordinator) and a Personal Area Network (PAN) coordinator with controller functions (Lin, Liu, & Fang, 2007; Labiod, Afifi, & Santis, 2007).
Figure 2.1: Zigbee agreement structure diagram (Lin et al., 2007; Labiod, Afifi, & Santis, 2007; Sung & Hsu, 2011)
2.4 Zigbee System Technology
Early research of wireless sensor networks mainly focusing on military applications. In the beginning of 2000-2002, companies such as Ember, Dust, Sensicast and others begun to find prospects of sensor network topology (Wheeler & Corporation, 2007). Other parties started to build industry standard body called Zigbee and initiated 802.15.4 group within IEEE. As described in previous section, Zigbee is a standard released by IEEE 802.15.4 and Zigbee Alliance organization. Their main objective was to standardize PHY and MAC for low-cost, low-power and robust performance (Wheeler & Corporation, 2007). Philips and Motorola are also included in Zigbee member companies (Wheeler & Corporation, 2007).
In 2003, standard of 2.4 GHz, 900 MHz and 868 MHz unlicensed bands were confirmed (Wheeler & Corporation, 2007). At 2.4GHz band, the 802.15.4 standard operated at 250 kb/s while for 900 MHz and 868 MHz, the standard operated at 40 kb/s and 20 kb/s (Wheeler & Corporation, 2007).
The first released of Zigbee was in December 2004 which was stated as version 1.0 (Egan, 2005). Zigbee Alliance specified six applications spaces for Zigbee which are (1) consumer electronics; (2) PC and peripherals; (3) residential/light commercial control; (4) industrial control; (5) building automation; and (6) personal healthcare (Egan, 2005). The main concerns from users are robustness and security. Zigbee introduced mesh networking to increase robustness and cater security needs by applying 128-bit
Advanced Encryption Standard (AES) (Egan, 2005).
Several years of research brought to a new revision and the introduction of Zigbee Pro (Wheeler & Corporation, 2007). The new stack (Zigbee Pro) was the upgraded version of Zigbee 1.0. Various changes were made to improve robustness and scalability
of the Zigbee standard. One of the changes made was addressing (Wheeler & Corporation, 2007). Zigbee 1.0 supports tree structure addressing which would run out of address in large scale deployments (Wheeler & Corporation, 2007). Zigbee Pro introduced random address assignments which consist of 16-bit address space (Wheeler & Corporation, 2007). Hence, collision problems are not common. Other additional feature includes conflict resolution mechanism which detected addresses conflicts based on unique IEEE MAC addresses (Wheeler & Corporation, 2007).
Zigbee 1.0 used single routing algorithm which required both memory and network overhead and Zigbee only have 4-8 kb of Random Access Memory (RAM) to reduce cost (Wheeler & Corporation, 2007). Enhancement made to Zigbee Pro algorithm was two routing algorithm in the same network which helps in keeping storage and network overhead to minimal (Wheeler & Corporation, 2007). Besides that, Zigbee Pro supports point-to-point connection and many-to-one connection (Wheeler & Corporation, 2007). Figure 2.3 shows tree addressing and stochastic addressing diagram.
Figure 2.3: Tree addressing and stochastic addressing (Wheeler & Corporation, 2007)
Zigbee 1.0 has asymmetric links problem due to manufacturing variances in radio (Wheeler & Corporation, 2007). Transmission path normally constructed in reverse directions thus creating routing path that may be functional in destination to source direction but not in forward direction (Wheeler & Corporation, 2007). Zigbee Pro adds asymmetrical links detection and constructs path in forward direction instead of reverse direction and each device exchanged link reliability information (Wheeler & Corporation, 2007). During route discovery, links was weight based on the reliability in the direction link based on the information obtained (Wheeler & Corporation, 2007).
Zigbee‟s closest competitor is Bluetooth. Both Zigbee and Bluetooth came from family of IEEE802 standard. Table 2.1 listed out the differences between Bluetooth and Zigbee (Sikora, 2006). Bluetooth was established on 1997 while Zigbee was established on 2001. Both Zigbee and Bluetooth operate at the same frequency which is 2.4 GHz, but provide different routing system, algorithms and security. Zigbee supports large network capacity and multiple wireless nodes as it has tree, neighbor and table-based routing algorithms compared to Bluetooth which only supports point-to-point communication.
Table 2.1: Difference between Bluetooth and Zigbee (Sikora, 2006)
Characteristics Bluetooth Zigbee
Since 1997 2001
Standard IEEE802.15.1 IEEE802.15.4
Frequency 2.4 GHz 2.4 GHz
System Master-slave CSMA/CA
Routing algorithms
Point-to-point Tree, neighbor and table-based
Security Cryptographic Tiered
Target Applications
Consumer and
communication applications
Residential home control, commercial building control, industrial plant management
2.5 Previous Monitoring Works
Traditional monitoring was done using wired connection. Some define this method as on-site monitoring. Previous literature review shown that for monitoring, data acquisition system was wired directly to Personal Computer (PC) to store and display data. Koutroulis & Kalaitzakis (2003) used microcontroller to collect data and transmitted data were sent to PC using RS232 serial connection. Aste, Chiesa, and Verri (2008) monitored performance of a photovoltaic-thermal (PVT) air collector. A computer-based real time monitoring system has been connected by cable to measure the thermal and electrical performance of the system.
European Telecommunications Standards Institute (ETSI) has built European standard for cellular communications which was known as Global system for mobile communications (GSM) (Mouly & Pautet, 1992). GSM is renowned for its capability to encode voice and convert to digital stream before transmitting in network. According to Rapeli (1995), GSM have been implemented in over 100 countries and considered most important service in voice telephony. By using circuit-switched data channels, GSM able to provide data services with maximum bit rate of 14.4 kbit/s. High-speed circuit switched data (HSCHD) was introduced to serve for higher bit rates. However, it is still insufficient for bursty data application such as web browsing. General Packet Radio Service (GPRS) improved GSM standard by introducing packet switched techniques to mobile subscriber. Unlike GSM, GPRS provides higher bit rates for bursty data transmissions. GPRS used several time slots which resulting in bit rate about 170 kbit/ s and able to support bursty data applications (Ghribi & Logrippo, 2000).
Radio communication has the possibility of sending and receiving a huge amount of information with reduced costs of the transmission, and it is also a good alternative in the case of the lack of telephone lines. Its main disadvantage is the difficulty in
obtaining permission for the transmission frequency and the high price of its installation (Rosiek & Batlles, 2008). (Benghanem, 2009b) used Radio Frequency (RF) circuit to transmit data to remote server for storage and processing with distance more than 200 m.
Bluetooth is widely used for data transmission. Bluetooth is a universal short-range low-power radio protocol operating in the unlicensed industrial, automotive, scientific, and medical frequency band. Bluetooth technology was designed primarily to support simple wireless networking of personal consumer devices and peripherals. The advantages of Bluetooth is wireless signals transmitted with Bluetooth cover only short distances, typically up to 10 m for Bluetooth class 2 and 100 m for Bluetooth class 1. It allows both data and voice connections (Hua, Lin, Xu, Li, & Ouyang, 2009).
Ethernet is also one of the most widely used communication protocol. Naeem, Anani, Ponciano, and Shahid (2011) presented remote condition monitoring system using embedded web server. The advantages of Ethernet are it provides reliability, speed and good immunity to noise and electromagnetic interference. The drawback of using Ethernet was the control unit must be connected to Local Area Network using cable. Thus, it was not suitable for remote photovoltaic station. Besides that, Ethernet use TCP/IP protocol which was complex to configure.
The satellite also known as one of the medium used for communication. Satellite has a great spatial and temporal coverage and it is very useful in places without access to telephone lines. However, satellite is a very expensive method. Its main disadvantage is the high cost of its installation (Rosiek & Batlles, 2008).
WiFi and WiMax are one of wireless communication techniques used these days. Although WiFi and WiMax offered higher transmission speed, their coverage is limited
to 200 m. WiMax has more advantages compared to WiFi as it can covers area in 50 km order (Rosiek & Batlles, 2008). Cao, Chen, Zhang, and Sun (2008) used wireless sensor network (WSN) as communication medium for micro-environmental monitoring system.
Zigbee characteristics which utilized low power and cost makes it fits for the data transmission medium for communication. Zigbee‟s transmission ranges are up to 100 m indoor and 1.5 km outdoor (line-of-sight). Initial version of Zigbee devices has transmission rate of 20 to 250 kbps which is higher than GSM and GPRS (Labiod, Afifi, & Santis, 2007). Besides that, Zigbee consumes far less power than Bluetooth resulting in lower transmission rate compared to Bluetooth. Zigbee capable of range expansion due to mesh topology supports (Sung & Hsu, 2011). Fields of application for ZigBee include family automation, family security, overall medical care in hospitals, and industrial automation. ZigBee can be used in conjunction with products such as home appliances, consumer electronics, PC peripherals, and sensors, providing functions such as home appliance sensing, wireless PC peripheral control, and home appliance remote control (Lin & Liu, 1997).
2.5.1 Previous Photovoltaic Monitoring Works
With the aim of building an effective yet low cost monitoring system, numerous previous works on solar energy monitoring system have been reviewed. Table 2.2 listed all important characteristics based on the reviewed works. Earlier, both wired and wireless systems are used for transmitting data.
RS232 (Anwari et al., 2011; Forero et al., 2006; Mukaro & Carelse, 1999; Soler-Bientz et al., 2006) cable and RS485 cable (Ayompe et al., 2011) are normally used in data transmissions for pc-based monitoring system. However, continuous sun beam and
rain exposure on cable may reduce the lifespan of the system. Besides that, the use of cable often add maintenance cost to the system (Spertino & Corona, 2013). Due to this, wired systems are less favorable compared to wireless system for PV monitoring system.
Various data transmission technology was utilized for wireless monitoring system, i.e. the use of satellite (Krauter, 2004), GSM (Gagliarducci et al., 2007; Rosiek & Batlles, 2008), Zigbee (López et al., 2012; Ranhotigamage & Mukhopadhyay, 2011) and other general RF devices (Benghanem, 2009b, 2010; Kalaitzakis et al., 2003; Papadakis et al., 2005),. Satellite took the longest time when transmitting data which is around 8 to 12 minutes (Krauter, 2004) compared to other wireless technology. Among all wireless technology, GSM is the most reliable in data transmission. However, GSM has higher operating cost as the user needs to pay the services for every data transmitted. Based on the reviewed literature, RF is frequently chosen as wireless data transfer mechanism. Within all RF devices, Zigbee is known for its low cost and secure communication features. One of its features is allocation of special time slot which makes Zigbee able to avoid data collision. Besides that, Zigbee is capable of supporting large network capacity which is up to 65536 nodes which makes it highly expandable compared to Bluetooth and Wifi which is only up to 7 and 32 nodes (Lin et al., 2007; Sung & Hsu, 2011). Therefore, Zigbee is chosen over other RF devices for its low cost; secure communication; robustness; and upgradable network capacity features.
As seen from the surveyed literature, microcontroller or Data Acquisition (DAQ) card and units are used as the main brain of PV monitoring system. Microcontroller is one of the low cost solutions. Besides sensor‟s precision, using processors with high Analog-to-Digital Converter (ADC) resolution also enhance the accuracy of measurement. 8-bit ADC (Mukaro & Carelse, 1999), 10-bit ADC (Anwari et al., 2011;
Benghanem, 2009a, 2009b; Krauter, 2004; Rosiek & Batlles, 2008) and 12-bit ADC microcontroller provides low-cost solution (Koutroulis & Kalaitzakis, 2003) compared to DAQ card or units (Ayompe et al., 2011; Carullo & Vallan, 2012; Forero et al., 2006; Gagliarducci et al., 2007; Kalaitzakis et al., 2003; Koutroulis & Kalaitzakis, 2003; López et al., 2012; Papadakis et al., 2005; Park et al., 2012; Pietruszko & Gradzki, 2003; Soler-Bientz et al., 2006). Microcontroller is chosen in this research, as it provides a low cost solution besides providing high ADC resolution.
According to IEC61724 standard, sampling intervals depend on parameters recorded. Sampling intervals for parameters which vary directly with irradiance shall be set to 1 minute or less (Anwari et al., 2011; Forero et al., 2006; Kalaitzakis et al., 2003; Koutroulis & Kalaitzakis, 2003; Mukaro & Carelse, 1999; Papadakis et al., 2005; Ranhotigamage & Mukhopadhyay, 2011; Rosiek & Batlles, 2008; Soler-Bientz et al., 2006). For parameter with larger time constants, i.e. temperature, sampling interval between 1 to 5 minutes is acceptable. In this research, sampling interval is set to 1-minute which is applicable to all parameters and complies with IEC61724 standard.
Various types of management software were used and reported in Table 2.2. For programming microcontroller, Turbo C++ (Mukaro & Carelse, 1999) and MPLAB (Anwari et al., 2011) software were used while for language, Assembly (Mukaro & Carelse, 1999) and C (López et al., 2012) were normally used. SCADA systems implemented Autobase (Park et al., 2012) which was used to control PLC. For numeric calculation and analysis, MATLAB (Benghanem, 2009a; Wittkopf et al., 2012) was the best choice of software. System design software such as LabVIEW (Anwari et al., 2011; Benghanem, 2009b, 2010; Carullo & Vallan, 2012; Forero et al., 2006; Gagliarducci et al., 2007; Koutroulis & Kalaitzakis, 2003; López et al., 2012; Soler-Bientz et al., 2006) served various comprehensive tools for measurement and control application. Java
(Kalaitzakis et al., 2003), Microsoft Visual Basic (VB) and SQL server (Papadakis et al., 2005) provides software design and interface for web-based implementations. In this research, C language is considered the best choice for programming microcontroller as C is not complicated compared to MPLAB, Turbo C++ and Assembly while Autobase is only applicable to monitor and control PLC system. MATLAB was good for calculation and prototyping but hard to deploy on server. Although LabVIEW contains various tools for measurement and control, its Virtual Instrumentation (VI) is complicated and hard to interface. In terms of web-based implementation, Java is considered the best choice over VB and SQL server (.NET platform). Java is crossed-platform software which can run in all operating system (OS) compared to .NET which can only run on Windows. Besides, Java platform is more secured compared to .NET.
From Table 2.2, measured parameters were categorized to Met. (Meteorological) and Elec. (Electrical) parameter. Weather station only collects data on meteorological parameters such as solar radiation and temperature (Benghanem, 2009b, 2010; Mukaro & Carelse, 1999; Rosiek & Batlles, 2008). Parameters recorded for stand-alone PV systems (Benghanem, 2010; Forero et al., 2006; Gagliarducci et al., 2007; Krauter, 2004; Park et al., 2012; Ranhotigamage & Mukhopadhyay, 2011; Soler-Bientz et al., 2006) and grid-connected PV systems (Anwari et al., 2011; Ayompe et al., 2011; Boonmee et al., 2009; Carullo & Vallan, 2012; Drews et al., 2007; López et al., 2012; Pietruszko & Gradzki, 2003; Wittkopf et al., 2012) were similar except for parameters related to battery and load which only applied to stand-alone system and parameters related to utility/grid which only applied to grid-connected system. For hybrid renewable energy systems (Kalaitzakis et al., 2003; Koutroulis & Kalaitzakis, 2003; Papadakis et al., 2005), parameters for both PV and wind system were collected. As seen from Table 2.2, grid-connected PV system required both meteorological and electrical parameters.
Monitoring is important to monitor PV system performance and provide fast failure detection. Renewable energy systems are usually installed on geographically isolated areas. It is costly to install monitoring system on-site and troublesome for users to collect data. Therefore, in this research, a web-based system is built to overcome this problem. Web-based system enabled data to be distributed among remote users which made it easily accessible from all devices with internet connectivity. Besides that, web-based system allowed the data to be displayed in an attractive manner. Based on Table 2.2, few works implemented web-based monitoring system to their research projects (Kalaitzakis et al., 2003; Krauter, 2004; Papadakis et al., 2005; Park et al., 2012).
Table 2.2: Summarize of previous monitoring works Wor k d on e by Dat a tr an sf er m ec h an ism PV syste m type Contr oll er Parameters S amp. in te rval M on itor in g m ethod S of tw ar e/ lan gu age Met. Elec. Mukaro & Carelse, 1999 Wired: RS232
WS ST62E20 G none 1m PC Turbo C++, ASSEMBLY Pietruszko & Gradzki, 2003 Wired GC (1kWp) DAQ unit Go, G1, Ta, Tm, Sv Vpv, Vac, Ipv, Iac, Pac, Eac, Z, f 5m PC None Koutroulis & Kalaitzakis, 2003 Wired: PCI bus H: PV and wind PCI-6024E Ta, G, H, SWC, Ts, ɸq, SDir, W/Gs, Sv, p Vpv, Ipv, Vb, Ib, W/Gv, W/Gc 1m PC LabVIEW Kalaitzakis, Koutroulis, & Vlachos, 2003 Wire-less: RF H: PV and wind DAQ unit Sw, SDir, Ta, H, p, G, Ts, ɸq, SWC Vpv, Ipv, W/Gv, W/Gc, W/Gs, Vb, Ib
1m Web Using java applet interface Krauter, 2004 Wire-less: Satellite SA (5kWp) µc G Ppv, Vb, Pb, Pac 15m Web None Papadakis, Koutroulis, & Kalaitzakis, 2005 Wire-less: RF H: PV and wind PCI DAQ card Ta,H, p, G, Sw, SDir, Ts, ɸq, SWC W/Gv, W/Gc, W/Gs, Vpv, Ipv, Vb, Ib 1m Web VB, SQL server 2000 Forero, Hernández, & Gordillo, 2006 Wired: RS232 SA FP DAQ board Ta, G Vpv, Ipv, Epv, Ppv, Voc, Isc, FF, η, Pmax <30s PC LabVIEW Soler-Bientz, Ricalde-Cab, & Solis-Rodriguez, 2006 Wired: RS232 SA FP Tm, Ta, G Vpv, Ipv, Ppv, Vb, Ib 1m PC LabVIEW Gagliarducci, Lampasi, & Podestà, 2007 Wire-less: GSM SA FP DAQ G Ppv, Epv, DC Pl, AC Pl, Vpv, ηave, γ, γr, LC 1m PC LabVIEW Drews et al., 2007 Wired GC (5kWp) - G, Ta Ppv 1hr PC None
‘Table 2.2: Summarize of previous monitoring works, continued’ Wor k d on e b y Dat a tr an sfe r m ec h an ism PV syst em t yp e Contr oll er Parameters S amp. i n te rva l M on itor in g m ethod S of tw ar e/ lan gu age Met. Elec. Rosiek & Batlles, 2008 Wire-less: GSM/ GPRS WS ATmega 16 PAR, G, H, Ta None 10s PC None Boonmee, Plangklang, & Watjanatepin, 2009 Wired GC (5kWp) DAQ card G Vpv, Ipv, Ppv, Vac, Iac, Pac, Eac - PC None Benghanem, 2009b Wire-less: RF WS PIC 16F877 H, Ta, p, G, Sw, SDir None 1hr PC LabVIEW Benghanem, 2009a Wire-less SA PIC 16F877 Ta, G Vpv, Ipv - PC Matlab Benghanem, 2010 Wire-less: TX500 2, RX500 2 WS PIC 16F887 Rainfal l, Sw, SDir, Ta, H, p, G None 1m We b LabVIEW Ayompe, Duffy, McCormack, & Conlon, 2011 Wired (RS485 ) GC (1.72 kWp) DAQ unit Tm, Ta, G, Sw, Epv, Eac 5m PC None
Anwari, Dom, & Rashid, 2011 Wired: RS232 GC (700Wp ) PIC 16F877a Ta, G Vpv, Ipv 1s PC MPLAB, LabVIEW Ranhotigamage & Mukhopadhyay, 2011 Wire-less: Zigbee SA µc G, Ta Voc, Isc, Pmax, Vmax, Imax 1s/ less PC None Boonmee, Plangklang, & Watjanatepin, 2009 Wired GC (5kWp) DAQ card G Vpv, Ipv, Ppv, Vac, Iac, Pac, Eac - PC None Wittkopf, Valliappan, Liu, Ang, & Cheng, 2012 Wired GC (142.5 kWp) - G, Tm, Ta, Sv, SDir, Vac, Iac, Eac 5m PC Matlab Carullo & Vallan, 2012 Wired GC NI DAQ card Ta, H, Tm, Go, G1 Vpv, Ipv, Vac, Iac, Ppv, Pac, Epv, Eac 1m PC LabVIEW
‘Table 2.2: Summarize of previous monitoring works, continued’
2.5.2 Previous Zigbee Monitoring Applications
Wide range of Zigbee applications extended to home energy management system. Han, Lee, Park, Standby and Outlet (2009) proposed remote-controllable and energy-saving room architecture. By using Zigbee as the controller with enhance infrared code functionality, user are able to control power outlets and other home appliances. The results proved that power consumption was reduced after implementing the system. In 2011, Han, Choi, and Lee (2011) extended their research by reducing standby power consumption by turning off a home device and the power outlet simultaneously through the ZigBee hub. This method eliminates the waiting time of a typical automatic power cut-off outlet. Hwang, Choi, and Kang (2010) built an enhanced self-configuration (ESC) scheme to improve robustness of conventional Zigbee-based home automation system. The proposed system helps in solving node failure or frequent link breakages problem. Nowadays, technology growth increases development of smart home. Han and Lim (2010) integrated Zigbee sensor networks with home to build a new smart home energy management system. Hence, produce more intelligent and automatic home. The main objective of the system is to manage energy more efficiently while conserving the
Wor k d on e b y Dat a tr an sfe r m ec h an ism PV syste m type Contr oll er Parameters S amp. in te rval Mon itor in g m ethod S of tw ar e/ lan gu age Met. Elec. Park, Shen, Kim, & Rho, 2012 Wire/ wire-less: Etherne t SA (50kW) HMI, PLC None Vpv, Ipv, Ppv, Vl, Il, Pl, f, PF - PC Autobase López, Mantiñan, & Molina, 2012 Wire-less: Zigbee GC (1.28 kWp) DSP Sw, G, Ta, Tm Vac, Iac, P, Q, S, Vpv, Ipv, Ppv - PC C, LabVIEW
In order to improve electrical safety in building, a monitoring protection system based on Zigbee has been developed and installed (Huang, Chang, Chen, & Kuo, 2011). The system consists of traditional remote control functions, and branch circuit protection strategy to prevent overloading or overheating of outlets. Leccese (2013) designed remote control system that able to enhance management and efficiency of street lighting systems based on Zigbee wireless device. He utilized Zigbee point to point communication to obtain street lamps state and to take actions in case of failure. Chae, Yoo, Kim, and Cho (2012) developed a WSN system to monitor bridge suspension. They integrate Zigbee with Code Division Multiple Access (CDMA) to ensure wide range coverage for monitoring.
In manufacturing environment, Lu (2011) introduced a plug-and-play data gathering system based on Zigbee network. The system includes system simulator, instrument definition module and network monitor module. The system was built to enable users to plug-and-play in production system and automatically capturing production data. In order to enhance safety quality in factories, Sung and Hsu (2011) proposed a remote monitoring system based on Zigbee embedded system. It was built for unified monitoring with the real-time processing capabilities. The control interface was developed using LabView.
In construction industry, safety of the workers is important. Barro-Torres, Fernández-Caramés, Pérez-Iglesias, and Escudero (2012) developed a device to monitor the use of personal protective equipment (PPEs) by the workers. This device was developed by combining Zigbee mesh network topology with Radio Frequency Identification Devices (RFID) technologies. The device was sewn to workers clothing and send monitoring data to central unit for supervision. Zigbee not only applies to factories needs but also applicable to car industry.
Automation industry also utilized Zigbee as communication medium. Tsai, Tonguz, Saraydar, Talty, and Ames (2007) built an inta-car WSN based on Zigbee. Experiments done shown that Zigbee network has high potential in intra-car WSN implementation. Practical problems such as engine noise, interference and location of sensors may affect packet error rate but this problem is solvable. North American are concerns about the safety and security of their railroad industry. However, train arrangement‟s requires sensors to be placed in long linear network topology. The main concern is WSN addressing. In order to overcome this problem, Shrestha et al. (2013) proposed a heterogenous multihop network approach by integrating Wifi and Zigbee. Results obtained shown that delay and packet losses are reduced when integrating Wifi and Zigbee.
In agriculture, monitoring systems capable of measuring animal behavioral parameters utilizing Zigbee communication network has been designed. Nadimi, Jørgensen, Blanes-Vidal, and Christensen (2012) build a 2.4 GHz ZigBee-based mobile ad hoc wireless sensor network (MANET) to monitor sheep head movements. Two relay nodes were applied to the monitoring system in order to improve network connectivity. Multi-hop communication and handshaking protocol lead to high efficiency of network communication and low energy consumption. Morais et al. (2008) introduced a wireless acquisition device for remote sensing applications in precision viticulture. The main concern is device power management system and connectivity failures. Proposed system proved that due to Zigbee low power consumption, Zigbee could be power up from batteries that were charged from energy harvested in solar energy and kinetic energy sources. Author‟s design nodes solved connectivity problem.
In the field of environmental monitoring, Junxiang and Jingtao (2011) have built a WSN based on Zigbee protocol. By combining WSN and CDMA, data were sent
directly to database server on control center and hence made the data accessible in real time. Mirabella and Brischetto (2011) investigates wired/wireless network in monitoring farm made up of several greenhouses. They integrated Zigbee with Controller Area Network and proposed a suitable multiprotocol network to hide differences between two protocols. This made all devices belong to a single network and easy to control.
In Queensland, Australia, WSN-based framework to monitor marine environment have been implemented by Alippi, Camplani, Galperti and Roveri (2011). The proposed system was built to monitor underwater luminosity and temperature and corraline barrier‟s status. Data obtained also gives quantitative indication related to cyclone formations in tropical areas. Each WSN device equipped with adaptive solar-energy-harvesting mechanisms and tandem batteries to prolong battery lifetime.
Besides that, Zigbee are also beneficial to health and medical sector. Malhi, Mukhopadhyay, Schnepper, Haefke and Ewald (2012) built non-invasive wearable monitoring device to monitor physiological parameters such as skin temperature, heart rate and body impact. This device utilized Zigbee as communication medium. Data obtained from monitoring device were sent to receiver unit using Zigbee. The device helps in monitoring elderly patients who needs constant lookout. Besides that, this device also easily adapted to monitor athletes and infants. Furthermore, it was equipped with panic button to notify user in case of emergency.
The deployment of Zigbee in monitoring applications also extended to renewable energy systems. Batista, Melício, Matias, and Catalão (2013) installed Zigbee system to photovoltaic and wind energy systems. They have proven proficiency of the ZigBee devices for monitoring real-time data in distributed renewable generation and smart metering systems, making them valuable, flexible and robust assets within a smart grid. Hong, Kang, and Park (2012) built Intelligent Energy Distribution Management (iEDM)