Deposit Insurance around the World:
A Comprehensive Database
Asli Demirgüç-Kunt
(World Bank)
Baybars Karacaovali
(University of Maryland)
Luc Laeven*
(World Bank and CEPR)
World Bank Policy Research Working Paper 3628, June 2005
The Policy Research Working Paper Series disseminates the findings of work in progress to encourage the exchange of ideas about development issues. An objective of the series is to get the findings out quickly, even if the presentations are less than fully polished. The papers carry the names of the authors and should be cited accordingly. The findings, interpretations, and conclusions expressed in this paper are entirely those of the authors. They do not necessarily represent the view of the World Bank, its Executive Directors, or the countries they represent. Policy Research Working Papers are available online at http://econ.worldbank.org.
* Demirgüç-Kunt: World Bank (E-mail: [email protected]); Karacaovali: University of Maryland (E-mail: [email protected]); Laeven: World Bank, and Centre for Economic Policy Research (E-mail: [email protected]). We are very grateful to Guillermo Noguera for providing excellent research assistance and to numerous colleagues at the World Bank, the International Association of Deposit Insurers, and officials of deposit insurance agencies, Ministries of Finance, and Central Banks around the world for providing input for the deposit insurance database.
WPS3628
Public Disclosure Authorized
Public Disclosure Authorized
Public Disclosure Authorized
Abstract
This paper updates the Demirgüç-Kunt and Sobaci (2001) cross-country deposit
insurance database and extends it in several important dimensions. This new dataset
identifies both recent adopters and the ones that were not covered earlier due to a lack of
data. Moreover, for the first time, it provides historical time series for several variables
and adds new ones. The data were collected by surveying deposit insurance institutions
and related agencies as well as through the use of various other country sources.
Keywords: Deposit insurance; Deposit protection; Deposit coverage; Banking.
JEL Classification: G21, G28.
1. Introduction
This paper presents and discusses a new deposit insurance database that updates an
earlier one constructed in 1999 by Demirgüç-Kunt and Sobaci (2001) and extends it in
several important dimensions.
This new comprehensive database includes 14 new countries that have adopted
deposit insurance schemes since 1999
1and identifies 12 other countries
2that had adopted
deposit insurance as of 1999 but do not appear in Demirgüç-Kunt and Sobaci (2001) due
to lack of data. Apart from the use of various country sources, we have carried out
surveys directed to officials of deposit insurance institutions, central banks, and related
government officials around the world. The other important contribution of this dataset is
the addition of historical time series (rather than data for year-end 1999 only) for several
key variables, including deposit insurance coverage, coverage ratios, and co-insurance.
The variables are also expanded to include the level of co-insurance requirements,
percentage of the value of deposit covered, and whether the payments are per depositor or
per depositor per account. Finally, the dataset incorporates part of the survey data
relevant for deposit insurance provided by Barth, Caprio and Levine (2004).
Deposit insurance has become an increasingly used tool by governments in an
effort to ensure the stability of banking systems and protect bank depositors from
incurring large losses due to bank failures. Almost all countries actually have financial
safety nets in place which include explicit and implicit deposit insurance, bank regulation
and supervision, central bank lender of last resort facilities, and bank insolvency
resolution procedures. Although deposit insurance is gaining in popularity among
policymakers, its desirability is debated by many economists who point to the moral
hazard problems involved and the accompanying excessive risk taking by banks (see, for
example, Demirgüç-Kunt and Kane 2002).
This paper aims to support the recently growing empirical literature that deals with
the effects of deposit insurance design on different banking outcomes (for example,
1 The new adopters are Albania (2002), Bolivia (2001), Cyprus (2000), Jordan (2000), Malta (2003),
Nicaragua (2001), Paraguay (2003), Russia (2003), Serbia and Montenegro (2001), Slovenia (2001), Turkmenistan (2000), Vietnam (2000), Uruguay (2002), and Zimbabwe (2002) where the adoption years are indicated in parentheses.
2 These countries are Algeria, Bahamas, Belarus, Bosnia and Herzegovina, Guatemala, Honduras,
Demirgüç-Kunt and Huizinga 2004, Demirgüç-Kunt and Detragiache 2002, and Laeven
2004) by providing detailed data on features of deposit insurance schemes around the
world in an empirically usable format. We present the salient features of the data in detail
with countries grouped according to income level and geographical region.
The paper is organized as follows. Section 2 discusses the adoption of deposit
insurance around the world and section 3 describes the main database. Section 4
discusses main features of the deposit insurance schemes and section 5 concludes. The
database, country details and sources are presented in the appendix.
2. Deposit insurance adoption
As Demirgüç-Kunt, Kane and Laeven (2005) point out, every country has a de facto
implicit deposit insurance scheme (IDIS) in place since governments get pressed for
relief at the breakout of a large systemic banking distress. We assume that if an explicit
deposit insurance scheme (EDIS) does not exist, then the country has implicit deposit
insurance.
Figure 1 displays a map of the world depicting a detailed characterization of
deposit insurance adoption around the world as of 2003. The countries with EDIS are
colored grey, whereas the countries with IDIS are colored white. Moreover, the figure
denotes the countries that provided full guarantees with striped shading and the adopters
after 1995 are marked with a star. Figure 2 provides the number of countries with EDIS
and IDIS in our sample of 181 countries based on their income level, and Table 1 enlists
their names.
3Figure 3 and Table 2 provide similar information for middle and
low-income countries where the countries are grouped according to their geographical region.
As of 2003, 88 countries adopted EDIS, whereas the remaining 93 countries in our
sample are considered to have IDIS (Table 1 and Figure 2).
4As shown in Table 3, the adoption of EDIS seems to increase with income level;
16.39% of low-income countries have an EDIS, whereas the ratio goes up to 60.71% for
upper-middle-income and to 75% for high-income countries. When the proportion of
countries with EDIS is computed based on their GDP, hence how large their economies
3 Gibraltar is excluded from Table 1 and Figure 2 due to lack of data as well as the other tables and figures
are, the proportions rise to 96.35% for high-income countries and to 78.11% for
low-income countries (Table 3). The proportions based on GDP per capita are very similar to
the ones based on the number of countries (Table 3).
Among the middle and low-income countries, the occurrence of EDIS seems to be
higher in Europe and Central Asia (74.07%) and Latin America and Caribbean (66.67%),
whereas it is the lowest in Sub-Saharan Africa (10.87%) (Table 3). The occurrence rates
go up to approximately 98% for both European and Central Asian, and Latin American
and Caribbean countries when proportions are based on GDP.
The United States is the first in history to adopt an EDIS which dates back to 1934
– a year marked by a banking crisis.
5As shown in Figure 4, this was followed in 1960s
by nine other countries and the trend has been dramatically upward especially since
1980s reaching a total of 88 countries in 2003 which is a quadruple of the 1984 figure. In
1994, deposit insurance became the standard for the newly created single banking market
of the European Union (EU). Until 1990s the EDISs mostly prevailed and kept building
in high income countries but since 1995 we have observed a surge to EDISs in especially
lower middle income countries (Figure 4). This is partly driven by the Eastern and
Central European transition economies which eventually became or are expected to
become EU members although EDISs remain quite prevalent in Latin America and
Caribbean as well, thanks to the generally accepted best practice advice given to the
developing countries (Folkerts-Landau and Lindgren 1998, and Garcia 1999).
3. The database
The database builds on Demirgüç-Kunt and Sobaci (2001) as mentioned in the
introduction. A large section of their database was constructed by the survey results of an
International Monetary Fund working paper (Garcia 1999) and earlier sources such as
Kyei (1995) and Talley and Mas (1990) augmented by some other country sources. We
further complement and improve the database through various other country and online
4 There is no data available for Andorra, Monaco, San Marino, and Vatican City so they are not included in
the dataset.
5 In Norway there was a guarantee fund for savings banks with voluntary membership in 1921 which
became obligatory in 1924, whereas a guarantee fund for commercial banks was first introduced in 1938 (Gerdrup 2003). However, Norway’s guarantee fund is not considered a pure deposit insurance scheme so they had no official explicit deposit insurance until 1961.
sources as well as a survey of deposit insurers. One of the main improvements is the
introduction of historical data on coverage and co-insurance, introducing a time series
aspect to the data. Another major data source is the survey carried out by the International
Association of Deposit Insurers in 2002-03. The main cross-country part of the database
comprises readily usable data for empirical and statistical analysis where most variables
are coded as indicators along with explanatory details. We present the main database in
the appendix section A.1. The details of the data for each country with references to the
sources are covered in the appendix section A.2 and the detailed data sources are given in
the appendix section A.3.
The electronic version of the full dataset
6is available online at the Finance
Research website of the Development Economics Research Group, World Bank. The
complete database includes the full coverage ratio data spanning 1960 to 2003 for all
countries, where applicable. In the following sections we describe the dataset and the
included variables and discuss main features of explicit deposit insurance systems around
the world.
3.1 Explicit versus implicit deposit insurance
EDISs differ from IDISs due to their reliance on formal regulation through central bank
law, banking law, or the constitution and so on. The relevant law explains the main
ingredients of the deposit insurance such as the beginning date, coverage limits, how (if
any) they are going to be funded, and how bank failures will be resolved.
If such regulation is not present for deposit insurance, we assume that the DIS is
implicit, relying on the observation that every country establishes a de facto insurance
system for banks.
The variables related to the type of deposit insurance available in each country
comprise of the following:
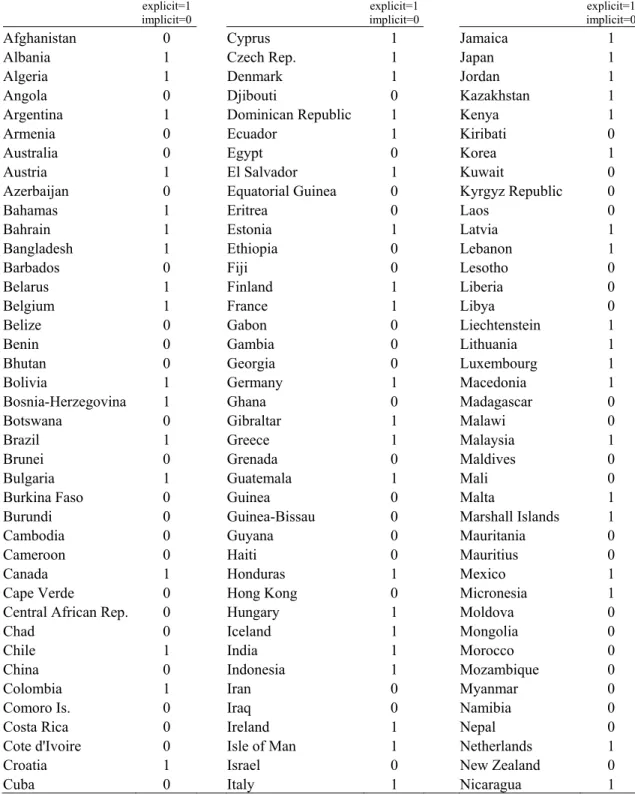
a) Type:
This variable identifies the form of the deposit
insurance – explicit or implicit – present in each country.
The variable takes the value of
one for countries with EDIS, and zero otherwise (Table A.1.1).
b) Date Enacted /
6 The data is available as an Excel workbook consisting of three worksheets. The first worksheet includes
the main cross-country dataset, the second worksheet provides historical levels of coverage limits and co-insurance, and finally the third worksheet provides the coverage ratios (coverage limits as a share of GDP per capita).
Revised:
This variable provides the year in which an EDIS was first enacted along with
the year in which the system was later revised, if applicable (Table A.1.2).
3.2 Coverage
EDISs vary in their extent and amount of coverage. EDISs also differ in the types of
deposits and institutions they apply to. For example, countries which would like to
protect their payments systems only, limit the guarantee of EDISs to deposits with
commercial banks and to other depository institutions providing payment transactions.
On the other hand some EDISs may extend guarantees to other types of institutions such
as savings banks, if they involve a wide-ranging objective.
Some countries have adopted different sets of EDISs that apply to different types of
institutions. Usually there exists one EDIS for commercial banks and one for other
deposit taking institutions. For example, Japan, France, Germany, and Norway have two
separate EDISs, whereas Spain has three. For countries that have more than one EDIS,
the database provides information on the EDIS for commercial banks only. However, in
section A.2., we provide detailed information on each country’s system along with
relevant laws and names of institutions.
Depending on the objective of the EDIS, the coverage varies based on different
types of deposits. In most cases, foreign deposits of domestic banks, domestic deposits of
foreign banks, inter-bank deposits, and deposits denominated in foreign currencies are
not covered under the EDISs. The database provides information on the coverage for
inter-bank deposits, and foreign currency denominated deposits.
3.2.1 Foreign currency deposit coverage
The variable named “
Foreign Currencies
” takes the value one for systems that cover
foreign currency denominated deposits, and zero otherwise (Table A.1.2). However,
some EDISs are restrictive in the set of foreign currencies they cover. For instance,
Hungary extends coverage to deposits denominated in EUR or currencies of other OECD
countries.
7This variable takes the value one for such countries as well.
3.2.2 Inter-bank deposit coverage
The EDISs mostly do not cover inter-bank deposits since unlike small depositors, banks
are perceived to have enough resources to monitor other banks. Thus, extending coverage
to inter-bank deposits could reduce the incentives to supervise other banks and undermine
the market discipline. The countries with inter-bank deposit coverage are listed in Table 4
grouped by income level. The only two high-income countries with this feature are
Canada and United States. Interestingly, some eight lower-middle-income countries also
provide it (Table 4).
In the database, the variable named “
Inter-Bank Deposits
” takes the value one for
EDISs that extend coverage to inter-bank deposits and zero otherwise (Table A.1.2).
3.2.3 Amount of coverage
The amount of coverage matters since it directly affects the market discipline exerted by
depositors. If the coverage is low, then better and more reliable banks will be preferred
by depositors. On the other hand, this is partly against the objectives of the deposit
insurance that protects small depositors who lack the resources to evaluate the soundness
of banks. However, very high coverage limits could inhibit any form of monitoring on the
depositors’ end and downplay market discipline.
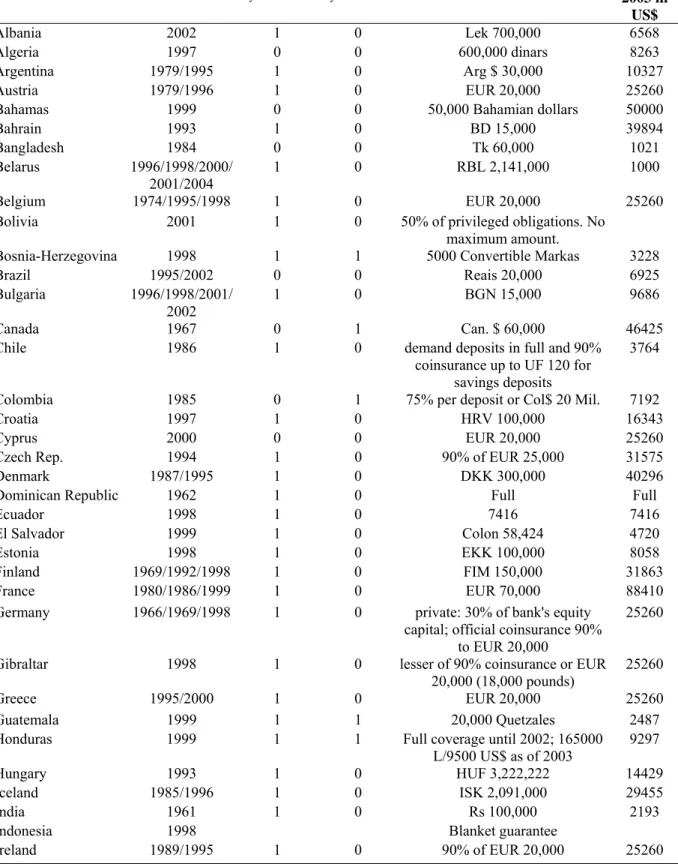
In Table A.1.2, the following variables on the amount of coverage are listed:
a) Coverage Limit as of 2003:
This variable provides the details on the amount of
coverage and co-insurance. More specifically, the provided information includes the
currency in which the coverage is reported, the coverage limit and whether it is a full
coverage; the percentage of the deposits covered if co-insurance exists and the structure
of co-insurance.
b) Coverage Limit as of 2003 in US$:
Expresses the coverage limit in
US dollars.
Some countries provide unlimited coverage which usually emerges in response to
banking crises. For example, as of 2003 Dominican Republic, Indonesia, Malaysia,
Thailand, Turkey, and Turkmenistan had full guarantees.
Similarly, other countries, such
as Ecuador, Japan, and Mexico, had full coverage in the past that was revoked after the
crises seemed to abate. The historical series of the coverage provided are presented in
Table A.1.7 and are discussed further below in section 3.5.
3.2.4 Co-insurance
Some countries have adopted co-insurance mechanisms that require depositors to bear
part of the cost in case of a banking failure. Thus, it is aimed to get depositors to make
more prudent bank choices in their deposit decision. As of 2003 there were 21 EDISs
with co-insurance. Table 5 lists these countries and the co-insurance requirement by
depositors for each country. Co-insurance does not exist in low-income countries but
otherwise gets more and more prevalent the higher the income level (Table 5).
In Table A.1.3, the following variables related to co-insurance are listed:
a)
Co-insurance:
This variable takes the value of one if the country requires a co-insurance,
and zero otherwise.
b) Co-insurance percentage:
This variable provides the percentage
of the deposit amount the depositors are responsible for and hence lose in case of a bank
failure.
The historical values of the co-insurance requirements are given in Table A.1.7 and
are discussed further below in section 3.5.
3.2.5 Extent of coverage
The EDISs differ in terms of the extent of their coverage as well. In most countries the
coverage is per depositor which means that the sum of deposits per depositor is protected
up to the applicable limit. However, some countries provide protection per depositor per
account, hence the actual amount of coverage is higher for persons with multiple
accounts. In Table A.1.3 the variable “
Payment
” takes the value one if the protection is
per depositor and zero if it is per depositor per account.
3.2.6 Coverage distribution
We observe varying degrees of deposit values being covered in different EDISs across
the world. In Table A.1.3 the variable “
Percentage of deposit value covered
” provides
the extent of total protection coverage as a share of total deposit value in each country.
This variable takes the maximum value of 100% for countries that provide full coverage
and is less than 100% for the rest, which average around 48%. In Table A.1.3 the source
of information and the reference year on this coverage distribution is also provided under
the variables labeled “
Information source of coverage distribution
” and “
Reference date
of data on coverage distribution
”, respectively.
3.3 Funding
EDISs can be either funded or unfunded. In funded systems the member institutions need
to make periodic contributions to the fund, which is then used as the main source for
paying out depositors during bank failures. In a minority of the countries, which mainly
belong to the high-income category, there are unfunded systems, where members have to
contribute to the fund after the failure. Chile is an exception, where the government is the
sole contributor of the fund. As of 2003, only 14 countries
8out of 88 had unfunded
EDISs and 11 of these countries was European.
3.3.1 Premiums
In Table A.1.4, the variable labeled “
Annual Premiums
” provides information on the
premiums required as a percentage of the base as well as whether it involves a variable or
fixed rate and is risk-based.
Assessment bases for premiums vary across different systems. Premiums are
generally based on deposits and insured deposits. However, some systems are based on
domestic or all obligations of the banks. The related variable is listed in Table A.1.4 and
is named “
Premium or assessment base
”.
Premiums may vary according to the riskiness of the assessment base which are
then called risk-adjusted premiums. As of 1995 only United States had a system with
risk-adjusted premiums. Since then, the number of countries with risk-adjusted DISs has
gone up to 20, which are listed according to income category in Table 6. In Table A.1.4
the variable labeled “
Risk-adjusted premiums
” takes the value one if premiums are
risk-adjusted, and zero otherwise.
3.3.2 Funding source, administration and membership
Public funding may be available in addition to premiums contributed by banks. Public
funds may be initial contributions or losses taken ex-post by the government or they
might simply be in the form of central bank loans. The funds might also be a combination
of both private and public. In Table A.1.5 the variable labeled “
Source of funding
” takes
the value of two if the EDIS is funded by the government only, zero if funded privately
only, and zero if jointly funded.
8 Countries with unfunded EDISs are: Austria, Bahrain, Chile, France, Gibraltar, Isle of Man, Italy,
The variable “
Administration
” in Table A.1.5 takes on three values; one if the
administration of the fund is official, two if it is joint, and three if it is private. If the
EDIS of a country is administered by the central bank, it is considered to have an official
administration. Moreover, some privately administered institutions have limited
authorities. For example, in Italy and Croatia certain decisions need to go through the
central bank approval, hence the EDISs of these countries are considered to have a joint
administration in the database.
Finally, the variable “
Membership
” in Table A.1.5 takes the value one if the
membership to the fund is compulsory and zero if it is voluntary. Majority of the
countries have compulsory membership, whereas only ten percent of them employ a
voluntary system.
93.4 Barth, Caprio, and Levine (2004) survey questions
We also incorporate the deposit insurance related survey results from Barth, Caprio, and
Levine (2004) database on banking regulation and supervision. All of the data is coded
for empirical use and presented in three different panels in Table A.1.6.
10The variables in this section and the way they are coded are as follows: 1)
Does the
deposit insurance authority make the decision to intervene a bank?
The answer “Yes” is
coded with one and “No” with zero (panel A). 2)
Does the deposit insurance authority
have the legal power to cancel or revoke deposit insurance for any participating bank?
The answer “Yes” is coded with one and “No” with zero (panel A). 3)
As part of failure
resolution, how many banks closed or merged in the last 5 years?
The number of banks is
reported (panel A). 4)
Were depositors wholly compensated (to the extent of legal
protection) the last time a bank failed?
The answer “Yes” is coded with one and “No”
with zero (panel A). 5)
On average, how long does it take to pay depositors in full?
The
number of months is reported (panel B). 6)
What was the longest that depositors had to
wait in the last 5 years?
The number of months is reported (panel B). 7)
Were any
deposits not explicitly covered by deposit insurance at the time of the failure
compensated when the bank failed (excluding funds later paid out in liquidation
9 The membership is voluntary in the following countries: Dominican Republic, Kazakhstan, Marshall
Islands, Micronesia, Sri Lanka, Switzerland, and Taiwan.
10 The countries which did not provide answers for any of the survey questions are excluded from the
procedures)?
The answer “Yes” is coded with one and “No” with zero (panel B). 8)
Can
the deposit insurance agency/fund take legal action against bank directors or other bank
officials?
The answer “Yes” is coded with one and “No” with zero (panel C). 9)
Has the
deposit insurance agency/fund ever taken legal action against bank directors or other
bank officials?
The answer “Yes” is coded with one and “No” with zero (panel C).
10)
Are non-residents treated differently than residents with respect to deposit insurance
scheme coverage?
The answer “Yes” is coded with one and “No” with zero (panel C).
3.5 Time series: Coverage limits, co-insurance, and coverage ratios
The database includes time series data for co-insurance and coverage limits. The limits
and the co-insurance requirements since the year of EDIS adoption and the revisions to
them over time are presented in Table A.1.7. The amount of coverage is seen to vary
across different schemes. They are also adjusted through time to account for inflation as
well as changing economic conditions. Table A.1.7 provides the coverage limits, the
currency they are measured in and the co-insurance percentages.
Finally, the database provides ratios of coverage amounts to GDP per capita and
deposits per capita, where all are expressed in local currency units. The sample years
span 1960 to 2003 in the main database online.
11The underlying data, that is GDP per
capita, total deposits, population, and coverage amounts, are also reported there. In Table
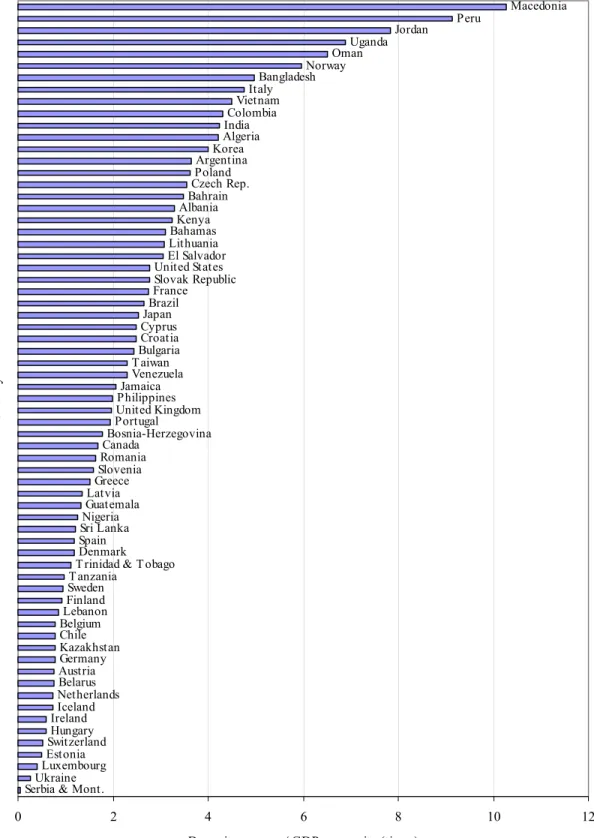
A.1.8 we present the two coverage ratios for 1999-2003. Figure 6 provides the ratio of
deposit coverage to GDP per capita in 2002 for selected countries. We see that the ratio is
quite high for some developing countries. For example, the coverage amount is about ten
times larger than the per capita income for the Former Yugoslav Republic of Macedonia.
This ratio is even starker for Nicaragua, where it is about twenty-seven in 2002 which
appears in Table A.1.8.
12The generosity of schemes if not matched with institutional
improvement can result in more fragility of financial systems.
11 The third worksheet of the database includes the coverage ratios. The online database is located at the
Finance Research website under datasets, World Bank.
4. Main features of the deposit insurance schemes around the world
The main features of the schemes are summarized in Table 7, where countries are
grouped based on their income level. The middle and low income countries are further
subdivided according to their geographical region. This section presents the observations
based on Table 7. Panel A provides the number of countries with each listed feature for
different income and regional categories. Panel B provides the proportion of countries
with each feature in a given category. Panels C and D provide the proportion of countries
with each feature weighted by their GDP and GDP per capita, respectively.
Foreign currency deposit coverage is prevalent in 76% of the countries; whereas it
is observed in 57% of the low-income countries and only 25% of the low and
middle-income countries located in Middle East and North Africa. The ratios weighted by GDP
and GDP per capita are also similar with the exception of Middle East and North Africa
region, where the ratio goes up to 50% with GDP per capita. Extension of coverage to
inter-bank deposits is not very common, amounting to 13 out of 80 countries (16%) with
data for this variable. It is mostly observed in lower middle and low-income countries
(29% in each), and among them mostly in the Asia and Pacific region (57% of them).
Co-insurance is not required by low-income countries and is otherwise required by about a
third of the countries. Among the middle-income countries, it is most prevalent in the
Middle East and North Africa region. Most countries, 79% in total, calculate the coverage
on a per depositor (per institution) basis.
Almost all schemes are permanently funded except the ones in high-income
category, where 37% of them have no permanent fund and contributions are usually
called upon, if deemed necessary, on an ex-post basis. Premiums are not risk-adjusted in
the low-income category and it is also uncommon in other categories where some 23% of
the countries employ this feature. Membership to the schemes is compulsory in 90% of
the countries. The only exception is the Asia and Pacific Region, where 50% of the group
has a voluntary membership. The funding is pre-dominantly provided jointly by private
and public resources, in 63% of the countries. Only Chile has a sole public funding but in
most countries, government at least provides the initial capital if not the subsequent
funding needs. Sole private funding is more widespread in the high income category,
where half of them have a privately funded system. The schemes are mostly administered
officially (60%), followed by joint administration (26%). Private administration is highest
in the high income category, where 23% of the group has a privately administered
system.
5. Conclusion
This comprehensive database provides detailed information on the deposit insurance
schemes across the world as of 2003. It improves significantly over the earlier
Demirgüç-Kunt and Sobaci (2001) cross-country database. First, the database includes 14 new
countries that have adopted deposit insurance schemes since 1999 and identifies 12 other
countries with DISs as of 1999 that were not covered before. Second, the database uses
various country sources and surveys of deposit insurance agencies and officials around
the world, and hence completes and further details the other collected data. Third, this
dataset adds historical time series data, and covers the values of deposit insurance
coverage amounts, co-insurance, and coverage ratios since the inception of the first
nationwide scheme by the United States in 1934. Fourth, other new variables are
incorporated that include the level of co-insurance requirements, percentage of the value
of deposits covered, and whether the payments are per depositor or per depositor per
account.
The work here is part of a broader research project in understanding and
characterizing the design, and implementation of deposit insurance as analyzed in
Demirgüç-Kunt, Kane and Laeven (2005) using this data. Moreover, it will help and
hopefully stimulate further research on the effect of deposit insurance on financial
development, financial stability, fragility and market discipline. We provide the data in
an empirically usable format to contribute to this growing literature.
References
Barth, James R., Gerard Caprio, and Ross Levine. 2004. “The Regulation and
Supervision of Banks around the World: A New Database,” 2003 Version and
Update, Washington, DC: World Bank.
Demirgüç-Kunt, Asli, and Enrica Detragiache. 2002. “Does Deposit Insurance Increase
Banking System Stability? An Empirical Investigation,”
Journal of Monetary
Economics
, 49(7): 1373-1406.
Demirgüç-Kunt, Asli, and Harry Huizinga. 2004. “Market Discipline and Deposit
Insurance,”
Journal of Monetary Economics
, 51(2): 375-399.
Demirgüç-Kunt, Asli, and Edward Kane. 2002. “Deposit Insurance Around the World:
Where Does it Work?”
Journal of Economic Perspectives
16, 175-195.
Demirgüç-Kunt, Asli, Edward Kane, and Luc Laeven. 2005. “Determinants of Deposit-
Insurance Adoption and Design,” mimeo, World Bank.
Demirgüç-Kunt, Asli, and Tolga Sobaci. 2001. “A New Development Database: Deposit
Insurance around the World,”
World Bank Economic Review
, 15: 481-490.
Folkerts-Landau, David, and Carl-Johan Lindgren. 1998. “Toward a Framework for
Financial Stability,” mimeo, International Monetary Fund.
Garcia, Gillian. 1999. “Deposit Insurance: Actual and Best Practices,” IMF Working
Paper 99/54, Washington, DC: International Monetary Fund.
Garcia, Gillian. 2000. “Deposit Insurance: Actual and Good Practices,” Occasional Paper
No. 197, Washington, DC: International Monetary Fund.
Gerdrup, Karsten R. 2003. “Three Episodes of Financial Fragility in Norway since the
1890s,” BIS Working Paper No. 142, Basel: Bank for International Settlements.
Kyei, Alexander. 1995. “Deposit Protection Arrangements: A Comparative Study,” IMF
Working Paper 95/134, Washington, DC: International Monetary Fund.
Laeven, Luc. 2004. “The Political Economy of Deposit Insurance,”
Journal of Financial
Services Research
26(3), 201-224.
Talley, Samuel H., and Ignacio Mas. 1990. “Deposit Insurance in Developing Countries,”
Policy Research Working Paper, No. 548, Washington, DC: World Bank.
Figure 2. Adoption of deposit insurance around the world by income level
(as of 2003)Panel A: Explicit deposit insurance
30 17 30 10 0 5 10 15 20 25 30 35
High income Upper middle
income
Lower middle income
Low income
Number of countries
Panel B: Implicit deposit insurance
10 11 21 51 0 10 20 30 40 50
High income Upper middle
income
Lower middle income
Low income
Figure 3. Adoption of deposit insurance around the world by region*
(as of 2003)Panel A: Explicit deposit insurance
10 20 18 4 5 0 5 10 15 20 25
Asia & Pacific Europe &
Central Asia
Latin America & Caribbean
Middle East & North Africa
Sub-Saharan Africa
Number of countries
Panel B: Implicit deposit insurance
16 7 9 10 41 0 5 10 15 20 25 30 35 40 45
Asia & Pacific Europe &
Central Asia
Latin America & Caribbean
Middle East & North Africa
Sub-Saharan Africa
Number of countries
Figure 4. Trends in the adoption of explicit deposit insurance by income level
Panel A: All income categories
0 10 20 30 40 50 60 70 80 90 1934 1962 1966 1969 1974 1977 1980 1983 1985 1987 1989 1992 1994 1996 1998 2000 2002 Year Number of countries
High income Upper middle income Lower middle income Low income
Panel B: High income category versus others
0 10 20 30 40 50 60 70 80 90 1934 1962 1966 1969 1974 1977 1980 1983 1985 1987 1989 1992 1994 1996 1998 2000 2002 Year Number of countries
Figure 5. Trends in the adoption of explicit deposit insurance by region*
All regional categories*
0 10 20 30 40 50 60 1961 1963 1975 1983 1985 1987 1991 1994 1996 1998 2000 2002 Year Number of countries
Asia & Pacific Europe & Central Asia Latin America & Caribbean
Middle East & North Africa Sub-Saharan Africa
Figure 6. Ratios of deposit coverage to GDP per capita in selected countries, 2002
Serbia & Mont.Ukraine LuxembourgEstonia SwitzerlandHungary IrelandIceland NetherlandsBelarus AustriaGermany Kazakhstan Chile BelgiumLebanon FinlandSweden
T anzaniaT rinidad & T obago Denmark SpainSri Lanka
NigeriaGuatemala LatviaGreece
SloveniaRomania
CanadaBosnia-Herzegovina PortugalUnited Kingdom
PhilippinesJamaica Venezuela T aiwanBulgaria Croatia CyprusJapan BrazilFrance Slovak Republic United StatesEl Salvador
LithuaniaBahamas KenyaAlbania
BahrainCzech Rep. PolandArgentina KoreaAlgeria IndiaColombia VietnamItaly BangladeshNorway OmanUganda Jordan Peru Macedonia 0 2 4 6 8 10 12 Country
Table 1. Adoption of deposit insurance around the world by income level
(Years of establishment/revision in parentheses and number of countries by group in brackets, as of 2003)
Panel A: Explicit Deposit Insurance
High income countries [30]
Austria (1979/1996) France (1980/1986/1999) Korea (1996) Spain (1977/1996) Bahamas (1999) Germany (1966/1969/1998) Liechtenstein (1992/2003) Sweden (1996) Bahrain (1993) Greece (1995/2000) Luxembourg (1989) Switzerland (1984/1993) Belgium (1974/1995/1998) Iceland (1985/1996) Malta (2003) Taiwan (1985)
Canada (1967) Ireland (1989/1995) Netherlands (1978/1996/1998) United Kingdom (1982/1995) Cyprus (2000) Isle of Man (1991) Norway (1961/1997) United States (1934/1991) Denmark (1987/1995) Italy (1987/1996) Portugal (1992/1995)
Finland (1969/1992/1998) Japan (1971) Slovenia (2001)
Upper middle income countries [17]
Argentina (1979/1995) Hungary (1993) Mexico (1986/1990/1999) Uruguay (2002) Chile (1986) Latvia (1998) Oman (1995) Venezuela (1985/2001) Croatia (1997) Lebanon (1967) Poland (1995)
Czech Rep. (1994) Lithuania (1996) Slovak Republic (1996/2001) Estonia (1998) Malaysia (1998) Trinidad & Tobago (1986)
Lower middle income countries [30]
Albania (2002) Colombia (1985) Kazakhstan (1999/2003) Russia (2003) Algeria (1997) Dominican Republic (1962) Macedonia (1996/2000/2002) Serbia and Montenegro (2001) Belarus Ecuador (1998) Marshall Islands (1975) Sri Lanka (1987)
(1996/1998/2000/2001/2004) El Salvador (1999) Micronesia (1963) Thailand (1997) Bolivia (2001) Guatemala (1999) Paraguay (2003) Turkey (1983/2000) Bosnia-Herzegovina (1998) Honduras (1999) Peru (1991) Turkmenistan (2000) Brazil (1995/2002) Jamaica (1998) Philippines (1963) Ukraine (1998) Bulgaria (1996/1998/2001/2002) Jordan (2000) Romania (1996)
Low income countries [10]
Bangladesh (1984) Kenya (1988) Tanzania (1994) Zimbabwe (2003) India (1961) Nicaragua (2001) Uganda (1994)
Indonesia (1998) Nigeria (1988/1989) Vietnam (2000)
Panel B: Implicit deposit insurance
High income countries [10]
Australia Brunei Israel New Zealand Singapore
Barbados Hong Kong Kuwait Qatar United Arab Emirates
Upper middle income countries [11]
Belize Costa Rica Grenada Mauritius Saudi Arabia St. Lucia Botswana Gabon Libya Panama Seychelles
Lower middle income countries [21]
Armenia Djibouti Iran Morocco Swaziland W. Samoa Cape Verde Egypt Iraq Namibia Syria
China Fiji Kiribati South Africa Tunisia Cuba Guyana Maldives Suriname Vanuatu
Low income countries [51]
Afghanistan Central African Rep. Ghana Malawi Pakistan Tajikistan Angola Chad Guinea Mali Papua New Guinea Togo Azerbaijan Comoro Is. Guinea-Bissau Mauritania Rep. of Congo Uzbekistan
Benin Cote d'Ivoire Haiti Moldova Rwanda Yemen
Bhutan Equatorial Guinea Kyrgyz Republic Mongolia Senegal Zaire Burkina Faso Eritrea Laos Mozambique Sierra Leone Zambia Burundi Ethiopia Lesotho Myanmar Solomon Is.
Cambodia Gambia Liberia Nepal Somalia Cameroon Georgia Madagascar Niger Sudan
Table 2. Adoption of deposit insurance around the world by region as of 2003*
(Years of establishment/revision in parentheses and number of countries by group in brackets, as of 2003)
Panel A: Explicit Deposit Insurance
Asia & Pacific [10]
Bangladesh (1984) Malaysia (1998) Philippines (1963) Vietnam (2000) India (1961) Marshall Islands (1975) Sri Lanka (1987)
Indonesia (1998) Micronesia (1963) Thailand (1997)
Europe & Central Asia [20]
Albania (2002) Czech Rep. (1994) Macedonia (1996/2000/2002) Turkey (1983/2000) Belarus Estonia (1998) Poland (1995) Turkmenistan (2000) (1996/1998/2000/2001/2004) Hungary (1993) Romania (1996) Ukraine (1998) Bosnia-Herzegovina (1998) Kazakhstan (1999/2003) Russia (2003)
Bulgaria (1996/1998/2001/2002) Latvia (1998) Serbia and Montenegro (2001) Croatia (1997) Lithuania (1996) Slovak Republic (1996/2001)
Latin America & Caribbean [18]
Argentina (1979/1995) Dominican Republic (1962) Jamaica (1998) Trinidad & Tobago (1986) Bolivia (2001) Ecuador (1998) Mexico (1986/1990/1999) Uruguay (2002)
Brazil (1995/2002) El Salvador (1999) Nicaragua (2001) Venezuela (1985/2001) Chile (1986) Guatemala (1999) Paraguay (2003)
Colombia (1985) Honduras (1999) Peru (1991)
Middle East & North Africa [4]
Algeria (1997) Jordan (2000) Lebanon (1967) Oman (1995)
Sub-Saharan Africa [5]
Kenya (1988) Tanzania (1994) Zimbabwe (2003)
Nigeria (1988/1989) Uganda (1994)
Panel B: Implicit deposit insurance
Asia & Pacific [16]
Afghanistan China Laos Myanmar Papua New Guinea W. Samoa Bhutan Fiji Maldives Nepal Solomon Is.
Cambodia Kiribati Mongolia Pakistan Vanuatu
Europe & Central Asia [7]
Armenia Georgia Moldova Uzbekistan Azerbaijan Kyrgyz Republic Tajikistan
Latin America & Caribbean [9]
Belize Cuba Guyana Panama Suriname Costa Rica Grenada Haiti St. Lucia
Middle East & North Africa [10]
Djibouti Iran Libya Saudi Arabia Tunisia
Egypt Iraq Morocco Syria Yemen
Sub-Saharan Africa [41]
Angola Central African Rep. Gabon Madagascar Niger South Africa Benin Chad Gambia Malawi Republic of Congo Sudan Botswana Comoro Is. Ghana Mali Rwanda Swaziland Burkina Faso Cote d'Ivoire Guinea Mauritania Senegal Togo Burundi Equatorial Guinea Guinea-Bissau Mauritius Seychelles Zaire Cameroon Eritrea Lesotho Mozambique Sierra Leone Zambia Cape Verde Ethiopia Liberia Namibia Somalia
*Excludes high income countries.
Table 3. Proportion of countries with explicit deposit insurance to total by category
(in percent, as of 2003)
Proportion based on
Category Number of countries GDP GDP per capita
By income level
High income 75.00 96.35 83.45
Upper middle income 60.71 86.20 63.26
Lower middle income 58.82 57.56 64.25
Low income 16.39 78.11 17.26
By geographical region*
Asia & Pacific 38.46 48.76 53.78
Europe & Central Asia 74.07 97.24 93.40
Latin America & Caribbean 66.67 98.34 71.11
Middle East & North Africa 28.57 16.36 42.84
Sub-Saharan Africa 10.87 17.12 3.63
*Regional breakdown excludes high income countries
Table 4. Explicit deposit insurance schemes which extend coverage
to inter-bank deposits by income level
(as of 2003)
High income Upper middle income Lower middle income Low income
Canada Lebanon Bosnia-Herzegovina Kenya
United States Colombia Nigeria
Guatemala Tanzania Honduras Marshall Islands Micronesia Philippines Thailand
Table 5. Explicit deposit insurance schemes with co-insurance by income level
(co-insurance requirements in parentheses, as of 2003)
High income Upper middle income Lower middle income
Austria (10%) Chile (10%) Albania (15%) Belgium (10%) Czech Rep. (10%) Belarus (20%) Cyprus (10%) Estonia (10%) Bolivia (50%) Germany (10%) Lithuania (10%) Colombia (25%) Ireland (10%) Oman (25%) Macedonia (10%) Isle of Man (25%) Poland (10%) Russia (50%) Luxembourg (10%) Slovak Republic (10%)
United Kingdom (10%)
Table 6. Explicit deposit insurance schemes with risk adjusted premiums
by income level
(as of 2003)
High income Upper middle income Lower middle income
Finland Argentina Belarus
Italy Hungary Bolivia
Portugal Uruguay Bulgaria
Sweden El Salvador
Taiwan Kazakhstan
United States Macedonia
Marshall Islands
Micronesia
Peru
Romania
Table 7. Design features of explicit deposit insurance schemes
(as of 2003)
Panel A: Number of countries with each feature in a given category
7.A.1. By level of income
Feature High income
Upper middle income
Lower middle
income Low income
Total number of countries
Foreign currency deposits covered 22 12 23 4 61 Inter-bank deposits covered 2 1 8 3 14
Co-insurance exists 8 7 6 0 21
Payment per depositor 23 15 21 7 66 Scheme is permanently funded 19 15 28 7 69 Premiums are risk-adjusted 6 3 11 0 20 Membership is compulsory 28 16 23 7 74 Source of funding Private 15 1 11 1 28 Joint 15 13 15 6 49 Public 0 1 0 0 1 Administration Official 14 10 19 6 49 Joint 9 5 7 1 22 Private 7 1 1 1 10 7.A.2. By region* Feature Asia & Pacific Europe & Central Asia
Latin America & Caribbean
Middle East & North Africa
Sub-Saharan Africa
Foreign currency deposits covered 5 19 12 1 2 Inter-bank deposits covered 4 1 3 1 3
Co-insurance exists 0 9 3 1 0
Payment per depositor 6 16 14 3 4
Scheme is permanently funded 6 20 16 4 4 Premiums are risk-adjusted 2 7 5 0 0 Membership is compulsory 3 19 16 4 4 Source of funding Private 2 5 5 1 0 Joint 4 14 9 3 4 Public 0 0 1 0 0 Administration Official 6 12 12 2 3 Joint 0 7 3 2 1 Private 0 0 2 0 1
Table 7. Design features of explicit deposit insurance schemes
(as of 2003, continued)
Panel B: Proportion of countries with each feature in a given category(in percent)
7.B.1. By level of income
Feature High income
Upper middle income
Lower middle
income Low income
Proportion in all countries
Foreign currency deposits covered 73 80 82 57 76 Inter-bank deposits covered 7 7 29 43 18
Co-insurance exists 27 44 21 0 25
Payment per depositor 77 94 72 78 79 Scheme is permanently funded 63 94 97 100 84 Premiums are risk-adjusted 20 19 39 0 25 Membership is compulsory 93 100 82 100 91 Source of funding Private 50 7 42 14 36 Joint 50 87 58 86 63 Public 0 7 0 0 1 Administration Official 47 63 70 75 60 Joint 30 31 26 13 27 Private 23 6 4 13 12 7.B.2. By region* Feature Asia & Pacific Europe & Central Asia
Latin America & Caribbean
Middle East & North Africa
Sub-Saharan Africa
Foreign currency deposits covered 71 100 75 25 40 Inter-bank deposits covered 57 5 19 25 75
Co-insurance exists 0 45 18 25 0
Payment per depositor 75 80 82 75 80 Scheme is permanently funded 86 100 94 100 100 Premiums are risk-adjusted 33 35 29 0 0 Membership is compulsory 50 95 94 100 100 Source of funding Private 33 26 33 25 0 Joint 67 74 60 75 100 Public 0 0 7 0 0 Administration Official 100 63 71 50 60 Joint 0 37 18 50 20 Private 0 0 12 0 20
Table 7. Design features of explicit deposit insurance schemes
(as of 2003, continued)
Panel C: The sum of the GDP of countries with each feature divided by the total GDP in a given category(in percent)
7.C.1. By level of income
Feature High income
Upper middle income
Lower middle
income Low income
Proportion in all countries
Foreign currency deposits covered 71 92 46 85 71 Inter-bank deposits covered 36 1 23 8 34
Co-insurance exists 18 31 27 0 18
Payment per depositor 60 79 43 87 60 Scheme is permanently funded 80 93 92 100 81 Premiums are risk-adjusted 42 27 19 0 39 Membership is compulsory 97 100 97 100 98 Source of funding Private 24 21 62 0 25 Joint 76 72 38 100 74 Public 0 7 0 0 0 Administration Official 49 56 38 98 50 Joint 36 23 12 1 34 Private 15 21 50 1 17 7.C.2. By region* Feature Asia & Pacific Europe & Central Asia
Latin America & Caribbean
Middle East & North Africa
Sub-Saharan Africa
Foreign currency deposits covered 92 100 47 17 29 Inter-bank deposits covered 32 1 7 15 85
Co-insurance exists 0 63 10 17 0
Payment per depositor 74 81 43 42 49 Scheme is permanently funded 79 100 95 100 100 Premiums are risk-adjusted 0 30 19 0 0 Membership is compulsory 97 98 99 100 100 Source of funding Private 0 10 64 10 0 Joint 100 90 32 90 100 Public 0 0 5 0 0 Administration Official 100 58 39 27 79 Joint 0 42 5 73 10 Private 0 0 56 0 11
Table 7. Design features of explicit deposit insurance schemes
(as of 2003, continued)
Panel D: The sum of the GDP per capita of countries with each feature divided by the total GDP per capita in a given category(in percent)
7.D.1. By level of income
Feature High income
Upper middle income
Lower middle
income Low income
Proportion in all countries
Foreign currency deposits covered 76 84 78 60 76 Inter-bank deposits covered 7 4 27 31 8
Co-insurance exists 30 45 22 0 30
Payment per depositor 79 91 67 81 79 Scheme is permanently funded 64 93 95 100 69 Premiums are risk-adjusted 20 24 41 0 21 Membership is compulsory 92 100 84 100 92 Source of funding Private 44 10 46 20 41 Joint 56 83 54 80 58 Public 0 8 0 0 1 Administration Official 36 61 64 76 40 Joint 29 30 26 17 29 Private 35 9 10 7 31 7.D.2. By region* Feature Asia & Pacific Europe & Central Asia
Latin America & Caribbean
Middle East & North Africa
Sub-Saharan Africa
Foreign currency deposits covered 86 100 66 50 46 Inter-bank deposits covered 81 3 10 24 68
Co-insurance exists 0 53 17 50 0
Payment per depositor 65 87 75 87 85 Scheme is permanently funded 68 100 89 100 100 Premiums are risk-adjusted 52 32 34 0 0 Membership is compulsory 33 97 96 100 100 Source of funding Private 52 15 35 13 0 Joint 48 85 53 87 100 Public 0 0 13 0 0 Administration Official 100 55 67 63 56 Joint 0 45 10 37 31 Private 0 0 23 0 13
APPENDIX
A.1 The deposit insurance database
Table A.1.1. Explicit versus implicit deposit insurance
Country name Type
explicit=1 implicit=0
Country name Type
explicit=1 implicit=0
Country name Type
explicit=1 implicit=0
Afghanistan 0 Cyprus 1 Jamaica 1
Albania 1 Czech Rep. 1 Japan 1
Algeria 1 Denmark 1 Jordan 1
Angola 0 Djibouti 0 Kazakhstan 1
Argentina 1 Dominican Republic 1 Kenya 1
Armenia 0 Ecuador 1 Kiribati 0
Australia 0 Egypt 0 Korea 1
Austria 1 El Salvador 1 Kuwait 0
Azerbaijan 0 Equatorial Guinea 0 Kyrgyz Republic 0
Bahamas 1 Eritrea 0 Laos 0
Bahrain 1 Estonia 1 Latvia 1
Bangladesh 1 Ethiopia 0 Lebanon 1
Barbados 0 Fiji 0 Lesotho 0
Belarus 1 Finland 1 Liberia 0
Belgium 1 France 1 Libya 0
Belize 0 Gabon 0 Liechtenstein 1
Benin 0 Gambia 0 Lithuania 1
Bhutan 0 Georgia 0 Luxembourg 1
Bolivia 1 Germany 1 Macedonia 1
Bosnia-Herzegovina 1 Ghana 0 Madagascar 0
Botswana 0 Gibraltar 1 Malawi 0
Brazil 1 Greece 1 Malaysia 1
Brunei 0 Grenada 0 Maldives 0
Bulgaria 1 Guatemala 1 Mali 0
Burkina Faso 0 Guinea 0 Malta 1
Burundi 0 Guinea-Bissau 0 Marshall Islands 1
Cambodia 0 Guyana 0 Mauritania 0
Cameroon 0 Haiti 0 Mauritius 0
Canada 1 Honduras 1 Mexico 1
Cape Verde 0 Hong Kong 0 Micronesia 1
Central African Rep. 0 Hungary 1 Moldova 0
Chad 0 Iceland 1 Mongolia 0
Chile 1 India 1 Morocco 0
China 0 Indonesia 1 Mozambique 0
Colombia 1 Iran 0 Myanmar 0
Comoro Is. 0 Iraq 0 Namibia 0
Costa Rica 0 Ireland 1 Nepal 0
Cote d'Ivoire 0 Isle of Man 1 Netherlands 1
Croatia 1 Israel 0 New Zealand 0
Table A.1.1 (continued)
Country name Type
explicit=1 implicit=0
Country name Type
explicit=1 implicit=0
Country name Type
explicit=1 implicit=0
Niger 0 Sierra Leone 0 Trinidad & Tobago 1
Nigeria 1 Singapore 0 Tunisia 0
Norway 1 Slovak Republic 1 Turkey 1
Oman 1 Slovenia 1 Turkmenistan 1
Pakistan 0 Solomon Is. 0 Uganda 1
Panama 0 Somalia 0 Ukraine 1
Papua New Guinea 0 South Africa 0 United Arab Emirates 0
Paraguay 1 Spain 1 United Kingdom 1
Peru 1 Sri Lanka 1 United States 1
Philippines 1 St. Lucia 0 Uruguay 1
Poland 1 Sudan 0 Uzbekistan 0
Portugal 1 Suriname 0 Vanuatu 0
Qatar 0 Swaziland 0 Venezuela 1
Republic of Congo 0 Sweden 1 Vietnam 1
Romania 1 Switzerland 1 W. Samoa 0
Russia 1 Syria 0 Yemen 0
Rwanda 0 Taiwan 1 Zaire 0
Saudi Arabia 0 Tajikistan 0 Zambia 0
Senegal 0 Tanzania 1 Zimbabwe 1
Serbia & Montenegro 1 Thailand 1
Seychelles 0 Togo 0
Table A.1.2. Date of enactment/revision, coverage type and limits
Country name Date enacted /
revised Foreign currencies yes=1 no=0 Inter-bank deposits yes=1 no=0
Coverage limits as of 2003 Coverage
limits as of 2003 in US$ Albania 2002 1 0 Lek 700,000 6568 Algeria 1997 0 0 600,000 dinars 8263 Argentina 1979/1995 1 0 Arg $ 30,000 10327 Austria 1979/1996 1 0 EUR 20,000 25260
Bahamas 1999 0 0 50,000 Bahamian dollars 50000
Bahrain 1993 1 0 BD 15,000 39894
Bangladesh 1984 0 0 Tk 60,000 1021
Belarus 1996/1998/2000/
2001/2004 1 0 RBL 2,141,000 1000
Belgium 1974/1995/1998 1 0 EUR 20,000 25260
Bolivia 2001 1 0 50% of privileged obligations. No maximum amount.
Bosnia-Herzegovina 1998 1 1 5000 Convertible Markas 3228
Brazil 1995/2002 0 0 Reais 20,000 6925
Bulgaria 1996/1998/2001/ 2002
1 0 BGN 15,000 9686
Canada 1967 0 1 Can. $ 60,000 46425
Chile 1986 1 0 demand deposits in full and 90%
coinsurance up to UF 120 for savings deposits
3764
Colombia 1985 0 1 75% per deposit or Col$ 20 Mil. 7192
Croatia 1997 1 0 HRV 100,000 16343
Cyprus 2000 0 0 EUR 20,000 25260
Czech Rep. 1994 1 0 90% of EUR 25,000 31575
Denmark 1987/1995 1 0 DKK 300,000 40296
Dominican Republic 1962 1 0 Full Full
Ecuador 1998 1 0 7416 7416
El Salvador 1999 1 0 Colon 58,424 4720
Estonia 1998 1 0 EKK 100,000 8058
Finland 1969/1992/1998 1 0 FIM 150,000 31863
France 1980/1986/1999 1 0 EUR 70,000 88410
Germany 1966/1969/1998 1 0 private: 30% of bank's equity capital; official coinsurance 90%
to EUR 20,000
25260
Gibraltar 1998 1 0 lesser of 90% coinsurance or EUR
20,000 (18,000 pounds) 25260
Greece 1995/2000 1 0 EUR 20,000 25260
Guatemala 1999 1 1 20,000 Quetzales 2487
Honduras 1999 1 1 Full coverage until 2002; 165000
L/9500 US$ as of 2003 9297
Hungary 1993 1 0 HUF 3,222,222 14429
Iceland 1985/1996 1 0 ISK 2,091,000 29455
India 1961 1 0 Rs 100,000 2193
Indonesia 1998 Blanket guarantee
Table A.1.2 (continued)
Country name Date enacted /
revised Foreign currencies yes=1 no=0 Inter-bank deposits yes=1 no=0
Coverage limits as of 2003 Coverage
limits as of 2003 in
US$
Isle of Man 1991 1 0 lesser of 15,000 pounds or 75% of amount deposited
35694
Italy 1987/1996 1 0 ITL 200 Mil. 130457
Jamaica 1998 1 0 J$ 300,000 4957
Japan 1971 0 0 10000000 yen 93371
Jordan 2000 0 0 JD 10,000 14104
Kazakhstan 1999/2003 1 0 400,000 Tenges 2774
Kenya 1988 1 1 K Sh 100,000 1313
Korea 1996 0 0 50 Mil Won 41925
Latvia 1998 1 0 3000 Lat 5545 Lebanon 1967 0 1 LL 5,000,000 3317 Liechtenstein 1992/2003 1 0 EUR 20,000 25260 Lithuania 1996 1 0 LTL 45,000 16293 Luxembourg 1989 1 0 EUR 20,000 25260 Macedonia 1996/2000/2002 1 0 EUR 20,000 25260
Malaysia 1998 Blanket guarantee
Malta 2003 0 0 EUR 20,000, about 8600 Maltese
lira 25260 Marshall Islands 1975 1 1 US $ 100,000 100000 Mexico 1986/1990/1999 1 0 32,262,340 Pesos 2871337 Micronesia 1963 1 1 US$ 100,000 100000 Netherlands 1978/1996/1998 1 0 EUR 20,000 25260 Nicaragua 2001 1 0 US$ 20,000 20000 Nigeria 1988/1989 0 1 N 50,000 366 Norway 1961/1997 1 0 NOK 2,000,000 299401
Oman 1995 1 0 RO 20,000 or 75% of net deposits,
whichever is less 52016 Paraguay 2003 n.a. n.a. 75 * monthly minimum salary 10500
Peru 1991 1 0 S 68,474 19773 Philippines 1963 1 1 P 100,000 1800 Poland 1995 1 0 100% of up to EUR 1,000; 90% of EUR 1,000 to EUR 22,500 28418 Portugal 1992/1995 1 0 EUR 25,000 31575 Romania 1996 1 0 ROL 125,222,000 3842
Russia 2003 n.a. n.a. 100,000 rubles 3395
Serbia & Montenegro 2001 1 0 5,000 Dinars 87
Slovak Republic 1996/2001 1 0 90%, not to exceed EUR 20,000 25260
Slovenia 2001 1 0 5,100,000 tolars 26931
Spain 1977/1996 1 0 EUR 20,000 25260
Sri Lanka 1987 0 0 Rs. 100,000 1034
Sweden 1996 1 0 SEK 250,000 34364
Switzerland 1984/1993 0 0 CHF 30,000 24254
Taiwan 1985 0 0 NT$ 1,000,000 since Aug 15 1987
Tanzania 1994 1 1 TZS 250,000 235
Thailand 1997 1 1 Full coverage (blanket
Table A.1.2 (continued)
Country name Date enacted /
revised Foreign currencies yes=1 no=0 Inter-bank deposits yes=1 no=0
Coverage limits as of 2003 Coverage
limits as of 2003 in
US$
Trinidad & Tobago 1986 0 0 TT $ 50,000 7937
Turkey 1983/2000 1 0 unlimited Full
Turkmenistan 2000 1 0 full Full
Uganda 1994 0 0 U Sh 3,000,000 1550
Ukraine 1998 1 0 UAH 1,500 281
United Kingdom 1982/1995 1 0 100% of first ₤2000 and 90% of
next ₤33,000 19611
United States 1934/1991 1 1 US$ 100,000 100000
Uruguay 2002 n.a. n.a.
Venezuela 1985/2001 0 0 Bs 10,000,000 6258
Vietnam 2000 n.a. n.a. VND 30,000,000 1948
Zimbabwe 2003 Zimbabwe $ 200,000 3640
Notes: Blank spaces indicate that the data is not available. n.a. stands for “Not applicable”
Table A.1.3. Co-insurance, payment coverage type, and coverage value distribution
Country name
Co-insurance yes=1 no=0 Co-insurance percentage Payment per depositor=1 per deposit=0 Percentage of deposit value covered Information source for coverage distribution Reference date of data on coverage distribution Albania 1 15 1 Algeria 0 0 0 Argentina 0 0 0 40 Garcia 2000 Austria 1 10 0 Bahamas 0 0 0 39 IADI 2001 Bahrain 0 0 0 Bangladesh 0 0 0 31 Garcia 2000 Belarus 1 20 0 Belgium 1 10 0 Bolivia 1 50 0 Bosnia-Herzegovina 0 0 0 Brazil 0 0 0 23.6 FGC 2003 Bulgaria 0 0 1 71 DIF 2003 Canada 0 0 0 34.3 CDIC 2002
Chile 1 10 1 30 Demirguc-Kunt and
Levine 2003 Colombia 1 25 1 30.8 IADI 2002 Croatia 0 0 1 68 Garcia 2000 Cyprus 1 10 1 Czech Rep. 1 10 1 86.2 FPV 2003 Denmark 0 0 1 44.6 IADI 2001 Dominican Republic 100 2003 Ecuador 0 0 1 El Salvador 0 0 1 Estonia 1 10 1 Finland 0 0 1 40 Garcia 2000 France 0 0 1 Germany 1 10 1 Gibraltar 1 10 1 Greece 0 0 1 Guatemala 0 0 1 Honduras 0 0 1 Hungary 0 0 1 86.8 NDIF 2003 Iceland 0 0 1 India 0 0 1 72 Garcia 2000 Indonesia Ireland 1 10 1 Isle of Man 1 25 1 Italy 0 0 1 62 Garcia 2000 Jamaica 0 0 1 33.5 Garcia 2000 Japan 0 0 1 87.9 DIC 2002 Jordan 0 0 1 Kazakhstan 0 0 1 Kenya 0 0 1 16 Garcia 2000 Korea 0 0 1 80.8 KDIC 2003
Table A.1.3 (continued)
Country name
Co-insurance yes=1 no=0 Co-insurance percentage Payment per depositor=1 per deposit=0 Percentage of deposit value covered Information source for coverage distribution Reference date of data on coverage distribution Latvia 0 0 1 18.7 Garcia 2000 Lebanon 0 0 1 Liechtenstein 0 0 1 Lithuania 1 10 1 44 Garcia 2000 Luxembourg 1 10 1 Macedonia 1 10 1 53.7 IADI/NBRM 2002 Malaysia Malta 0 0 1 Marshall Islands 0 0 1 Mexico 0 0 1 81 IADI/IPAB 2003 Micronesia 0 0 1 Netherlands 0 0 1 Nicaragua 0 0 1 Nigeria 0 0 0 19 NDIC 2003 Norway 0 0 1 76.1 Garcia 2000 Oman 1 25 1 Paraguay 0 0 1 Peru 0 0 1 39.5 IADI 2002 Philippines 0 0 1 19 PDIC 2002 Poland 1 10 1 Portugal 0 0 1 53 FGD 2002 Romania 0 0 1 43 BDGF 2002 Russia 1 50 1 85 WB 2003
Serbia & Montenegro 0 0 1
Slovak Republic 1 10 1 47 Garcia 2000
Slovenia 0 0 1 Spain 0 0 1 60 FGD 2000 Sri Lanka 0 0 1 Sweden 0 0 1 57 IADI 2002 Switzerland 0 0 1 Taiwan 0 0 0 35.8 IADI 2001 Tanzania 0 0 1 12 Garcia 2000 Thailand 0 0 0 100 2003
Trinidad & Tobago 0 0 1 34.1 Garcia 2000
Turkey 0 0 0 100 2003
Turkmenistan 0 0 0 100 2003
Uganda 0 0 1 26 Garcia 2000
Ukraine 0 0 1 19 Garcia 2000
United Kingdom 1 10 1
United States 0 0 0 65/60 Garcia/FDIC 2000/2003
Uruguay 0 0 1
Venezuela 0 0 1
Vietnam 0 0 1
Zimbabwe 0 0 1
Notes: Blank spaces indicate that the data is not available. n.a. stands for “Not applicable”
Table A.1.4. Type of fund and premium information
Country name Permanent
fund funded=1 unfunded=0 Premium or assessment base Annual premiums
% of base adjusted
Risk-premiums
yes=1 no=0
Albania 1 insured deposits 0.50% 0
Algeria 1 0
Argentina 1 insured deposits risk-based, 0.36% to 0.72% 1
Austria 0 insured deposits pro rata, ex post 0
Bahamas 1 insured deposits 0.05% 0
Bahrain 0 deposits ex post 0
Bangladesh 1 deposits 0.50% 0
Belarus 1 household deposits risk based: 0 for two state banks. 0.1% to 0.3% of household deposits for other banks, depending on the bank's household deposits to capital ratio
1
Belgium 1 insured liabilities 0.02% + 0.04% 0
Bolivia 1 deposits 1
Bosnia-Herzegovina 1 deposits 0.5% until July 2001, then changed to 0.3% 0
Brazil 1 insured deposits 0.30% 0
Bulgaria 1 insured deposits risk based to 0.5% 1
Canada 1 insured deposits 0.33% max 0
Chile 0 not applicable none 0
Colombia 1 insured deposits 0.5% from January 2002 to December 2006 0
Croatia 1 insured deposits 0.80% 0
Cyprus 1 n.a. n.a. 0
Czech Rep. 1 insured deposits 0.10% 0
Denmark 1 insured deposits 0.2% (maximum) 0
Dominican Republic 1 deposits 0.1875% 0
Ecuador 1 deposits 0.65% 0
El Salvador 1 insured deposits risk-based, 0.1% to 0.3% 1 Estonia 1 deposits until 2002 0.5% (maximum) (0.28% at present) 0 Finland 1 insured deposits risk based: 0.05% to 0.3% 1
France 0 n.a. on demand but limited 0
Germany 1 insured deposits in commercial banks DIS, risk-assets in other DIS
official is 0.03% but can be doubled 0
Gibraltar 0 insured deposits administrative expenses and expost contributions
0
Greece 1 deposits decreasing by size: 1.25% to 0.025% 0 Guatemala 1 insured deposits 1.0% plus 0.5% when the fund falls below its
target 0
Honduras 1 deposits not more than 0.25% 0
Hungary 1 insured deposits risk based to 0.3% 1
Iceland 1 insured deposits 0.15% 0
India 1 deposits 0.05% 0
Indonesia
Ireland 1 EU and EEA, i.e
Table A.1.4 (continued)
Country name Permanent
fund funded=1 unfunded=0 Premium or assessment base Annual premiums
% of base adjusted
Risk-premiums
yes=1 no=0 Isle of Man 0 deposits the greater of 25,000 pounds and 0.0125% of
deposit base subject to a maximum annual contribution of 250,000 pounds
0
Italy 0 protected funds
adjusted for size and risk
risk adjusted ex post 0.4% to 0.8% 1
Jamaica 1 insured deposits 0.10% 0
Japan 1 insured deposits 0.0048% + 0.036% 0
Jordan 1 deposits 0.20% 0
Kazakhstan 1 insured deposits 1.00% 1
Kenya 1 deposits 0.15% 0
Korea 1 deposits 0.05% 0
Latvia 1 insured deposits 0.3% until year 2000; 0.2% thereafter 0
Lebanon 1 credit accounts 0.05% 0
Liechtenstein 0 n.a. 0
Lithuania 1 insured deposits 0.45% 0
Luxembourg 0 insured deposits ex post 0
Macedonia 1 insured deposits 1.5%, risk-based 1% to 5% 1 Malaysia
Malta 1 deposits 0.10% 0
Marshall Islands 1 deposits risk-based, 0% to 0.27% 1 Mexico 1 all obligations minimum 0.4% on a proxy of total bank
liabilities 0
Micronesia 1 deposits risk-based, 0% to 0.27% 1
Netherlands 0 case by case Ex post 0
Nicaragua 1 0
Nigeria 1 deposits 0.94% 0
Norway 1 risk-weighted
assets and total deposits
0.005% of assets and 0.01% of total deposits 0
Oman 1 deposits 0.02% 0
Paraguay n.a. n.a. n.a.
Peru 1 insured deposits risk-based from 0.45% to 1.45% 1
Philippines 1 deposits 0.20% 0
Poland 1 deposits, also
risk-adjusted assets not more than 0.4% 0 Portugal 1 insured deposits risk-based, 0.1% to 0.2% + more in
emergencies 1
Romania 1 insured deposits risk-based: 0.3% to 0.6% 1 Russia 1 deposits no more than 0.15%, in emergency up to
0.3%, once fund formed 0.05% 0
Serbia & Montenegro 1 0
Slovak Republic 1 insured deposits 0.1% to 0.3% for banks 0 Slovenia 0 insured deposits 3.2% of guaranteed deposits 0
Spain 1 insured deposits maximum of 0.2% 0