4
Integrating
qualitative and
quantitative
research to
develop the final
archetypes
Developing home occupant
archetypes: First results of
mixed-methods study to
understand occupant comfort
behaviours and energy use in
homes
Marco A. Ortiz and Philomena M. Bluyssen
First published: Ortiz Sanchez, M., & Bluyssen P. M. (2019). “Developing home occupant archetypes: first results of mixed- methods study to understand occupant comfort behaviours and energy use in homes”. Building and Environment, 163, 106331. https://doi.org/10.1016/j.buildenv.2019.106331
Developing home occupant archetypes: first results
of mixed-methods study to understand occupant
comfort behaviours and energy use in homes
ABSTRACT To better understand home energy consumption, it is important to study the behaviours of occupants in their homes, especially in relation to their comfort needs. A mixed methods study comprising of a questionnaire, interviews, indoor environmental parameters monitoring, and energy consumption readings was performed to group home occupants based on their behavioural patterns. The TwoStep cluster analysis produced five clusters of home occupant with the data from 761 questionnaire respondents. The clustering model comprised of 28 variables including constructs of emotions, comfort affordances, and locus of control. Then, in-depth semi-structured interviews were conducted and IEQ monitoring and energy readings were taken with 15 of the questionnaire respondents. The results of the field study were used to substantiate the findings of the questionnaire. The combination of the statistical clusters with the data from the field study resulted in five archetypes: five distinct types of home occupants, differing in their behavioural motivations towards achieving comfort, and their use of energy when doing so. This study shows that a mixed methods approach is valuable for better understanding energy consumption and implementing archetype-customized lines of action to reduce energy use and maintain comfort.
4.1
Introduction
Understanding behavioural patterns of occupants in their home -where they spend over 60% of their time- (Bonnefoy et al., 2004) seems to be essential to achieve reductions in energy consumption. This is because the actual energy consumption of dwellings is not only related to the building (technologies and performance), but also to the occupant (behaviours, lifestyle). These behavioural patterns need to be investigated from an occupant-centered perspective by taking into account factors such as comfort needs, satisfaction, perception, behaviour, physiology, culture, as well as attitudes, and socioeconomic status (Bluyssen, 2000; 2014b; Guerra-Santin et al., 2016; Indraganti & Rao, 2010; Karjalainen, 2007; Ortiz et al., 2017; K. C. Parsons, 2002). To ensure a reduction in energy consumption in the residential sector, both components –building and occupant- need to be assumed as an interacting system. Currently, a lack of knowledge is detected regarding 1- occupants’ behaviours in their homes, 2- how they use energy, and 3- what their psycho-behavioural motivators when using energy are. This could be because traditionally in the indoor environmental quality (IEQ) field, these components are being researched independently from one another and unequally in terms of amount of studies.
As an example, between 1997 and 2015, only 13% of articles in energy research used qualitative methods. Contrarily, energy engineering (quantitative research) received 35 times more funding than behavioural and energy demand research (qualitative research) (Ortiz et al., 2017; Sovacool, 2014). In the last decades, trends suggest that research on the human dimension of energy use has increased (Hong, D'Oca, Turner, & Taylor-Lange, 2015), but they also show that interdisciplinarity is still uncommon. An example of qualitative methods in energy research is an investigation about owners’ reasons to undertake home improvements, finding that their motivations were linked to the meaning of homes as a place for comfort and family life rather than as one for future investments (Munro & Leather, 2000). Similarly, user-centered methods were used to explore the behaviours and attitudes of owners towards home improvements; where five archetypes were developed based on interviews, claiming that the value of such an approach for tackling technical challenges is to enable the development of tailor-made strategies to suit each archetype to improve retrofit policies (Haines & Mitchell, 2014). Another study integrated the influential factors in domestic energy-saving behaviours in France, by using a survey that combined data from building and user characteristics. It showed a way in which energy behaviours can be included in the design of energy policies to encourage energy savings (Belaid &
Garcia, 2016). Mixed methods were also used in a study aimed at understanding how occupants create and maintain thermal comfort at home: environmental variables were recorded, occupants answered a survey about how they had achieved comfort, and they were interviewed about why and when such thermal comfort actions were performed (Tweed, Dixon, Hinton, & Bickerstaff, 2014). Those are examples of the use of mixed-methods to tackle technical challenges related to energy consumption. It must be noted that those studies tend to focus on the development of future policies and one-time home improvements or thermal comfort actions, and not on holistic comfort behaviours
Previous studies have already demonstrated that different behavioural patterns among occupiers lead to energy consumption discrepancies. A study from 2018 used principle component analysis to identify the behavioural patterns of Greek home occupants based on a questionnaire assessing building characteristics, occupant behaviour, and socio-demographic variables, in which they found six patterns (Vogiatzi et al., 2018). Similarly, in the same year, in a study by University of Cambridge researchers (Ben & Steemers, 2018) used a questionnaire and factor analysis to find five profiles based on the occupants’ use of space heating. A Dutch survey found four lighting behavioural profiles that vary in their impact on consumption, household, and building characteristics (Bedir & Kara, 2017). A different approach was used in an Italian study in which they employed simulation and prediction, and the results proposed that occupant behaviours can be classified into three types of lifestyle that impact energy consumption in relation to thermal, ventilation, water, and lighting behaviours (Barthelmes, Becchio, & Corgnati, 2016). In Wales, a study segmented survey respondents based on their values, perceptions, and self-reported behaviours in regards to energy, and six occupant segments were identified (Guerra Santin, 2011; Poortinga & Darnton, 2016). Finally, a study in the Netherlands categorized home occupants based on heating behaviours and found five types of behavioural patterns (Guerra Santin, 2011). Further studies performed between the 1980s and the early 2010s intending to categorize types of occupants, have generally used statistical approaches, such as principal component analysis, discriminant analysis, cluster analysis, correlation analysis, exploratory factor analysis, or factor analysis (Hughes & Moreno, 2013; Sütterlin, Brunner, & Siegrist, 2011; W. F. Van Raaij & T. M. Verhallen, 1983).
In addition, other studies have suggested that different types of occupants influence differently the energy of their residences; and therefore, there is a need to better understand these behavioural differences -in addition to taking into account age, lifestyle and number of occupants (Motuziene & Vilutiene, 2013). One objective of finding patterns is to have more accurate performance predictions (Azar & Menassa, 2012; Daša Majcen, Laure Itard, & Henk Visscher, 2013; Menezes, Cripps,
Bouchlaghem, & Buswell, 2012). This is supported by D’Oca, Fabi, Corgnati, and Andersen (2014) who found that probabilistic profiles can help strengthening energy models. A reason for this is provided by a study suggesting that out of an average of 27 factors influencing space-heating behaviours, only a few tend to be considered in building performance simulations (Wei, Jones, & De Wilde, 2014). A similar conclusion was found in a study researching adaptive occupant behaviours by sorting them into three categories: observation, modelling, and simulation. It was concluded that with the appropriate variables, effects of behaviour on energy performance can be reduced (Gunay, O'Brien, & Beausoleil-Morrison, 2013). In low energy houses, it was found that occupants tend to feel more aware of energy and water consumption, especially due to the feedback, and this awareness triggered behavioural changes (Zalejska-Jonsson, 2012). Taking into account the aspects mentioned above, behaviours add considerable weight to the energy use and performance of buildings; estimated to affect by factors from 3 to 10 of residential energy use (Hong et al., 2016; Jia et al., 2017; Veselý & Zeiler, 2014).
Consequently, the results of the current literature in the energy engineering and the IEQ fields suggest that there are three needs. 1) Better understanding human behaviour in terms of energy use; 2) better interdisciplinary collaboration between the engineering and behavioural fields; and 3) better understanding the occupant component in the development and operation of buildings and its features. This study goes beyond the statistical clustering of questionnaire respondents by incorporating qualitative data and building features data to the results. More specifically, this study is a development of the questionnaire performed by Ortiz and Bluyssen (2018). In that proof-of-concept, six archetypes were found by using a specialized questionnaire and the TwoStep cluster analysis. It was concluded that the use of the TwoStep technique is fitting for the variables used, as the questionnaire included categorical and continuous variables (Norušis, 2012). The authors suggested that substantiation of the archetypes was needed with the use of qualitative methods. Combining the results of the cluster analysis with those of qualitative data can strengthen the clusters into “archetypes” (Ajzen, 1991). Therefore, the aim of the present study is to strengthen the statistical clusters, in order to formulate archetypes by substantiating the clusters with the mixed-methods data collected from the field study (interviews, IEQ factors, energy readings, and building features).
4.2
Methods
4.2.1
Study design
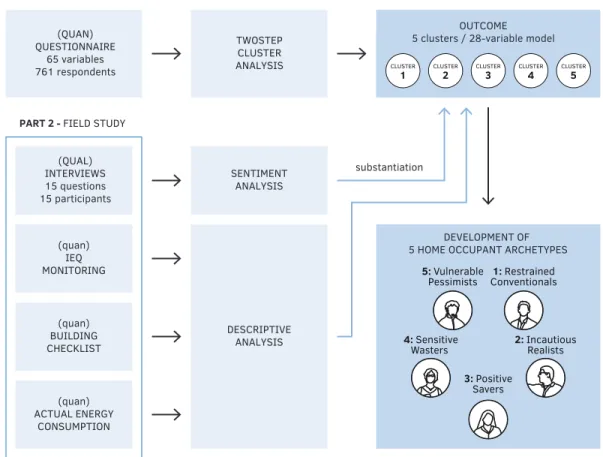
The study comprised of two parts. Figure 4.1 shows that in the first part of the study, a specialized questionnaire was administered to a sample of home occupants in the Netherlands and France. The second part was a field study in which qualitative data was collected by interviewing participants, and building data was also gathered with a building characteristics checklist, by monitoring indoor environmental parameters (temperature, humidity, and CO2), and by taking energy readings.
substantiation CLUSTER
1 PART 1
PART 2 - FIELD STUDY (QUAL) INTERVIEWS 15 questions 15 participants (QUAN) QUESTIONNAIRE 65 variables 761 respondents TWOSTEP CLUSTER ANALYSIS SENTIMENT ANALYSIS DEVELOPMENT OF 5 HOME OCCUPANT ARCHETYPES
DESCRIPTIVE ANALYSIS
OUTCOME 5 clusters / 28-variable model
(quan) IEQ MONITORING (quan) BUILDING CHECKLIST (quan) ACTUAL ENERGY CONSUMPTION 3: Positive Savers 5: Vulnerable
Pessimists Conventionals1: Restrained
2: Incautious
Realists
4: Sensitive
Wasters
CLUSTER
2 CLUSTER3 CLUSTER4 CLUSTER5
The quantitative part involved a previously-developed questionnaire (Ortiz & Bluyssen, 2018), while the field study was divided into qualitative methods
(interviews) and quantitative methods (IEQ monitoring, energy readings, checklist). The value of having a mixed-methods approach is that it provides a holistic perspective of the concept of comfort for each of the archetypes. Knowledge is gained not only about what at are “comfortable”’ conditions for the participant (environmental monitoring), but also about the extra dimensions of comfort for the archetype, how they are achieved, and which actions or strategies are exercised to achieve them. Ethical approval from the Ethics Committee of the TU Delft was granted to distribute the questionnaire and to perform the field study.
4.2.2
Questionnaire (quantitative data)
Volunteers were drawn from four sources and were invited to take part in the questionnaire. The first and second sources included students from the Delft University of Technology in The Netherlands: 218 master students and 316 bachelor students respectively. The third source was from 1000 employees of the same university, and the fourth from 452 employees of Saint Gobain Recherche in France. The objective was to obtain a sample of a variety of young adulthood and middle adulthood participants that would be representative of diverse home and occupancy types (renters, owners, family homes, student homes, studios). The invitation process started by notifying the potential participant about the purpose of the study one week before they would receive an email with a link to the questionnaire. Participation was voluntary. Participants were given two weeks to fill it out. The first page of the questionnaire introduced the respondent to a consent form detailing time to fill it out (about 30 minutes), closing date, possibility of non-answers, and confidentiality and anonymity measures. Participants from the first and second sources received credit-points when answering the questionnaire. The administration of the questionnaire spanned from October 2016 to October 2017, depending on the source.
The questionnaire was created on the Qualtrics online platform and was developed based on a literature review and already-validated questionnaires that were adapted to the contexts of comfort-making behaviours in the home environment (Ortiz & Bluyssen, 2018). Comfort-making behaviours are described as behavioural expressions that the occupant exercises to achieve a state of physical, physiological, or psychological homeostasis; thus bringing one’s current state into a neutral one.
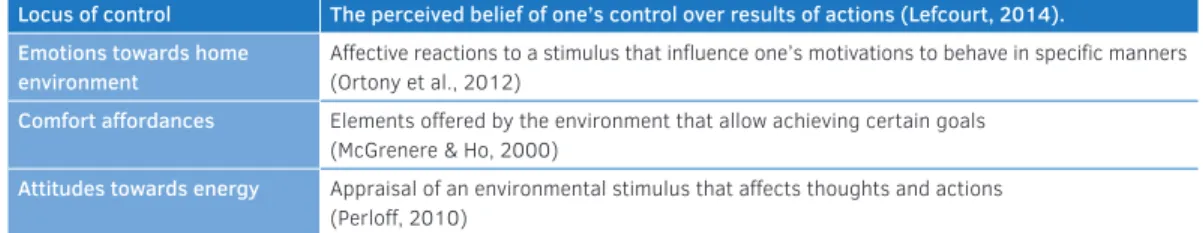
The constructs assessed in the questionnaire were based on and adapted from the Theory of Planned Behaviour (Ajzen, 1991). These were locus of control (beliefs), emotions towards the home, attitudes towards energy, and comfort affordances (needs). Table 4.1 shows the definitions of each of the constructs.
TABLE 4.1 Definitions of behavioural constructs included in the questionnaire
Locus of control The perceived belief of one’s control over results of actions (Lefcourt, 2014). Emotions towards home
environment Affective reactions to a stimulus that influence one’s motivations to behave in specific manners (Ortony et al., 2012)
Comfort affordances Elements offered by the environment that allow achieving certain goals (McGrenere & Ho, 2000)
Attitudes towards energy Appraisal of an environmental stimulus that affects thoughts and actions (Perloff, 2010)
A first version of the questionnaire was sent to a panel of reviewers for input on content validity, language use, and layout, and was pilot-tested with twenty individuals (excluded from the final sample) to point out typing or language errors, language clarity, contingency and skipped questions, and time to fill out. The questionnaire was revised accordingly. Simultaneously, Dutch and French translations were made and submitted to reviewers. The final instrument consisted of 65 questions assessing seven categories (demographic and building information, locus of control, emotions towards home environment, comfort affordances, attitudes towards energy, energy-consuming habits, and health and sick building syndrome) [34]. Answers to the questions were presented either dichotomously or on a 5-point Likert scale.
4.2.3
Field Study (mixed data)
The field study involved qualitative and quantitative data collection. Recruitment of participants was done by emailing the questionnaire respondents that showed interest in a follow-up to the questionnaire. Of the 761 questionnaire respondents, 212 gave their address. Invitation emails were sent to participate in the field study and 15 people volunteered.
4.2.3.1
Qualitative field study: Interviews
The qualitative part involved in-depth, semi-structured interviews that were conducted in June and July 2018. Interviews were recorded with a Tascam DR-05 V2 digital audio recorder with the consent of participants. The interviews had three parts: background of the participant, comfort perceptions, and energy consumption habits. Generally, fifteen questions were asked. The main topic was “comfort perceptions”; with a focus on actions performed to achieve comfort or on the building characteristics that allowed achieving comfort. Then those practices were related to the use of energy. During the interview, while a participant explained a practice, the place where the practice is done was shown to visualize their actions and experiences. The interviews of this study are a tool that elicits “technical and process knowledge”: explicit knowledge that is readily expressed by participants through what they think and say about a certain topic or from frequently done and repeated patterns of actions and routines (Bogner et al., 2009).
4.2.3.2
Quantitative field study: IEQ monitoring, building features,
and energy readings
Measurements were taken of carbon dioxide (CO2), air temperature, and relative humidity (RH). Two types of devices were used: iButton’s® and HOBO® MX1102 data loggers. For every interviewee, three iButton’s were located in the top three locations that the participant mentioned to spend most time at while being at home. Here referred to as “preferred locations.” Measurements were taken for a week and the data acquisition interval was 5 minutes. The HOBO loggers recorded CO2, air temperature, and RH and were placed in the area where the person spent most of their time. HOBOs measured for at least 24 hours.
The actual energy use was determined by reading the gas and electricity meters on the day of the interview and a month later for a second reading. In case night fees were displayed, both readings were recorded. If the person had a smartphone energy-monitoring app, they emailed the data to the researchers. When no energy meter was present due to the social housing company, energy bills were requested. If the person was living in a shared accommodation, estimations were made by dividing the reading by the number of occupants. If the person only had the bills without a breakdown of the consumption, estimations were made based on the gas and electricity fees of their energy supplier.
A checklist was filled out in every home, inventorying building characteristics that play a role in the energy consumption during winter and summer. These were type of home, orientation, construction year, number of rooms, energy label, heating system and terminal units, roof type, general winter temperature, heating season schedules, number of doors to the outside and type of door, percentage of glazing and type, number of windows usually open, solar shading, off-grid power generation, lighting type and appliance usage, and main ventilation strategy.
4.2.4
Data cleaning and analysis
4.2.4.1
Questionnaire: clustering and model validation.
Data from the four questionnaire sources were merged into a master dataset. TwoStep Cluster analysis was performed using SPSS 24.0. Advantages of the method are that data handling is minimal and allows analysing data pertaining to demographics, health, psychographics, and behaviours. The procedure unfolds as follows: first the analysis is run multiple times with different cluster numbers, from 2 to 18; for each run, the ratios of between- and within- cluster variance of the variables are examined: higher ratios imply better cluster separation. A 5-cluster model was chosen for further inspection as it showed the highest ratio. Next, the chosen model was validated. Validation is done to evaluate if the final clusters are influenced by the method, population chosen, and to protect against variables being randomly selected. The validation is a four-step process as proposed by Norusis, and performed as follows: a) ensure that the silhouette measure of cohesion is above 0.0 (in this case 0.2); b) perform Chi2 tests and t-tests to ensure statistical significance of behavioural constructs. This step is done by running the test and removing the behavioural constructs that are not consistent separators; c) remove variables with a prediction score lower than 0.02, and d) halve the sample randomly and apply the final model to each half, ensuring that the results are similar. After the four-step validation was successful, the initial 65 variables of the questionnaire pertaining to behavioural constructs were reduced to 28 variables making up the final model of five distinct occupant clusters.
Further Chi2 analyses were used to test distribution differences between clusters in personal and building variables (gender, age, country, educational level, building type, tenure type, type of cohabitants, number of cohabitants, tenure, time of residence, size in square meters, number of rooms, diseases in the last twelve months, and source of subject). Descriptive statistics of each cluster were
also produced, as frequencies, percentages, maximums and minimums, means and standard deviations, in order to produce a more complete picture of the final archetypes.
4.2.4.2
Interviews: text mining.
Interviews were analysed quantitatively by using a text mining method: sentiment analysis. Preparing the data for text mining required to first transcribe the interviews. Then, a spreadsheet was created with each question per row and the transcription of each respondent per column. The spreadsheets were divided by cluster, to analyse the answers per cluster. Each cluster had an answer spreadsheet that was imported for analysis to SPSS Text Analytics for Surveys 4.
Text mining is an analysis method that extracts meaningful information from large amounts of data from open-ended responses. It does so by identifying themes and analysing words in the texts to find patterns. Text mining analyses the answers by treating subjectivity and sentiment in a quantitative manner. Three outputs result from the analysis. First, the software’s linguistic resources extract words and their synonyms that the engine considers important for the analysis; these words are referred to as ‘concepts’. Second, during the extraction of concepts, the semantically similar concepts are grouped into ‘types’. Third, ‘concept patterns’ are produced; these are the combination of a single concept with a type. Combining concepts with types is a way to understand the sentiment of the respondents towards a certain topic (CORPORATION, 2012; Siddiqi, 2014).
4.2.4.3
IEQ, building features, and energy readings: statistical
analysis.
Questionnaire, IEQ monitoring, and energy data were tested for normality with the Kolmogorov-Smirnov and the Shapiro-Wilk tests. Data from the i-Buttons and the HOBOs were downloaded as excel files and imported to SPSS Statistics. Files from both sources were individually checked to ensure that no extraneous readings had occurred, i.e. direct sunlight on sensors, etc. The checklist data were transferred from the paper forms to SPSS. The results of the checklist presented here only deal with summer-related energy consuming variables. Finally, the results of the field study were studied per cluster, and they were compared and related to the results of the TwoStep analysis.
4.3
Results
4.3.1
General results
Of the 1986 invitations, 969 people responded to the questionnaire, of which 761 completed it, representing a response rate of 48.7% and a completion rate of 78.5%. Table 4.2 shows the distribution of the four sources of respondents. TABLE 4.2 Distribution of groups of respondents
Source Survey Invitations
n (%)
Survey Respondents n (%)
Field study Invitations* n (%)
Field study Participants n (%) TU Delft Staff 1000 (50.4) 284 (37.3) 0 (0.0) 0 (0.0) SGR Staff 452 (22.8) 83 (10.9) 49 (59.0) 0 (0.0) BSc Students 316 (15.9) 224 (29.4) 72 (32.1) 6 (8.3) MSc Students 218 (11.0) 170 (22.4) 91 (53.5) 9 (9.8) Total 1986 (100) 761 (100) 212 (27.8) 15 (7.1)
* Staff members from TU Delft could not provide their e-mail address due to confidentiality reasons.
The sample was made of 52.6% men and 47.4% women, the most common level of education was a completed master’s degree (38.2%) followed by completed primary or secondary school (30.0%). The main building type among the sample was the row house with 29.3%, followed by apartments (24.8%), and semidetached houses (16.6%). 50% of participants reported to live with housemates and 23.4% with family members. 80% were renters, therefore not representing the tenure ratio of the Dutch housing stock which is over 40% (Itard, Meijer, Vrins, & Hoiting, 2008). 28% of respondents provided their email address and were invited to the field study. Of those 212 invitations, fifteen participated in the field study. The recruitment process for the field study required special selection as it was intended to have at least one representative of each cluster in the field study. For the descriptives of the statistics, refer to Appendix D.
4.3.2
Cluster results
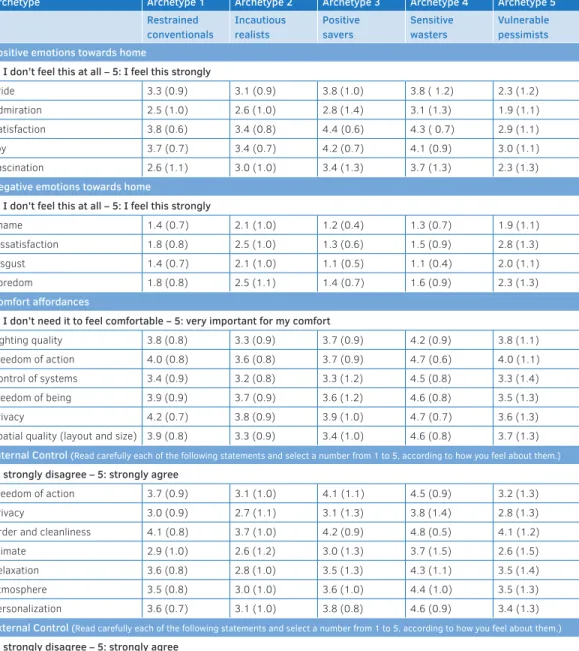
The questionnaire data was tested for normality with the Kolmogorov-Smirnov and the Shapiro-Wilk tests, and no violations were found. Table 4.3 shows the five clusters identified by the TwoStep analysis and the 28 behaviour-related variables composing the model.
The final model comprised variables from three constructs: emotions towards home (negative and positive), comfort affordances, and locus of control (internal and external).
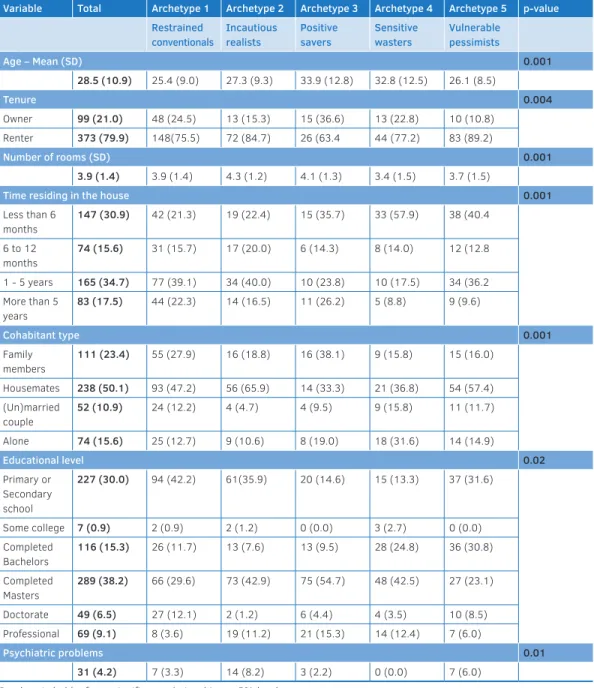
Of the variables pertaining to personal and building characteristics, rather than psycho-behavioural (Table 4.4), statistically significant differences were found for age (p=0.001), tenure type (p=0.004), number of rooms (p<0.001), time residing in home (p=0.001), cohabitant type (p<0.001), educational level (p=0.02), and psychiatric problems (p=0.001).
TABLE 4.3 Variables composing the final model (Mean (SD)).
Archetype Archetype 1 Archetype 2 Archetype 3 Archetype 4 Archetype 5
Restrained conventionals Incautious realists Positive savers Sensitive wasters Vulnerable pessimists
Positive emotions towards home
1: I don’t feel this at all – 5: I feel this strongly
Pride 3.3 (0.9) 3.1 (0.9) 3.8 (1.0) 3.8 ( 1.2) 2.3 (1.2) Admiration 2.5 (1.0) 2.6 (1.0) 2.8 (1.4) 3.1 (1.3) 1.9 (1.1) Satisfaction 3.8 (0.6) 3.4 (0.8) 4.4 (0.6) 4.3 ( 0.7) 2.9 (1.1) Joy 3.7 (0.7) 3.4 (0.7) 4.2 (0.7) 4.1 (0.9) 3.0 (1.1) Fascination 2.6 (1.1) 3.0 (1.0) 3.4 (1.3) 3.7 (1.3) 2.3 (1.3)
Negative emotions towards home
1: I don’t feel this at all – 5: I feel this strongly
Shame 1.4 (0.7) 2.1 (1.0) 1.2 (0.4) 1.3 (0.7) 1.9 (1.1) Dissatisfaction 1.8 (0.8) 2.5 (1.0) 1.3 (0.6) 1.5 (0.9) 2.8 (1.3) Disgust 1.4 (0.7) 2.1 (1.0) 1.1 (0.5) 1.1 (0.4) 2.0 (1.1) Boredom 1.8 (0.8) 2.5 (1.1) 1.4 (0.7) 1.6 (0.9) 2.3 (1.3)
Comfort affordances
1: I don’t need it to feel comfortable – 5: very important for my comfort
Lighting quality 3.8 (0.8) 3.3 (0.9) 3.7 (0.9) 4.2 (0.9) 3.8 (1.1) Freedom of action 4.0 (0.8) 3.6 (0.8) 3.7 (0.9) 4.7 (0.6) 4.0 (1.1) Control of systems 3.4 (0.9) 3.2 (0.8) 3.3 (1.2) 4.5 (0.8) 3.3 (1.4) Freedom of being 3.9 (0.9) 3.7 (0.9) 3.6 (1.2) 4.6 (0.8) 3.5 (1.3) Privacy 4.2 (0.7) 3.8 (0.9) 3.9 (1.0) 4.7 (0.7) 3.6 (1.3) Spatial quality (layout and size) 3.9 (0.8) 3.3 (0.9) 3.4 (1.0) 4.6 (0.8) 3.7 (1.3)
Internal Control (Read carefully each of the following statements and select a number from 1 to 5, according to how you feel about them.)
1: strongly disagree – 5: strongly agree
Freedom of action 3.7 (0.9) 3.1 (1.0) 4.1 (1.1) 4.5 (0.9) 3.2 (1.3) Privacy 3.0 (0.9) 2.7 (1.1) 3.1 (1.3) 3.8 (1.4) 2.8 (1.3) Order and cleanliness 4.1 (0.8) 3.7 (1.0) 4.2 (0.9) 4.8 (0.5) 4.1 (1.2) Climate 2.9 (1.0) 2.6 (1.2) 3.0 (1.3) 3.7 (1.5) 2.6 (1.5) Relaxation 3.6 (0.8) 2.8 (1.0) 3.5 (1.3) 4.3 (1.1) 3.5 (1.4) Atmosphere 3.5 (0.8) 3.0 (1.0) 3.6 (1.0) 4.4 (1.0) 3.5 (1.3) Personalization 3.6 (0.7) 3.1 (1.0) 3.8 (0.8) 4.6 (0.9) 3.4 (1.3)
External Control (Read carefully each of the following statements and select a number from 1 to 5, according to how you feel about them.)
1: strongly disagree – 5: strongly agree
Privacy 2.6 (0.9) 2.4 (1.0) 1.6 (1.0) 1.8 (1.2) 2.4 (1.3) Climate 3.2 (0.9) 2.8 (1.1)) 2.2 (1.2) 2.4 (1.5) 3.5 (1.4) Relaxation 2.4 (0.9) 2.4 (1.1) 1.6 (1.2) 2.2 (1.4) 2.4 (1.3) Atmosphere 2.6 (0.8) 2.7 (1.1) 1.9 (1.1) 2.0 (1.3) 2.7 (1.3) Personalization 2.6 (0.9) 3.1 (1.0) 1.9 (1.3) 2.1 (1.5) 2.5 (1.4) Mood 2.8 (0.9) 2.7 (1.2) 2.4 (1.3) 2.6 (1.5) 2.7 (1.4)
TABLE 4.4 Personal and building characteristics with statistically significant differences between clusters and their p-value per archetype
Variable Total Archetype 1 Archetype 2 Archetype 3 Archetype 4 Archetype 5 p-value
Restrained conventionals Incautious realists Positive savers Sensitive wasters Vulnerable pessimists Age – Mean (SD) 0.001 28.5 (10.9) 25.4 (9.0) 27.3 (9.3) 33.9 (12.8) 32.8 (12.5) 26.1 (8.5) Tenure 0.004 Owner 99 (21.0) 48 (24.5) 13 (15.3) 15 (36.6) 13 (22.8) 10 (10.8) Renter 373 (79.9) 148(75.5) 72 (84.7) 26 (63.4 44 (77.2) 83 (89.2) Number of rooms (SD) 0.001 3.9 (1.4) 3.9 (1.4) 4.3 (1.2) 4.1 (1.3) 3.4 (1.5) 3.7 (1.5)
Time residing in the house 0.001
Less than 6 months 147 (30.9) 42 (21.3) 19 (22.4) 15 (35.7) 33 (57.9) 38 (40.4 6 to 12 months 74 (15.6) 31 (15.7) 17 (20.0) 6 (14.3) 8 (14.0) 12 (12.8 1 - 5 years 165 (34.7) 77 (39.1) 34 (40.0) 10 (23.8) 10 (17.5) 34 (36.2 More than 5 years 83 (17.5) 44 (22.3) 14 (16.5) 11 (26.2) 5 (8.8) 9 (9.6) Cohabitant type 0.001 Family members 111 (23.4) 55 (27.9) 16 (18.8) 16 (38.1) 9 (15.8) 15 (16.0) Housemates 238 (50.1) 93 (47.2) 56 (65.9) 14 (33.3) 21 (36.8) 54 (57.4) (Un)married couple 52 (10.9) 24 (12.2) 4 (4.7) 4 (9.5) 9 (15.8) 11 (11.7) Alone 74 (15.6) 25 (12.7) 9 (10.6) 8 (19.0) 18 (31.6) 14 (14.9) Educational level 0.02 Primary or Secondary school 227 (30.0) 94 (42.2) 61(35.9) 20 (14.6) 15 (13.3) 37 (31.6) Some college 7 (0.9) 2 (0.9) 2 (1.2) 0 (0.0) 3 (2.7) 0 (0.0) Completed Bachelors 116 (15.3) 26 (11.7) 13 (7.6) 13 (9.5) 28 (24.8) 36 (30.8) Completed Masters 289 (38.2) 66 (29.6) 73 (42.9) 75 (54.7) 48 (42.5) 27 (23.1) Doctorate 49 (6.5) 27 (12.1) 2 (1.2) 6 (4.4) 4 (3.5) 10 (8.5) Professional 69 (9.1) 8 (3.6) 19 (11.2) 21 (15.3) 14 (12.4) 7 (6.0) Psychiatric problems 0.01 31 (4.2) 7 (3.3) 14 (8.2) 3 (2.2) 0 (0.0) 7 (6.0) P-values in bold refer to significant relationships at 5% level.
4.3.3
Interview text mining
The text mining analysis was performed per cluster and per question; however, as some of the questions belonged to the same sub-themes; their results were merged into categories. The categories are “energy awareness and motivations of usage”; “general comfort and perfect home”; “sense of control”; and “affordances”. Affordances are individually presented as freedom, temperature, smells, lights, acoustics, privacy, cleanliness, and security.
TABLE 4.5 Percentage of positive sentiments per topic discussed and means per category per archetype
Topic (question) Archetype 1 Archetype 2 Archetype 3 Archetype 4 Archetype 5
Restrained conventionals Incautious realists Positive savers Sensitive wasters Vulnerable pessimists Psychobehavioral Energy awareness and use 60.0 100.0 25.0 33.3 50.0 General comfort
and future home 100.0 66.7 75.0 100.0 100.0 Sense of control 75.0 66.7 0.0 100.0 75.0 Mean psychobehavioral 78.3 77.8 33.3 77.8 75.0 Affordances Freedom 0.0 100.0 100.0 0.0 100.0 Temperature 100.0 100.0 100.0 33.3 0.0 Smells 0.0 100.0 100.0 50.0 100.0 Lights 60.0 0.0 50.0 66.7 42.9 Acoustics 20.0 100.0 100.0 40.0 0.0 Privacy 66.7 100.0 100.0 50.0 100.0 Cleanliness 100.0 50.0 0.0 100.0 50.0 Security 66.7 50.0 100.0 50.0 25.0 Mean affordances 51.7 85.7 92.9 48.8 52.2 Full interview 65.0 81.7 63.1 63.3 63.6
The results of the table show the positive percentages of a linear scale. Therefore, the percentage of “negative sentiments” is the inverse of the results of the table
Table 4.5 shows the percentage of positive sentiments per archetype and per question and the means for each category. Positive ‘types’ produced by the text mining are grouped together. From the table it can be seen that the Incautious Realists (Archetype 2) have the most positive opinions about energy awareness and usage, while the Positive savers (Archetype 3) have the most negative ones. The Vulnerable Pessimists (Archetype 5) has equally positive and negative opinions about energy awareness and usage. For “general comfort and future
home”, Restrained Conventionals, Sensitive wasters, Vulnerable pessimists (Archetypes 1; 4; 5) did not express negative opinions; while Archetypes 2 and 3 only expressed 33% and 25% negative opinions, specifically in terms of “air”; “ceiling lamps”; and “freedom”.
Looking at the means, the results imply that the Positive Savers (Archetype 3) expressed the most positive opinions for affordances, with 93 %. The most negative opinions expressed for this topic came from the Sensitive Wasters (Archetype 4), with 49 %. For “Psycho-behavioural”, Positive savers (Archetype 3) expressed most negative opinions with 67%, and 78% of opinions about “Psycho-behavioural” expressed by Restrained Conventionals (Archetype 1) were positive. For the full interview all Archetypes expressed between 63% and 65% of positive opinions, except for Incautious Realists (Archetype 2) for which almost 82% of opinions expressed in the entire interview were positive.
The detailed results of the text mining analysis are presented in Appendix D and are presented according to the output of the SPSS Text Analytics.
4.3.4
IEQ and energy readings
The field study data was also tested for normality with the Kolmogorov-Smirnov and the Shapiro-Wilk tests, and due the sample size, it was not normally distributed. Descriptive statistics were produced for the energy readings and IEQ monitoring data per archetype. Table 4.6 presents the electricity and gas readings during a month in the summer of 2018. Results propose that there is a large variation in gas and electricity. Due to the low number of participants (fifteen), it was deemed insufficient to perform a statistical comparison of means. It is worth mentioning that in the Netherlands, the average gas and electricity consumption per person per month is 54 m3 and 150 kWh respectively (Milieucentraal, 2019). By treating the archetypes as case studies, from least wasting to most wasting, the archetypes can be ranked as 3; 1; 5; 2; and 4.
TABLE 4.6 Energy consumption readings per archetype (m3 for gas and kWh for electricity in 1-month period)
Archetype Median (min;max)
Archetype 1 Restrained conventionals Gas 98 (59; 501)
Electricity 297 (97; 774)
Archetype 2 Incautious realists Gas 419 (64; 774)
Electricity 394 (170; 617 )
Archetype 3 Positive savers Gas 9 (0; 17)
Electricity 81 (66; 96)
Archetype 4 Sensitive wasters Gas 624 (272; 774)
Electricity 617 (421; 895)
Archetype 5 Vulnerable pessimists Gas 165 (47; 774)
Electricity 300 (80; 617)
Mann-Whitney and Kruskal-Wallis tests were performed to check whether
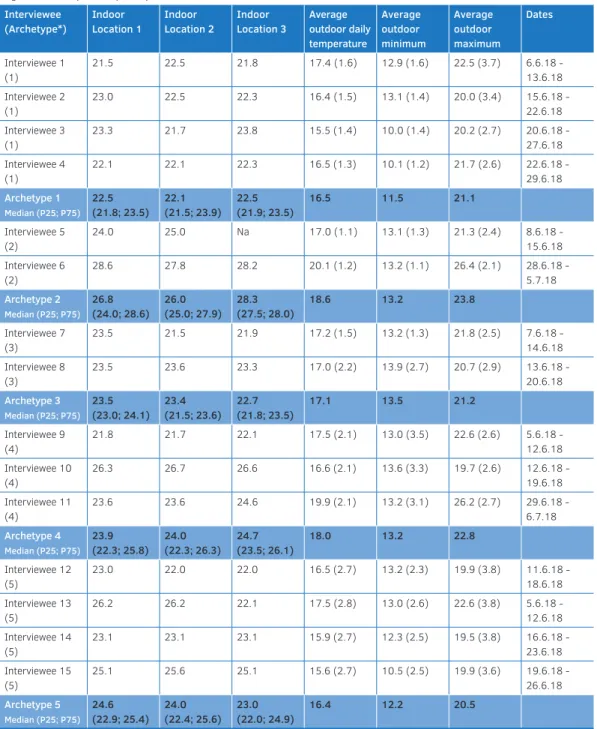
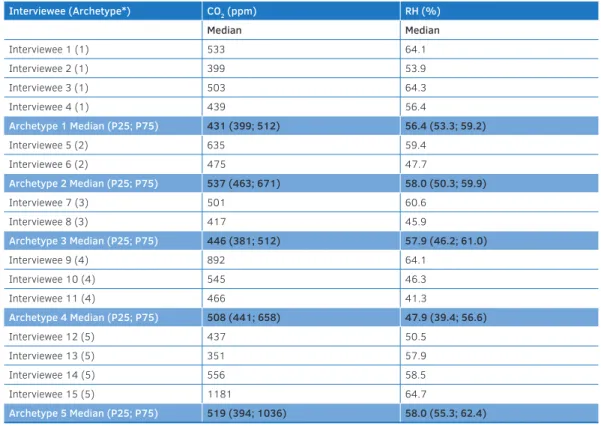
statistical significance exists between measured temperatures and profile. However, as aforementioned, due to the small number of participants, such analysis is inconclusive. Nevertheless, based on the means presented in Table 4.7, it can be suggested that Restrained Conventionals (Archetype 1) have lower temperatures, while the Incautious realists (Archetype 2) have the highest temperatures. Table 4.8 shows the results of the HOBOs as medians and quartiles of CO2 and RH taken during 24 hours in the location where the participant spends most of their time. Statistical analyses were deemed unnecessary due to the small sample. However, it can be seen that the Positive Savers (Archetype 3) present the lowest concentrations of CO2 (447 ppm) while the Vulnerable Pessimists (Archetype 5) have the highest ones (746 ppm). Concerning RH, the Incautious realists (Archetype 2) have the lowest measurements (53%) while the highest ones belong to the Restrained Conventionals (Archetype 1) with 59%. All CO2 and RH results are within the regular levels.
TABLE 4.7 Temperature of “preferred” locations with iButton’s per Archetype and Participant and outdoor temperature in degrees Celsius (1-week period)
Interviewee (Archetype*) Indoor Location 1 Indoor Location 2 Indoor Location 3 Average outdoor daily temperature Average outdoor minimum Average outdoor maximum Dates Interviewee 1 (1) 21.5 22.5 21.8 17.4 (1.6) 12.9 (1.6) 22.5 (3.7) 6.6.18 - 13.6.18 Interviewee 2 (1) 23.0 22.5 22.3 16.4 (1.5) 13.1 (1.4) 20.0 (3.4) 15.6.18 - 22.6.18 Interviewee 3 (1) 23.3 21.7 23.8 15.5 (1.4) 10.0 (1.4) 20.2 (2.7) 20.6.18 - 27.6.18 Interviewee 4 (1) 22.1 22.1 22.3 16.5 (1.3) 10.1 (1.2) 21.7 (2.6) 22.6.18 - 29.6.18 Archetype 1 Median (P25; P75) 22.5 (21.8; 23.5) 22.1 (21.5; 23.9) 22.5 (21.9; 23.5) 16.5 11.5 21.1 Interviewee 5 (2) 24.0 25.0 Na 17.0 (1.1) 13.1 (1.3) 21.3 (2.4) 8.6.18 - 15.6.18 Interviewee 6 (2) 28.6 27.8 28.2 20.1 (1.2) 13.2 (1.1) 26.4 (2.1) 28.6.18 - 5.7.18 Archetype 2 Median (P25; P75) 26.8 (24.0; 28.6) 26.0 (25.0; 27.9) 28.3 (27.5; 28.0) 18.6 13.2 23.8 Interviewee 7 (3) 23.5 21.5 21.9 17.2 (1.5) 13.2 (1.3) 21.8 (2.5) 7.6.18 - 14.6.18 Interviewee 8 (3) 23.5 23.6 23.3 17.0 (2.2) 13.9 (2.7) 20.7 (2.9) 13.6.18 - 20.6.18 Archetype 3 Median (P25; P75) 23.5 (23.0; 24.1) 23.4 (21.5; 23.6) 22.7 (21.8; 23.5) 17.1 13.5 21.2 Interviewee 9 (4) 21.8 21.7 22.1 17.5 (2.1) 13.0 (3.5) 22.6 (2.6) 5.6.18 - 12.6.18 Interviewee 10 (4) 26.3 26.7 26.6 16.6 (2.1) 13.6 (3.3) 19.7 (2.6) 12.6.18 - 19.6.18 Interviewee 11 (4) 23.6 23.6 24.6 19.9 (2.1) 13.2 (3.1) 26.2 (2.7) 29.6.18 - 6.7.18 Archetype 4 Median (P25; P75) 23.9 (22.3; 25.8) 24.0 (22.3; 26.3) 24.7 (23.5; 26.1) 18.0 13.2 22.8 Interviewee 12 (5) 23.0 22.0 22.0 16.5 (2.7) 13.2 (2.3) 19.9 (3.8) 11.6.18 - 18.6.18 Interviewee 13 (5) 26.2 26.2 22.1 17.5 (2.8) 13.0 (2.6) 22.6 (3.8) 5.6.18 - 12.6.18 Interviewee 14 (5) 23.1 23.1 23.1 15.9 (2.7) 12.3 (2.5) 19.5 (3.8) 16.6.18 - 23.6.18 Interviewee 15 (5) 25.1 25.6 25.1 15.6 (2.7) 10.5 (2.5) 19.9 (3.6) 19.6.18 - 26.6.18 Archetype 5 Median (P25; P75) 24.6 (22.9; 25.4) 24.0 (22.4; 25.6) 23.0 (22.0; 24.9) 16.4 12.2 20.5
* Archetype 1: Restrained conventionals; Archetype 2: Incautious realists; Archetype 3: Positive savers; Archetype 4: Sensitive wasters; Archetype 5: Vulnerable pessimists
TABLE 4.8 Carbon dioxide and relative humidity per Archetype and Participant (24-hour period) Interviewee (Archetype*) CO2 (ppm) RH (%) Median Median Interviewee 1 (1) 533 64.1 Interviewee 2 (1) 399 53.9 Interviewee 3 (1) 503 64.3 Interviewee 4 (1) 439 56.4 Archetype 1 Median (P25; P75) 431 (399; 512) 56.4 (53.3; 59.2) Interviewee 5 (2) 635 59.4 Interviewee 6 (2) 475 47.7 Archetype 2 Median (P25; P75) 537 (463; 671) 58.0 (50.3; 59.9) Interviewee 7 (3) 501 60.6 Interviewee 8 (3) 417 45.9 Archetype 3 Median (P25; P75) 446 (381; 512) 57.9 (46.2; 61.0) Interviewee 9 (4) 892 64.1 Interviewee 10 (4) 545 46.3 Interviewee 11 (4) 466 41.3 Archetype 4 Median (P25; P75) 508 (441; 658) 47.9 (39.4; 56.6) Interviewee 12 (5) 437 50.5 Interviewee 13 (5) 351 57.9 Interviewee 14 (5) 556 58.5 Interviewee 15 (5) 1181 64.7 Archetype 5 Median (P25; P75) 519 (394; 1036) 58.0 (55.3; 62.4)
* Archetype 1: Restrained conventionals; Archetype 2: Incautious realists; Archetype 3: Positive savers; Archetype 4: Sensitive wasters; Archetype 5: Vulnerable pessimists
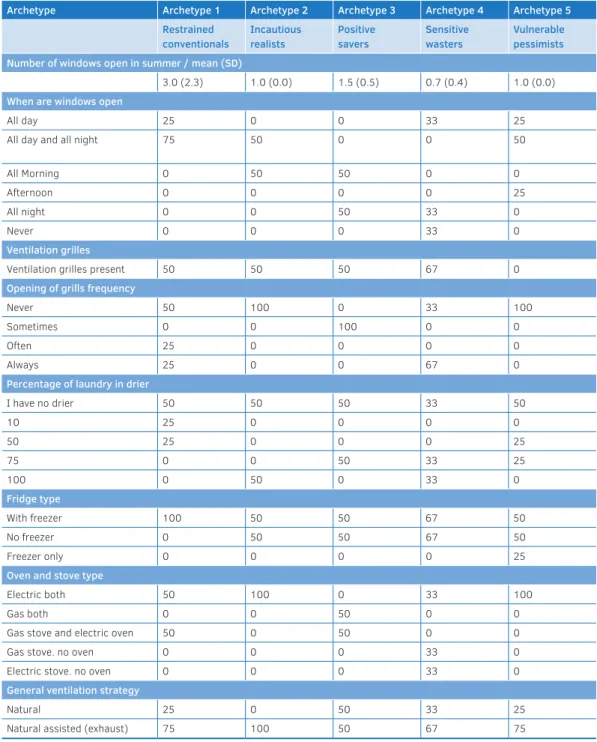
Table 4.9 shows the descriptive statistics of the building checklist. The groups seem to differ considerably in certain aspects: i.e. the number of showers taken per week and their duration ranging from 5.5 to 9.3 showers a week and between 9.3 to 22.5 minutes per shower. More differences exist for behavioural aspects, such as the amount of time windows are open during the summer. None of the participants had air conditioning in their homes.
TABLE 4.9 Summer-related energy variables from building checklist per archetype*.
Archetype Archetype 1 Archetype 2 Archetype 3 Archetype 4 Archetype 5
Restrained conventionals Incautious realists Positive savers Sensitive wasters Vulnerable pessimists
Number of windows open in summer / mean (SD)
3.0 (2.3) 1.0 (0.0) 1.5 (0.5) 0.7 (0.4) 1.0 (0.0)
When are windows open
All day 25 0 0 33 25
All day and all night 75 50 0 0 50
All Morning 0 50 50 0 0
Afternoon 0 0 0 0 25
All night 0 0 50 33 0
Never 0 0 0 33 0
Ventilation grilles
Ventilation grilles present 50 50 50 67 0
Opening of grills frequency
Never 50 100 0 33 100
Sometimes 0 0 100 0 0
Often 25 0 0 0 0
Always 25 0 0 67 0
Percentage of laundry in drier
I have no drier 50 50 50 33 50 10 25 0 0 0 0 50 25 0 0 0 25 75 0 0 50 33 25 100 0 50 0 33 0 Fridge type With freezer 100 50 50 67 50 No freezer 0 50 50 67 50 Freezer only 0 0 0 0 25
Oven and stove type
Electric both 50 100 0 33 100
Gas both 0 0 50 0 0
Gas stove and electric oven 50 0 50 0 0 Gas stove. no oven 0 0 0 33 0 Electric stove. no oven 0 0 0 33 0
General ventilation strategy
Natural 25 0 50 33 25
Natural assisted (exhaust) 75 100 50 67 75
TABLE 4.9 Summer-related energy variables from building checklist per archetype*.
Archetype Archetype 1 Archetype 2 Archetype 3 Archetype 4 Archetype 5
Restrained conventionals Incautious realists Positive savers Sensitive wasters Vulnerable pessimists
Exhaust system location
Toilet 25 0 0 50 33
Kitchen 25 0 50 50 0
Kitchen and toilet 50 0 0 0 0 Other (permanent) 0 100 0 0 67
Weekly number of showers and duration / Mean (SD)
Per week 8.3 (3.9) 6.5 (0.5) 5.5 (0.5) 9.3 (3.3) 7.0 (0.0) Duration minutes 15 (7.0) 22.5 (2.5) 10.0 (4.0) 15.0 (0.0) 9.3 (1.3) * The total of the percentages may not be 100% since in some cases one participant may have chosen more than one answer.
4.3.5
Final Archetype descriptions
Based on the questionnaire results, the variables comprising the model, the text mining outcomes, and the energy readings, the following archetypes are presented and labelled as follows: Restrained Conventionals, Incautious Realists, Positive Savers, Sensitive Wasters, and Vulnerable Pessimists.
Figure 4.2 shows the differences in relative values of each archetype. The names of the archetypes are based on their most extreme features shown by the descriptives from the variables of the questionnaire and the energy readings. The labelling was done as follows: if an archetype has the highest or lowest score for a certain variable, the variable attribute is used to label them. If two archetypes have the same variable as their highest one, the archetype that had the highest score is labelled with the variable attribute, and the second highest variable is used for the other archetype. The labels of the figure are based on the energy readings, interview variables, and statistical model variables. Namely, emotions (positive and negative), control (internal and external based on locus of control), and affordance sensitivity are variables from the statistical model. Energy use and awareness, general comfort, control of environment, and affordance opinions, are based on the results of positive and negative sentiments of opinions of the interview questions. Finally, actual energy reflects the energy readings from the field study. In some cases, for example ‘affordance opinions’ all the questions related to different affordances (light, temperature, privacy, cleanliness, etc.) were combined into a single label.
Emotions positive Actual energy use
Affordance opinions Emotions negative Control internal Control external Affordance sensitivity Energy use and awareness
General comfort Control of environment 0,5 2,0 3,5 5,0 Archetype 1: Restrained Conventionals Archetype 2: Incautious Realists Archetype 3: Positive Savers Archetype 4: Sensitive Wasters Archetype 5: Vulnerable Pessimists
FIG. 4.2 Visual comparison of relative values of different variables per archetype.
Restrained Conventionals (Archetype 1)
The Restrained Conventionals (RCs) is the largest archetype, representing 29.4% of the sample and is the youngest group (mean age: 25.4 years). RCs reported to generally have higher-than-average negative emotions, and low positive emotions, while having high external and low internal control. In interviews, RCs expressed positive opinions for energy motivations, comfort, and sense of control, but a general ambivalence of opinions about affordances. They are the second lowest energy consumer, as 50% of them mentioned to use the drier for 10 to 50% of laundry, and the other half does not own one. They reported the second smallest weekly number of showers (8.3), but they spend the second longest time showering (15 minutes). They had the third highest concentrations of CO2, yet 100% claimed to open the windows “all day and all night” during the summer. It is worth mentioning that Interviewee 2 from this archetype did not occupy the house while the CO2 measurements were taken.
Incautious realists (Archetype 2)
The Incautious Realists are the second largest cluster (22.3%) and have a mean age of 27.3 years (SD: 9.3). 66% of IRs live with housemates and only 10% live alone. This is the second largest renter group (85% renters). IRs have the highest rating of negative emotions, while having low positive emotions. They score lowest in internal locus of control, and higher-than-average external control. They expressed relative
positive opinions about their general affordance and psycho-behavioural topics. They are the second largest waster, according to the energy readings, correlating with the longest showers (22.5 minutes). Yet they take the second smallest weekly amount of showers (6.5). 50% dry their laundry in the drier and 50% do not have one. They have the lowest concentrations of CO2, which relates to all of them having a permanent exhaust.
Positive savers (Archetype 3)
The Positive Savers (PSs) are the third largest cluster (18.0%) and the oldest (33.9 years). 38.1% live with family members, and is the second largest (19.0%) with people living alone. PSs show the second highest ratings in positive emotions, and lowest for negative emotions. They have the lowest scores in external control, and second highest scores in internal control. PSs expressed very highly positive opinions about affordances and slightly negative ones about comfort and energy. According to energy readings, they are the biggest savers, supported by the fact that 50% of them do not own a drier and that rest uses it for 75% of their laundry. They report the smallest weekly number of showers (5.5) and the second shortest showers (10.0 minutes). The have the lowest CO2 concentrations, yet this is not reflected on the reported window opening behaviours or exhaust features. Interviewee 8, who spent the day and night away during the CO2 recordings, also influences this.
Sensitive wasters (Archetype 4)
The Sensitive Wasters (SWs) is the smallest group (14.8%) and has the second oldest mean age of 32.8 (SD: 12.5). 32% of SWs live alone -the highest of all groups- while being the third largest home-owning cluster (22.8%). They scored the highest in positive emotions, and the second lowest in negative emotions. They have the highest internal control scores and second lowest external control. SWs expressed positive opinions about comfort and control of the environment topics but negative ones about energy awareness, while half of their opinions about affordances were positive. They are the highest consumers, reflected on the fact that some of them have more than one fridge, and 66.7% claim to dry 75%-100% of their laundry in the drier. CO2 registered the second highest concentrations, correlating with the report that 33.3% never open the windows during the summertime; however 66.7% claim to have ventilation grilles constantly open.
Vulnerable pessimists (Archetype 5)
The Vulnerable Pessimists (VPs) are the second youngest group (26.1 SD: 8.5). They represent the second largest group living with housemates (57.4%) and largest renters (89.2%). They score lowest in positive emotions and second highest in negative emotions, while having the highest external control scores, and second lowest in internal control. They expressed ambivalence on energy awareness, control of environment, and affordances, but positive sentiments with general comfort. They are the third largest waster according to energy readings, and 50% dry 50%-75% of their laundry in the dryer. CO2 recorded the highest concentrations, which relates to their report of never opening grilles. However, 50% do open one window all day and all night in the summer, nevertheless, 66.7% have a permanent extractor.
4.4
Discussion
In this study using qualitative and quantitative techniques, five occupant archetypes were produced based on the answers of 761 participants and 15 interviewees. The basis of these archetypes were the responses to the specialized questionnaire related to behavioural constructs, namely emotions, control, and needs; with which statistical clusters were produced by using the strongest separating variables. In a previous study involving the same questionnaire but only 193 respondents, the TwoStep cluster analysis produced six clusters. The model of that study was different since it had one more cluster, but also because the segmentation variables included attitudinal variables. In this study, attitude variables were not strong separators to make up the model. An argument for the fact that attitudinal variables were not consistent separators could be that the questions were not correctly formulated, even though they were adapted from an already validated instrument. Another argument could be the fact that the questionnaire did not discern between cognitive and affective attitudes (conscious vs unconscious), and hence dissonance of answers could have created weak separators Compared with the current model, in general, the last three archetypes remained the same, while Archetype 1 merged with 3. However, the previous model, having only 193 respondents, was not as reliable as the one of the present study due to its low number of respondents being less appropriate for the clustering technique.
The goal of archetypal data is to allow customizing technologies that will improve health and comfort of each archetype, while reducing energy consumption. The archetypes are described below by emphasizing their differences between energy use and energy attitudes, and their stress-related factors (emotions and control). Understanding the archetypes from these lenses can give insights into what sort of interventions or lines-of-action could be implemented in their homes to help reduce their energy and increase comfort. The Incautious Realists exemplifies a group that should be treated with higher priority. This is because it is the second largest group, and they report the lowest internal control, higher rates of negative emotions, higher wasting patterns, neglectfulness of comfort affordances, and highest frequency of health issues. It concords with the results of studies that propose interactions between locus of control, stress levels, and levels of illness: specifically with the links found between stress and the prevalence of cardiovascular disease, allergies, or healing time (Byrnes et al., 1998; Costanzo et al., 2004; Kiecolt-Glaser et al., 2002; Marsland, Walsh, Lockwood, & John-Henderson, 2017; Roddenberry & Renk, 2010; Wirtz & von Känel, 2017). In addition this group shows what it is known as attitude-behaviour gap, as they express positive awareness about energy, yet they are relatively high wasters (Claudy, Peterson, & O’Driscoll, 2013). At the other end of the spectrum, the Sensitive Wasters represent the second healthiest group, with highest internal control and positive emotions scores, however, their non-conserving actions are well aligned with their negative views towards energy, which is coupled with their need for comfort and affordances. This high consumption and need for comfort is reflected in studies showing that northern European societies are comfort-oriented energy cultures: they tend to choose to live a comfortable life regardless of the energy needed (Aune et al., 2011). The Positive Savers have a conservative consumption accompanied by seemingly non-green awareness; literature suggests that such incongruence tends to be the result of financial consciousness rather than energy conservation (Kollmuss & Agyeman, 2002; Mills & Schleich, 2012). Restrained Conventionals possess ‘green’ beliefs which are in line with their low-wasting energy readings; this attitude-behaviour congruency has been proposed to be characteristic of single-occupant homes (Clevenger, Haymaker, & Jalili, 2013; Cui, Goodhew, Fewkes, & Chilton, 2011) however, this is not reflected in this archetype as only 13% live alone. They present high negative emotions and low internal control, which may be an indicator of higher stress levels (Abraham, Conner, Jones, & O'Connor, 2016). Finally the Vulnerable Pessimists are similar to the previous archetype in that they also show an alignment between their energy awareness and their energy consumption, and they present risk factors for high stress and hence for poor health and general wellbeing. Such differences among archetypes show to a degree how each archetype requires different lines-of-action to achieve comfort, health, and energy expenditure reduction. An example is to develop solutions that support the high external control (belief that the person cannot change the environment) for example with automation, while offering an
indoor environment that will at all times ensure comfort and health. Another example could be offering solutions that support the high control of the environment while taking into account the high sensitivity to affordances. This could be an interface offering controlling different aspects of the environment, while also showing how the changes influence comfort. For the archetypes in which there seems to have higher energy consumption than what their green beliefs postulate, interfaces showing costs and use could be useful. These interventions should operate in such a way that the behaviours specific to the archetypes do not bypass the energy efficiency of the technologies. Such concepts need further research with mixed methods studies and co-creation techniques. Producing occupant archetypes based on behavioural constructs with mixed-methods is valuable as it enables to better understand the occupant dimension of energy use. Although the archetypes presented in this study are not yet complete, they can shed light onto the occupant mental models, especially in terms of their comfort behaviours. In the interviews, technical and process knowledge data was collected. This is knowledge that is verbally transmitted and is easily retrieved because it is explicit. Different techniques exist to analyse qualitative interview data, mainly qualitative techniques (i.e. content analysis, coding, and recursive analysis). In this study, a type of text mining was used: sentiment analysis. Two reasons exist for using it: it introduces objectivity to the outcome as it is a quantitative technique and sentiment analysis is used to find emotions expressed by participants (an objective of this study). Due to the sample, the quantitative data of the field study (IEQ monitoring and energy readings) cannot be generalized as part of the archetypes, and should rather be observed as case studies. The small sample of the field study can be valuable, as personal data is rarely utilized in the energy research field. Still, the current sample is not representative of the home occupants of the Netherlands, as a large part of it comprises university students, and Dutch and French employees. This therefore, needs to be considered as an influencing factor of the archetypes, since such a population may introduce bias to the outcomes.
The survey involved only self-reported data, while the interviews yielded technical and process knowledge data, which can also be biased. As shown in the description of the archetypes, the self-reported data from the survey and the process knowledge data from the interviews may appear incongruent or dissonant. This is to be expected as in the interviews, participants reflect on how and why they execute the comfort-actions; and while the possibility exists that what they say may be dissimilar to what they actually do, their verbalizations are valuable to understand their ‘process knowledge’. Nevertheless, gathering and combining qualitative and quantitative data is not only to validate each other, but also to reduce potential bias.
Some observations of the human-building interactions are noteworthy. For the air temperature monitoring, no large variations were seen for the top three preferred locations, meaning that the preference for a location is likely unrelated to temperature and related to other spatial attributes; thus temperature and behaviours are unrelated. As far as the building checklist is concerned, it is interesting to note that archetypes tend to live in buildings that present dissimilar characteristics, meaning that the archetypes may not relate to the buildings’ features; in other words, it seems that the environment does not shape the archetype. Energy
consumption varied greatly across and within archetypes. Such discrepancies cannot be generalized and based on the current collected information it is not possible to say if they are the consequences of behavioural patterns or of the building characteristics. The sample was too small and the period of sampling was too short, thus, further research is necessary for the energy use part of this study.
4.5
Conclusion
This study contributes to better understand the motivations behind comfort behaviours of occupiers in their residences and to see possible energy consumption discrepancies among occupiers with different behavioural patterns. It suggests that combining home occupants from different sources, and analysing their answers to a questionnaire, can be clustered into five distinct groups based on their psychological and behavioural models, related to locus of control, emotions towards their own home environment, and the importance they give to comfort affordances. The findings show that each of the archetypes has distinct valence of opinions when asked about topics regarding energy use, energy awareness, general comfort, and an array of affordances, albeit, what they express verbally is not always congruent to the general results of their self-reported answers. Although IEQ and energy readings were also taken, the sample proved too small to set statistical relationships. Finally, a mixed methods approach seems to be promising to better understand the individual needs of groups of people, and to achieve more energy savings and better comfort levels, as the method allows to have detailed and complete archetypes. Practical uses of the archetypes are that they can be used for improved and more accurate simulation and building prediction models. Additionally, archetypes can be used as part of the design process to develop potential tailor-made lines of action for each archetype: their particular characteristics need to be translated into design parameters, such as interfaces that can give the right feedback to the specific
archetype. Architects, constructors, or housing associations can also use models pairing archetypes to specific building features that support the archetypes mental models, to optimize energy consumption and comfort.
Acknowledgements
This research is supported by Saint Gobain Research as part of the PhD “User Experiences and Energy Consumption in Homes” at the Technical University of Delft under the chair of Indoor Environment at the Faculty of Architecture and the Built Environment.
References
Abraham, C., Conner, M., Jones, F., & O’Connor, D. (2016). Health psychology: Routledge.
Ajzen, I. (1991). The theory of planned behavior. Organizational Behavior and Human Decision Processes, 50(2), 179-211.
Aune, M., Ryghaug, M., & Godbolt, Å. L. (2011). Comfort, consciousness and costs—transitions in Norwegian energy culture 1991–2010. Proceedings of the Energy Efficiency First: The Foundation of a Low-Carbon Society, ECEEE.
Azar, E., & Menassa, C. C. (2012). A comprehensive analysis of the impact of occupancy parameters in energy simulation of office buildings. Energy and Buildings, 55, 841-853.
Barthelmes, V. M., Becchio, C., & Corgnati, S. P. (2016). Occupant behavior lifestyles in a residential nearly zero energy building: Effect on energy use and thermal comfort. Science and Technology for the Built Environment, 22(7), 960-975.
Bedir, M., & Kara, E. C. (2017). Behavioral patterns and profiles of electricity consumption in dutch dwellings. Energy and Buildings, 150, 339-352.
Belaid, F., & Garcia, T. (2016). Understanding the spectrum of residential energy-saving behaviours: French evidence using disaggregated data. Energy Economics, 57, 204-214.
Ben, H., & Steemers, K. (2018). Household archetypes and behavioural patterns in UK domestic energy use. Energy efficiency, 11(3), 761-771.
Bluyssen, P. M. (2000). EPIQR and IEQ: indoor environment quality in European apartment buildings. Energy and Buildings, 31(2), 103-110.
Bluyssen, P. M. (2014). What do we need to be able to (re)design healthy and comfortable indoor environments? Intelligent Buildings International, 6(2), 69-92. doi: 10.1080/17508975.2013.866068 Bogner, A., Littig, B., & Menz, W. (2009). Interviewing experts. London: Palgrave Macmillan.
Bonnefoy, X. R., Annesi-Maesano, I., Aznar, L. M., Braubach, M., Croxford, B., Davidson, M., . . . Rudnai, P. (2004). Review of evidence on housing and health. Paper presented at the Fourth Ministerial Conference on Environment and Health Budapest, Hungary.
Byrnes, D. M., Antoni, M. H., Goodkin, K., Efantis-Potter, J., Asthana, D., Simon, T., . . . Fletcher, M. A. (1998). Stressful events, pessimism, natural killer cell cytotoxicity, and cytotoxic/suppressor T cells in HIV+ black women at risk for cervical cancer. Psychosomatic medicine, 60(6), 714-722.
Claudy, M. C., Peterson, M., & O’Driscoll, A. (2013). Understanding the attitude-behavior gap for renewable energy systems using behavioral reasoning theory. Journal of Macromarketing, 33(4), 273-287. Clevenger, C. M., Haymaker, J. R., & Jalili, M. (2013). Demonstrating the impact of the occupant on building
performance. Journal of computing in civil engineering, 28(1), 99-102. CORPORATION, U. I. (2012). IBM SPSS Modeler Text Analytics 15 User’s Guide.
Costanzo, E. S., Lutgendorf, S. K., Kohut, M. L., Nisly, N., Rozeboom, K., Spooner, S., . . . McElhaney, J. E. (2004). Mood and cytokine response to influenza virus in older adults. The Journals of Gerontology Series A: Biological Sciences and Medical Sciences, 59(12), 1328-1333.
Cui, J., Goodhew, S., Fewkes, A., & Chilton, J. (2011). A discussion on the occupancy-related indoor environment and electricity use in a UK residential building. In: Proceedings of Building Simulation 2011: 12th Conference of International Building Performance Simulation Association, Sydney, Austraila,
2170-2177
D’Oca, S., Fabi, V., Corgnati, S. P., & Andersen, R. K. (2014). Effect of thermostat and window opening occupant behavior models on energy use in homes. Paper presented at the Building Simulation. Guerra-Santin, O., Herrera, N. R., Cuerda, E., & Keyson, D. (2016). Mixed methods approach to determine
occupants’ behaviour–Analysis of two case studies. Energy and Buildings, 130, 546-566
Gunay, H. B., O’Brien, W., & Beausoleil-Morrison, I. (2013). A critical review of observation studies, modeling, and simulation of adaptive occupant behaviors in offices. Building and Environment, 70, 31-47. Haines, V., & Mitchell, V. (2014). A persona-based approach to domestic energy retrofit. Building Research &
Information, 42(4), 462-476.
Hong, T., D’Oca, S., Turner, W. J., & Taylor-Lange, S. C. (2015). An ontology to represent energy-related occupant behavior in buildings. Part I: Introduction to the DNAs framework. Building and Environment, 92, 764-777.
Hong, T., Taylor-Lange, S. C., D’Oca, S., Yan, D., & Corgnati, S. P. (2016). Advances in research and applications of energy-related occupant behavior in buildings. Energy and Buildings, 116, 694-702. Hughes, M., & Moreno, G. (2013). Further Analysis of Data from the Household Electricity Usage Study:
Consumer Archetypes: Cambridge: Element Energy Ltd.
Indraganti, M., & Rao, K. D. (2010). Effect of age, gender, economic group and tenure on thermal comfort: a field study in residential buildings in hot and dry climate with seasonal variations. Energy and Buildings, 42(3), 273-281.
Itard, L., Meijer, F., Vrins, E., & Hoiting, H. (2008). Building renovation and modernisation in Europe: State of the art review, January 2008. the Netherlands: Delft Technical University, OTB.
Jia, M., Srinivasan, R. S., & Raheem, A. A. (2017). From occupancy to occupant behavior: An analytical survey of data acquisition technologies, modeling methodologies and simulation coupling mechanisms for building energy efficiency. Renewable and Sustainable Energy Reviews, 68, 525-540.
Karjalainen, S. (2007). Gender differences in thermal comfort and use of thermostats in everyday thermal environments. Building and Environment, 42(4), 1594-1603.
Kiecolt-Glaser, J. K., McGuire, L., Robles, T. F., & Glaser, R. (2002). Psychoneuroimmunology: psychological influences on immune function and health. Journal of consulting and clinical psychology, 70(3), 537. Kollmuss, A., & Agyeman, J. (2002). Mind the gap: why do people act environmentally and what are the
barriers to pro-environmental behavior? Environmental education research, 8(3), 239-260. Lefcourt, H. M. (2014). Locus of control: Current trends in theory & research: Psychology Press.
Majcen, D., Itard, L., & Visscher, H. (2013). Actual and theoretical gas consumption in Dutch dwellings: What causes the differences? Energy Policy, 61, 460-471.
Marsland, A. L., Walsh, C., Lockwood, K., & John-Henderson, N. A. (2017). The effects of acute psychological stress on circulating and stimulated inflammatory markers: a systematic review and meta-analysis. Brain, behavior, and immunity, 64, 208-219.
McGrenere, J., & Ho, W. (2000). Affordances: Clarifying and evolving a concept. Paper presented at the Graphics interface.
Menezes, A. C., Cripps, A., Bouchlaghem, D., & Buswell, R. (2012). Predicted vs. actual energy performance of non-domestic buildings: Using post-occupancy evaluation data to reduce the performance gap. Applied Energy, 97, 355-364.
Milieucentraal. (2019). Energierekening 2019. 2019, from https://www.milieucentraal.nl/energie-besparen/ snel-besparen/grip-op-je-energierekening/energierekening-2019/
Mills, B., & Schleich, J. (2012). Residential energy-efficient technology adoption, energy conservation, knowledge, and attitudes: An analysis of European countries. Energy Policy, 49, 616-628.
Motuziene, V., & Vilutiene, T. (2013). Modelling the effect of the domestic occupancy profiles on predicted energy demand of the energy efficient house. Procedia Engineering, 57, 798-807.
Munro, M., & Leather, P. (2000). Nest-building or investing in the future? Owner-occupiers’ home improvement behaviour. Policy & Politics, 28(4), 511-526.
Norušis, M. J. (2012). IBM SPSS statistics 19 statistical procedures companion: Prentice Hall.
Ortiz, M. A., & Bluyssen, P. M. (2018). Proof-of-concept of a questionnaire to understand occupants’ comfort and energy behaviours: First results on home occupant archetypes. Building and Environment, 134, 47-58.
Ortiz, M. A., Kurvers, S. R., & Bluyssen, P. M. (2017). A review of comfort, health, and energy use:
understanding daily energy use and wellbeing for the development of a new approach to study comfort. Energy and Buildings, 152, 323-335.
Ortony, A., Norman, D., & Revelle, W. (2012). Affect and Proto-Affect in Effective Functioning. In J. M. Fellous & M. A. Arbib (Eds.), Who needs emotions? The brain meets the Robot (pp. 173-202): Oxford University Press.
Parsons, K. C. (2002). The effects of gender, acclimation state, the opportunity to adjust clothing and physical disability on requirements for thermal comfort. Energy and Buildings, 34(6), 593-599. Perloff, R. M. (2010). The dynamics of persuasion: communication and attitudes in the twenty-first century:
Routledge.
Poortinga, W., & Darnton, A. (2016). Segmenting for sustainability: The development of a sustainability segmentation model from a Welsh sample. Journal of environmental psychology, 45, 221-232. Roddenberry, A., & Renk, K. (2010). Locus of control and self-efficacy: potential mediators of stress, illness,
and utilization of health services in college students. Child Psychiatry & Human Development, 41(4), 353-370.
Santin, O. G. (2011). Behavioural patterns and user profiles related to energy consumption for heating. Energy and Buildings, 43(10), 2662-2672.
Siddiqi, B. (2014). Survey Text Mining with IBM SPSS Text Analytics for Surveys: IBM developerWorks. Sovacool, B. K. (2014). What are we doing here? Analyzing fifteen years of energy scholarship and proposing
a social science research agenda. Energy Research & Social Science, 1, 1-29.
Sütterlin, B., Brunner, T. A., & Siegrist, M. (2011). Who puts the most energy into energy conservation? A segmentation of energy consumers based on energy-related behavioral characteristics. Energy Policy, 39(12), 8137-8152.
Tweed, C., Dixon, D., Hinton, E., & Bickerstaff, K. (2014). Thermal comfort practices in the home and their impact on energy consumption. Architectural Engineering and Design Management, 10(1-2), 1-24. Van Raaij, W. F., & Verhallen, T. M. (1983). Patterns of residential energy behavior. Journal of economic
psychology, 4(1-2), 85-106.
Veselý, M., & Zeiler, W. (2014). Personalized conditioning and its impact on thermal comfort and energy performance–A review. Renewable and Sustainable Energy Reviews, 34, 401-408.
Vogiatzi, C., Gemenetzi, G., Massou, L., Poulopoulos, S., Papaefthimiou, S., & Zervas, E. (2018). Energy use and saving in residential sector and occupant behavior: A case study in Athens. Energy and Buildings, 181, 1-9.
Wei, S., Jones, R., & De Wilde, P. (2014). Driving factors for occupant-controlled space heating in residential buildings. Energy and Buildings, 70, 36-44.
Wirtz, P. H., & von Känel, R. (2017). Psychological stress, inflammation, and coronary heart disease. Current cardiology reports, 19(11), 111.
Zalejska-Jonsson, A. (2012). Evaluation of low-energy and conventional residential buildings from occupants’ perspective. Building and Environment, 58, 135-144.