research and industry applications
by
Jeanne Brand
Dissertation presented for the degree of
Doctor of Philosophy (Wine Biotechnology)
at
Stellenbosch University
Institute for Wine Biotechnology, Department of Viticulture and Oenology
Faculty of AgriSciences
Supervisor:
Dr H H Nieuwoudt
Co-supervisor:
Prof M A Vivier
Co-supervisor:
Prof D Valentin
Co-supervisor:
Prof T Næs
Declaration
By submitting this dissertation electronically, I declare that the entirety of the work contained therein is my own, original work, that I am the sole author thereof (save to the extent explicitly otherwise stated) that reproduction and publication thereof by Stellenbosch University will not infringe any third party rights and that I have not previously in its entirety or in part submitted it for obtaining any qualification.
Date: April 2019
Copyright © 2019 Stellenbosch University All rights reserved
Summary
Descriptive sensory analysis techniques are widely used and trusted methodologies. Due to time and cost constraints, the demand for cost-effective methods for profiling is growing rapidly in food and beverage industries including the wine industry.
A number of rapid methods have been tested and validated for various food products. However, further work is needed to identify and address limitations of specific rapid methods, especially reference-based methods, when evaluating complex matrices such as wine. The majority of studies employed novice consumers or trained consumers as judges. The wine industry has an advantage over most food industries with: (1) product experts who can serve as judges and (2) having an extensive lexicon in the form of aroma wheels available that can be used as check-all-that-apply (CATA) questions.
The objective of this study was to identify cost-effective, rapid sensory methods that can be used for wine profiling by researchers and the wine industry alike. Furthermore, the study aimed to optimise the identified methods and to propose workflows that include sensory methods and statistical procedures suited for wine sensory analysis applications.
Four rapid methods were compared to descriptive analysis (DA). The methods tested were CATA, rate-all-that-apply (RATA), Napping, and sorting. Results obtained for the rapid sensory method and DA were similar. It can therefore be concluded that rapid methods are suitable for the sensory evaluation of wine. Industry professionals can therefore be used as sensory judges, and can use a pre-determined lists of attributes as verbalisation tools. CATA and sorting provided the highest quality profiles with the best discrimination between products. Sorting highlights similarities and differences whereas CATA provides more detailed descriptions. In addition, these two methods were found to be easier than rate-all-that-apply (RATA) and Napping to use.
Pivot profile (PP), a reference-based method, was validated against a CATA variant, namely frequency of attribute citation (FC). It was concluded that PP should be used with caution because the choice of pivot on the sensory space could have an influence. This method could, however, be useful when direct comparisons between samples are required, such as benchmarking.
In addition to sensory method development, a number of statistical procedures were also proposed to assist with the interpretation of rapid method data. A workflow to calculate drivers of quality and a strategy to calculate confidence ellipses for PP data were developed.
This study highlights the importance of selecting a fit-for-purpose method. The objective of the experiment being conducted, along with practical restrictions should be taken into account when deciding which method to use.
Opsomming
Beskrywende sensoriese evaluerings tegnieke word algemeen gebruik, en word as betroubare metodes erken. Weens tydsdruk en kostebeperkings is daar ‘n toenemende aanvraag na vinniger sensoriese profileringsmetodes wat gebruik kan word in die voedsel- en drankbedrywe insluitende die wynbedryf.
Verskeie vinnige metodes (“rapid methods”) is reeds getoets en gevalideer vir die sensoriese analise van ‘n verskeidenheid voedselprodukte. Verdere navorsing is egter nodig om voordele en nadele van spesifieke metodes te identifiseer en aan te spreek. Dit is veral die geval wanneer verwysings-gebaseerde metodes gebruik word om komplekse matrikse soos wyn te evalueer. Die meeste studies wat reeds hieroor gedoen is, gebruik verbruikers as sensoriese beoordelaars. Die wynindustrie het ‘n voordeel bo die meeste ander voedselindustrieë in die sin dat: (1) produkkenners as sensoriese beoordelaars kan dien en (2) omvattende beskrywings van die sensoriese eienskappe van wyn reeds in die vorm van, onder andere, geurwiele beskikbaar is. Laasgenoemde kan as merk-alles-wat-van-toepassing-is (“check-all-that-apply” of CATA) vraelyste gebruik word.
Die doel van hierdie studie was om koste-effektiewe, vinnige sensoriese metodes te identifiseer wat vir wynprofilering deur navorsers en die breë wynbedryf gebruik kan word. Dit het ook ten doel gehad om laasgeneomde metodes te optimaliseer en ʼn getoetste werksvloei voor te stel, wat sensoriese metodes en statistiese prosedures insluit. Vier vinnige metodes is vergelyk met beskrywende sensoriese analise (“descriptive analysis” of DA). Die metodes is merk-alles-van-toepassing (“check-all-that-apply” of CATA), gradeer-alles-van-toepassing (“rate-all-that-apply” of RATA), Napping, ʼn spesifieke variasie van projeksiekartering (“projective mapping” of PM), en sortering. Die vinnige sensoriese metodes en beskrywende analise het soortgelyke resultate opgelewer. Vinnige metodes blyk dus geskik te wees vir die sensoriese analise van wyn wanneer vooraf-opgestelde lyste met sensoriese eienskappe gebruik word as verbaliseringstap en produkkenners uit die industrie as beoordelaars optree.
Die hoogste kwaliteit profiele, wat die beste tussen produkte kon onderskei is met behulp van CATA en sortering verkry. Sortering het ooreenkomste en verskille tussen produkte uitgelig, terwyl CATA meer gedetailleerde beskrywings opgelewer het. Volgens die paneellede is beide hierdie metodes makliker om te gebruik as RATA of Napping.
Draaipuntprofilering (“pivot profile”, PP), ‘n verwysingsgebasseerde metode, is gevalideer en vergelyk met ‘n variasie van die CATA metode, naamlik frekwensie van eienskap-aanhaling (“frequency of attribute citation”, FC). Weens die invloed van die keuse van die draaipuntmonster op die sensorieseruimte met PP, moet hierdie metode met versigtigheid gebruik word. Hierdie metode kan wel waardevol wees wanneer ‘n direkte vergelyking tussen produkte verlang word, byvoorbeeld wanneer een produk teen ‘n ander een wat as maatstaf dien, vergelyk word.
om die interpretasie van die data, wat met die vinnige metodes bekom is, te hanteer en beter te visualiseer. ‘n Werksvloei om kwaliteitsdrywers te identifiseer, sowel as ‘n strategie om vertrouensellipsoïede vir draaipuntprofilering te bereken, is ook ontwikkel. Die studie onderstreep hoe belangrikheid van die metodekeuse wanneer ‘n vinnige sensoriese metode vir wynprofilering gebruik word. Die metode wat gekies word moet die verwagte uitkomste van die studie ondersteun en die praktiese beperkings in ag neem.
This dissertation is dedicated to my husband, Jacques Brand,
my two beautiful children, Gretha and Marius,
the rest of my family
and
Biographical sketch
Jeanne Brand (maiden name Treurnicht) was born in Pretoria, South Africa on 9 June 1980. She attended Stellenbosch Primary. At the age of ten, her parents moved to the Southern Free State where she attended several schools in the area and matriculated from Hopetown High in the Northern Cape in 1998. She obtained a bachelor’s degree in chemistry in 2003 and an HonsBSc-degree in Wine Biotechnology in 2004 both at Stellenbosch University. She pursued a career in quality control in the wine industry and completed her MSc in Wine Biotechnology part-time in 2010. She is currently employed by the Department of Oenology and Viticulture as sensory laboratory manager and the coordinator of the Institute for Grape and Wine Sciences’ Sensory Platform.
Acknowledgements
I wish to express my sincere gratitude and appreciation to the following persons and institutions:
Dr Helene Nieuwoudt, Institute for Wine Biotechnology (IWBT), Department of Oenology and Viticulture (DVO), Stellenbosch University, South Africa, for guidance, continuous support, inspiration and for helping me improve my ability to apply critical thinking.
Prof Dominique Valentin, University of Burgundy, France, for teaching me about a completely new field in sensory methodology that I only started to explore during my PhD studies.
Prof Tormod Næs, Nofima, Norway, for assistance with the formulation of new ideas, the initiative to conduct research concerning rapid sensory methods at Stellenbosch University, invaluable help with experimental design, statistical analysis approaches and results interpretation.
Prof Melané Vivier, for insightful critical evaluation and support.
Prof Martin Kidd, for helping with statistical analysis on a daily basis both from a practical and academic perspective.
Valeria Panzeri and Carla Weightman, for technical and moral support as colleagues and friends.
Stellenbosch University sensory panels and industry professionals, for their dedication, passion and hard work as sensory judges “…without an instrument there will be no measurement…” – anonymous.
Winetech and THRIP for funding projects IWBT 13/02 and Tp14080888680
The Department of Science and Technology for funding the “Cross-cultural wine quality perception profiling” project.
My colleagues and the postgraduate students at IWBT and DVO for helping out, sometimes “last minute”, when needed.
My family, especially my dear husband and two children for support, understanding and walking this path with me every step of the way.
Preface
This dissertation is presented as a compilation of six chapters. Each chapter is introduced separately and written according to the style of the journal Food Quality and Preference. In order to keep to the style of the journal, the Latin abbreviation, “et al.” was not written in italics.
Chapter 1 General Introduction and project aims
Chapter 2 Literature review
The application of rapid methods to wine sensory evaluation: A Review
Chapter 3 Research results
In search of suitable rapid sensory methods for wine profiling using industry professionals: A comparison of Free Sorting, Napping, Check-All-That-Apply and Rate-All-That-Apply to Descriptive Analysis
Chapter 4 Research results
Validating Pivot© Profile by means of comparison to Frequency of attribute Citation: Analysing complex products with trained assessors
Chapter 5 Research results
Sorting in Combination with Quality Scoring: A Tool for Industry Professionals to Identify Drivers of Wine Quality Rapidly
Chapter 6 General discussion and conclusions
The chapters in this dissertation were written independently as scientific papers and submitted to scientific journals prior to the compilation of this document. Overlap in certain sections of the literature review chapter and the introductions of the research results chapters was unavoidable.
Some of the sensory methods, discussed and cited, are trademarked. Trademark signs were only included upon the first mention of the method in chapter 1 and not in the rest of the document.
List of Outputs
The work presented in this dissertation was submitted for publication to peer review scientific journals, presented at scientific conferences and communicated through publication of popular articles.
Scientific articles
Brand, J., Kidd, M., Van Antwerpen, L., Valentin, D., Næs, T., & Nieuwoudt, H.H. (2018). Sorting in Combination with Quality Scoring : A Tool for Industry Professionals to Identify Drivers of Wine Quality Rapidly, South African Journal of Enology and Viticulture39, 163–175. (Chapter 5) Brand, J., Valentin, D., Kidd, M., Vivier, M.A., Næs, T., & Nieuwoudt, H.H. Validating Pivot Profile by means of comparison to Frequency of attribute Citation: analysing complex products with trained assessors. (Chapter 4)
Submitted to Food Quality and Preference in August 2018, currently under review.
Brand, J., Næs, T., Kidd, M., Vivier, M.A., Valentin, D., & Nieuwoudt, H.H. In search of suitable rapid sensory methods for wine profiling using industry professionals: A comparison of Free Sorting, Napping, Check-All-That-Apply and Rate-All-That-Apply to descriptive analysis. (Chapter 3)
To be submitted to the South African Journal of Enology and Viticulture in December 2018.
Conference participation
Workshops
Brand, J., Louw, L., Van der Merwe, X., & Nieuwoudt, H.H. (2018). Rapid sensory profiling solutions for industry applications. 41st International SASEV / WINETECH conference, 2–4 October 2018, Somerset West, South Africa
Oral presentations
Brand, J., Valentin, D., Vivier, M.A., Næs, T., & Nieuwoudt, H.H. (2015). Comparison of rapid sensory techniques for white wine profiling. AfroSense Conference, 23–26 November 2015, Stellenbosch, South Africa
Brand, J., Valentin, D., Næs, T., & Nieuwoudt, H.H., (2014). Sustainable sensory methods for profiling of wine: Pros and Cons of Rapid Methods. 36th International SASEV / WINETECH conference, 12–14 November 2014, Somerset West, South Africa
Posters
Brand, J., Valentin, D., Vivier, M.A., Næs, T., Nieuwoudt, H.H. (2016). Comparing twofrequency based sensory profiling methods using a trained panel: Pivot profile & frequency of attribute citation. 7th European Conference on Sensory and Consumer Research, EuroSense, 10–14 September 2016, Dijon France
Brand, J., Van Antwerpen, L., & Nieuwoudt, H.H. (2016). Sorting in combination with quality scoring as a tool to identify drivers of wine quality. 38th International SASEV/WINETECH conference, 23-25 August 2016, Somerset West, South Africa
Brand, J., Valetin, D., Vivier, M. A., Næs, T., & Nieuwoudt, H.H. (2015). Testing the robustness of Pivot profile when profiling wine with a trained panel. AfroSense Conference, 23–26
combination with quality scoring to identify drivers of quality using wine industry professionals as sensory judges. AfroSense Conference, 23–26 November 2015, Stellenbosch, South Africa
Popular articles
Brand, J., & Nieuwoudt, H.H. (2016). Sensory evaluation of wine (Part 2): Sorting – a fast and simple method to describe sensory differences and similarities between wines. Wineland (March) https://www.wineland.co.za/sensory-evaluation-of-wine-part-2/
Brand, J., & Nieuwoudt, H.H. (2016). Sensory evaluation of wine (Part 3): Projective mapping and Napping. Wineland (April) https://www.wineland.co.za/sensory-evaluation-of-wine-part-3/ Brand, J., & Nieuwoudt, H.H. (2016). Sensory evaluation of wine (Part 4): Check-all-that-apply (CATA) – profiling wine with multiple choice questions. Wineland (May)
https://www.wineland.co.za/sensory-evaluation-of-wine-part-4/
Awards
Best poster presentation, AfroSense 2015, 23–26 November 2015, Stellenbosch, South Africa Best poster, 38th International SASEV/WINETECH conference, 23-25 August 2016, Somerset West, South Africa
Table of Contents
1.
General introduction and project aims
2
1.1 Introduction 2
1.2 Project aims 5
1.3 References 6
2.
Literature Review:
The application of rapid methods to wine sensory evaluation: A Review
9
2.1 Introduction 9
2.2 Rapid sensory evaluation methodologies 10
2.2.1 Categorisation of rapid sensory methods 10
2.2.2 Verbal-based methods 12
2.2.3 Similarity-based methods 15
2.2.4 Reference-based methods 19
2.3 Sensory panels performing rapid sensory methods 22
2.3.1 Consumer panels 23
2.3.2 Trained panels 23
2.3.3 Industry professionals / experts 23
2.4 Statistical analysis of rapid sensory method data 23
2.4.1 Single-block analysis techniques 24
2.4.2 Multi-block analysis techniques 25
2.4.3 Visualisation of multivariate maps 28
2.4.4 Pre-treatment of descriptor data 30
2.5 Rapid sensory analysis applied to alcoholic beverages 33
2.5.1 Check-all-that-apply (CATA) 33
2.5.2 Sorting 34
2.5.3 Projective mapping (PM) 35
2.5.4 Polarised sensory positioning (PSP), polarised projective mapping (PPM) and pivot
profile (PP) 36
2.5.5 Comparative rapid sensory method studies 37
2.6 Conclusions 38
3.
Research results:
In search of suitable rapid sensory methods for wine profiling using industry
professionals: A comparison of Free Sorting, Napping, Check-All-That-Apply
and Rate-All-That-Apply to Descriptive Analysis
47
3.1 Introduction 48
3.1.1 Check-all-that-apply (CATA) 48
3.1.2 Rate-all-that-apply (RATA) 49
3.1.3 Sorting 50
3.1.4 Projective mapping and Napping 50
3.1.5 Comparison of rapid sensory methods 51
3.2 Materials and methods 52
3.2.1 Samples 52
3.2.2 Panels 52
3.2.3 Sensory methodology 54
3.2.4 Wine evaluation 57
3.2.5 Data analysis 57
3.3 Results and discussion 61
3.3.1 Multivariate sensory map configuration comparison 61
3.3.2 Comparison of descriptors used 66
3.3.3 Practical considerations 71
3.4 Conclusions 72
3.5 References 73
4.
Research results:
V
alidating Pivot Profile by means of comparison to Frequency of attribute
Citation: Analysing complex products with trained assessors
78
4.1 Introduction 79
4.2 Materials and methods 81
4.2.1 Samples 81 4.2.2 Panel 84 4.2.3 Sensory methodology 84 4.2.4 Data analysis 90 4.3 Results 94 4.3.1 Panel performance 94
4.3.2 Product description and comparison of methods 96
4.5 Conclusions 107
4.6 References 108
5.
Research results:
Sorting in Combination with Quality Scoring: A Tool for Industry Professionls
to Identify Drivers of Wine Quality Rapidly
111
5.1 Introduction 112
5.1.1 Quality assessment of wine 112
5.1.2 Rapid sensory profiling methods for alcoholic beverages 115
5.2 Materials and methods 117
5.2.1 Wines 117
5.2.2 Panel 117
5.2.3 Methodology 118
5.2.4 Statistical analysis and visualisation of data 118
5.3 Results and discussion 121
5.3.1 Quality differences between premium Sauvignon Blanc wines 121 5.3.2 Panel consensus and differences between individual judges’ sorting data 123 5.3.3 Differences and similarities between the wines investigating sorting groups 124 5.3.4 Aroma and flavour profile differences driving Sauvignon Blanc quality 125 5.3.5 Relationship between Sauvignon Blanc “palate” quality and taste, mouthfeel and
chemical analysis 128
5.4 Conclusions 129
5.5 References 130
6.
General discussion and conclusions
134
6.1 General discussion 134
6.2 Summary of research findings 138
6.3 Future recommendations 138
6.4 Concluding remarks 139
1
C
C
h
h
a
a
p
p
t
t
e
e
r
r
1
1
General introduction and
project aims
2
1.
General introduction and project aims
1.1 Introduction
Sensory evaluation is used as a tool in the food and beverage industry throughout and after the production process to assist with the improvement and development of new products or brands, quality control and finally marketing and advertising (Lawless & Heymann, 2010).
A number of sensory methodologies are available in the literature to describe and profile the sensory characteristic of foodstuffs and beverages. Trademarked methods such as Flavour profileTM (Cairncross & Sjostrom, 1950), Quantitative Descriptive Analysis (QDATM, Stone et al., 1974) and the Spectrum methodTM (Munoz & Civille, 1992), as well as non-trademarked methods, Texture profile (Brandt et al., 1963) and Quantitative Flavour Profiling (Stampanoni, 1993) are available. The most trusted, frequently used and adapted method from these descriptive profiling techniques is QDATM (Valentin et al., 2012; Lestringant et al., 2019). Although QDATM provides excellent results, the method is frequently adapted to allow more flexibility. These adapted methods are generally referred to as generic or conventional descriptive analysis (DA) in the literature. Conventional DA is conducted with eight to 15 judges rating the intensity of up to 20 sensory attributes on a line scale and can be described as a three-step process.
During the first step, familiarisation with the products and development of the lexicon used to accurately describe the products is achieved. In order to describe the product space thoroughly and discriminate efficiently between different samples, judges are exposed to a wide variety of different samples spanning the sensory space. In many cases, the samples to be analysed are used during the training process.
The second step involves standardisation and alignment of the panel using reference standards or definitions describing the sensory attributes in the lexicon generated during the first step. Lastly, as the third step, attributes are rated for intensity on a line scale and panel performance is tested. Testing the panel performance involves evaluating the repeatability, ability to discriminate between samples for each judge as well as the consensus amongst the different judges (Lawless & Heymann, 2010).
DA is a trusted methodology that produced accurate high-quality results for various foodstuffs including complex products such as wine (Campo et al., 2010; Heymann & Hopfer, 2013; Sokolowsky et al., 2015; Lestringant et al., 2019). Due to the difficulty of aligning a panel to rate intensity, DA has the drawback that it is time consuming, taking in some cases four to six weeks to profile products, and therefore, costly to perform. In addition, the vocabulary generated is specific for the sample set analysed and training has to
3
be conducted for every different sample set to ensure that the entire sensory space is spanned and fully described. When complex products are evaluated, using a small number of attributes, a loss of information can occur explaining less variability within the data set than when a larger amount of attributes are used (Campo et al., 2010).
In order to address these issues, alternatives for DA were proposed. A class of methods, referred to as rapid methods, divided into three categories, namely verbal-based, similarity-based and reference-similarity-based are amongst these alternatives. Check-all-that-apply (CATA, Adams et al., 2007) is the most widely used verbal-based method. Since the introduction of CATA, variants such as pick-K attributes (Valentin et al., 2012), where the K most dominant attributes are selected to describe the sensory properties of the samples, emerged. Pick-K attributes is known as frequency of attribute citation (FC) when performed by a trained panel (Campo et al., 2008). When verbal methods are used the judges describe the products directly. The results obtained are thus dependent on the analytical abilities and verbal skills of judges. In addition, samples are described one at a time by means of a monadic presentation order. It is, therefore, not possible to take the properties of the rest of the samples in the set into consideration when profiling a specific sample.
Similarity-based methods follow an intuitive approach as a first step. Products are grouped or organised according to similarity first. Description of the sensory properties to explain the similarities between products follows as the second step. All of the samples are presented simultaneously, which gives the judge an idea of the entire sensory space while describing the samples. However, this also results in a limitation of the number of samples that can be evaluated and aggregation of the data is not possible. Sorting (Chollet et al., 2011) and projective mapping (PM, Risvik et al., 1994), including Napping® (Pagès, 2003), fall within this category.
Reference-based methods can provide solutions to some of the previously mentioned shortcomings of verbal-based and similarity-based methods, for example, the limited size of sample sets when performing similarity-based methods. When a large sample set has to be analysed, multiple sessions keeping reference standards constant can address this issue. Polarised sensory positioning (PSP, Teillet et al., 2010), pivot profile© (PP, Thuillier et al., 2015) and polarised projective mapping (PPM, Ares et al., 2013) fall within this category (Valentin et al., 2012; Varela & Ares, 2012). When reference-based methods are conducted a comparative approach is followed. Products are compared to one to three reference samples, also called pivots or poles, instead of to each product in the sample set.
The verbalisation step in these methods, the first step for verbal-based methods and the second step for similarity- and most reference-based methods can be conducted choosing one of two strategies. The first and most commonly used strategy is to generate sensory
4
attributes through free description, where panellists rely on previous experience and memory. The second strategy, to use a predetermined list, is gaining popularity since the statistical analysis of the data is simpler and the task less tedious for sensory judges than free description.
All these rapid methods have the advantage over DA that training is not required and therefore, are faster to perform and more cost-effective. A drawback that most of these methods have is that frequency counts, nominal data, is obtained as opposed to intensity ratings, continuous data (Dooley et al., 2010). From a statistical viewpoint, a larger number of judges might be required for rapid methods than when performing DA. However, these methods have successfully been used to profile complex products such as wine using naïve consumers, formally trained judges and product experts / industry professionals. The majority of the studies involving rapid sensory methodologies employed consumers as judges (for a review consult Valentin et al., 2012; Varela & Ares, 2012).
It has been noted that industry professionals provide a similar but more accurate analytical description of products using rapid methods than consumers (Ballester et al., 2008; Botha, 2015). In addition, Louw et al. (2013) used trained panellist to describe brandies using Napping, Crous (2016) used PSP to discriminate between Chenin Blanc wines and Lelièvre-Desmas et al. (2017) to profile beers using PP.
Furthermore, it is important to note that the different methods have different disadvantages and restrictions. Therefore, methods should be selected to provide fit-for-purpose solutions aligned with the objective of the experiment. In the studies where rapid methods were compared for their suitability to profile wine, only two or three methods were compared to each other or to DA. Only a few comparative studies were conducted on wine using industry professionals as judges (Perrin et al., 2008; Johnson et al., 2013; Torri et al., 2013; Vidal et al., 2018).
It has, therefore, been shown that rapid methods have potential as sensory analysis techniques for complex product evaluation. However, there is no study to date that: (1) compared the most frequently used rapid methods to each other, (2) kept the matrix and panel constant, (3) critically evaluated the difference and similarities between methods keeping fit-for-purpose applications in mind and (4) investigated practical solutions for the sensory analysis of wine.
Furthermore, the need exists to identify and adapt rapid sensory methods using the reliable resources already available within the wine industry. Industry professionals can be used as sensory judges since they establish a common language through work experience, gained from tasting on various industry panels such as competition and certification panels. Lexicon developed over decades, e.g. aroma wheels, can serve as pre-determined lists for
5
the descriptive steps while conducting rapid sensory analysis. The advantage of using industry professionals in combination with the existing lexicon is that a common language is used that is understood by most judges (Ballester et al., 2008; Torri et al., 2013) and giving them the option to add to the list when necessary will continuously update the lexicon in a formal scientific way. Additionally, the statistical handling of the data is easier and faster to conduct and less biased in the sense that the interpretation, coding and combination of terms by the sensory analyst are not as intensive as when free description is allowed as the descriptive step.
Testing these methods using trained panels is also a necessity since industry professionals might not always be available when analyses are required, e.g. during harvest time, it is, therefore, necessary to also test these methodologies using trained panels.
1.2 Project aims
This research project was conducted to provide the wine industry and research centres with information to develop and optimise existing sensory methodology.
The main aim was to evaluate and compare rapid sensory methods to test their suitability for wine profiling using industry professionals and trained panels to obtain analytical sensory profiling data.
Within the framework of this aim, the following specific research objectives were formulated: 1. To identify rapid methods suitable for profiling of wine, a complex product, where
a list of terms can be used as descriptive step and industry professionals (experts) as judges.
2. To validate a reference-based rapid method, PP, for profiling of wine matrices with different within-set variability by:
Testing the stability of the sensory space when changing the reference sample, the pivot.
Comparing PP to a well-established and trusted verbal-based sensory method, frequency of attribute citation (FC), a CATA variant.
3. To propose a workflow with a rapid method as profiling tool to determine drivers of quality in a single sensory evaluation session by:
Testing the suitability of sorting in combination with quality scoring using industry professionals as sensory judges.
6
Determining drivers of quality by means of statistical analysis and inspection of the multivariate sensory map on which the sensory attributes and quality scores were projected.
1.3 References
Adams, J., Williams, S., Lancaster, B., & Foley, M. (2007). Advantages and uses of check-all-that-apply response compared to traditional scaling of attributes for salty snacks. Poster presented at
The 7th Pangborn Sensory Science Symposium. 16 August 2007, Minneapolis, USA. Delegate Manual, pp. 12–418.
Ares, G., de Saldamando, L., Vidal, L., Antúnez, L., Giménez, A., & Varela, P. (2013). Polarized Projective Mapping: Comparison with Polarized Sensory Positioning approaches. Food Quality and Preference, 28, 510–518.
Ballester, J., Patris, B., Symoneaux, R., & Valentin, D. (2008). Conceptual vs. perceptual wine spaces: does expertise matter? Food Quality and Preference, 19, 267–276.
Botha, A. (2015). The use of different oak products during the fermentation and ageing of Chenin Blanc : sensory properties, perceived quality, and consumer preference. MSc thesis, Stellenbosch University. http://hdl.handle.net/10019.1/98006
Brandt, M.A., Skinner, E.A., & Coleman, J.A. (1963). Texture profile method. Journal of Food Science, 28, 404–409.
Cairncross, S., & Sjostrom, I. (1950). Flavor profile. A new approach to flavor problems. Food Technology, 4, 308–311.
Campo, E., Ballester, J., Langlois, J., Dacremont, C., & Valentin, D. (2010). Comparison of conventional descriptive analysis and a citation frequency-based descriptive method for odor profiling: An application to Burgundy Pinot noir wines. Food Quality and Preference, 21, 44–55.
Campo, E., Do, B. V., Ferreira, V., & Valentin, D. (2008). Aroma properties of young Spanish monovarietal white wines: A study using sorting task, list of terms and frequency of citation.
Australian Journal of Grape and Wine Research, 14, 104–115.
Chollet, S., Lelièvre, M., Abdi, H., & Valentin, D. (2011). Sort and beer: Everything you wanted to know about the sorting task but did not dare to ask. Food Quality and Preference, 22, 507–520.
Crous, R. (2016). The sensory characterisation of old ‐ vine Chenin blanc wine : an exploratory study
of the dimensions of quality. MSc thesis, Stellenbosch University,
http://hdl.handle.net/10019.1/100114
Dooley, L., Lee, Y. S., & Meullenet, J. F. (2010). The application of check-all-that-apply (CATA) consumer profiling to preference mapping of vanilla ice cream and its comparison to classical external preference mapping. Food Quality and Preference, 21, 394–401.
Johnson, T. E., Hasted, A., Ristic, R., & Bastian, S. E. P. (2013). Multidimensional scaling (MDS), cluster and descriptive analyses provide preliminary insights into Australian Shiraz wine regional characteristics. Food Quality and Preference, 29, 174–185.
Lawless, H. T., & Heymann, H. (2010). Sensory evaluation of food. Principles and practices. (2nd ed.).
New York, NY, USA: Springer.
Lelièvre-Desmas, M., Valentin, D., & Chollet, S. (2017). Pivot profile method : What is the influence of the pivot and product space? Food Quality and Preference, 61, 6–14.
Louw, L., Malherbe, S., Næs, T., Lambrechts, M., van Rensburg, P., & Nieuwoudt, H. (2013). Validation of two Napping® techniques as rapid sensory screening tools for high alcohol products.
Food Quality and Preference, 30, 192–201.
Munoz, A.M., & Civille, G.V. (1992). The spectrum descriptive analysis method. In: Manual on Descriptive Analysis Testing for Sensory Evaluation (edited by C. Hootman). West Conshohocken, PA: ASTM Manual Series MNL 13.
7
Pagès, J. (2003). Recueil direct de distances sensorielles: application à l’évaluation de dix vins blancs de Val de Loire. Science des Aliments, 23, 679–888.
Perrin, L., Symoneaux, R., Maître, I., Asselin, C., Jourjon, F., & Pagès, J. (2008). Comparison of three sensory methods for use with the Napping® procedure: Case of ten wines from Loire valley. Food Quality and Preference, 19, 1–11.
Risvik, E., Risvik, E., McEwan, J. A., Colwill, J. S., Rogers, R., & Lyon, D. H. (1994). Projective mapping: A tool for sensory analysis and consumer research. Food Quality and Preference, 5, 263–269.
Stampanoni, C.R. (1993). The quantitative flavor profiling technique. Perfumer & Flavorist, 18, 19–24. Stone, H., & Sidel, J. L. (2004). Sensory evaluation practices. San Diego, USA: Elsevier, Academic,
Elsevier.
Stone, H., Sidel, J., Oliviers, S., Woosley, A., & Singleton, R. C. (1974). Sensory evaluation by quantitative descriptive analysis. Food Technology, 52, 24–28.
Teillet, E., Schlich, P., Urbano, C., Cordelle, S., & Guichard, E. (2010). Sensory methodologies and the taste of water. Food Quality and Preference, 21, 967–976.
Thuillier, B., Valentin, D., Marchal, R., & Dacremont, C. (2015). Pivot© profile: A new descriptive method based on free description. Food Quality and Preference, 42, 66–77.
Torri, L., Dinnella, C., Recchia, A., Næs, T., Tuorila, H., & Monteleone, E. (2013). Projective Mapping for interpreting wine aroma differences as perceived by naïve and experienced assessors. Food Quality and Preference, 29, 6–15.
Valentin, D., Chollet, S., Lelièvre, M., & Abdi, H. (2012). Quick and dirty but still pretty good: A review of new descriptive methods in food science. International Journal of Food Science and Technology, 47, 1563–1578.
Varela, P., & Ares, G. (2012). Sensory profiling, the blurred line between sensory and consumer science. A review of novel methods for product characterization. Food Research International, 48, 893–908.
Vidal, L., Ares, G., Hedderley, D. I., Meyners, M., & Jaeger, S. R. (2018). Comparison of rate-all-that-apply (RATA) and check-all-that-rate-all-that-apply (CATA) questions across seven consumer studies. Food Quality and Preference, 67, 49–58.
8
C
C
h
h
a
a
p
p
t
t
e
e
r
r
2
2
Literature review
The application of rapid methods to wine
sensory evaluation: A Review
9
2.
Literature review
The application of rapid methods to wine sensory evaluation: A Review
Abstract
Sensory evaluation of alcoholic beverages, including wine, is essential during product development, production and marketing processes. A radical change in the focus of sensory method development research can be seen in the literature published in the past 20 years. Alternative, fast and cost-effective methods have been proposed, to complement conventional descriptive sensory methodologies and consumer liking tests. Panels with different levels of training and expertise including consumers, trained panels and industry professionals can perform these methods. Thus, consumer and expert sensory profiles, highlighting sensory properties and perceptions not captured with conventional descriptive analysis techniques, can be obtained. This category of methods is known as rapid sensory methods. In this review, the application and modification of these methods in the context of sensory evaluation of wine and alcoholic beverages are discussed. This review therefore complements previous reviews by Valentin et al. (2012) and Varela & Ares (2012) that focused on rapid sensory methods as applied in the food industry by: (1) incorporating the latest rapid method research specific to wine and alcoholic beverages and (2) discussing the application of rapid sensory methods within the alcoholic beverage industry.
Keywords: rapid sensory analysis, wine profiling, sorting, projective mapping, Napping, pivot profile, polarised sensory positioning, check-all-that-apply, rate-all-that-apply
2.1 Introduction
Measuring the perception of food through the senses specifically sight, smell, taste and touch, is crucial to understand the intrinsic and extrinsic properties of foodstuffs to produce products acceptable to consumers. The measuring and interpretation of human perception of food, in a systematic way, has emerged in the 1950s, due to industry demand (Pangborn, 1964). It was developed into a scientific field, namely sensory science, in the 1970s by researchers such as Pangborn (Lawless & Heymann, 2010). The development of sensory methods has been an ongoing process driven by industry demand ever since.
The first cycle of method development was driven by the notion of providing industry with formally validated, sensory methods where the quality of the data is monitored by means of testing various parameters for example panel performance and repeatability. These
10
validated methods, including quantitative descriptive analysis (QDA™), where a trained panel is used and data analysed by means of formal statistical methods, are trusted and well-established (Lawless & Heymann, 2010). However, due to extensive panel training, these methods are expensive and can take up to six weeks to perform. Hence, one of the current focus areas of sensory method development is providing industry with cost-effective fast alternatives known as rapid sensory methods.
2.2 Rapid sensory evaluation methodologies
2.2.1 Categorisation of rapid sensory methods
Rapid sensory methods were categorised by Valentin et al. (2012) according to the psychological processes required from the sensory judges while evaluating products. Three categories were proposed namely verbal-based, similarity-based and reference-based. This classification system focuses on the cognitive process involved when sensory judges perform the main task. This task is in most cases the first step, responsible for the sample configuration of the sensory map.
A more detailed classification system where rapid methods are considered as combinations of different blocks or tasks was introduced by Bécue-Bertaut (2014). This classification system is based on the same principles and cognitive processes as those proposed by Valentin et al. (2012) with the difference that every task is categorised and not only the main task. Therefore, each task associated with a different cognitive process or generating a separate set of data is viewed as a separate block. This approach allows for a structured and detailed explanation of the statistical analysis techniques applied to rapid sensory method data. In addition, it highlights new possibilities for using different combinations of the subsequent building blocks to design fit-for-purpose methodologies (Table 1).
11
TABLE 1
Summary of the classification of rapid sensory methods.
Sensory method Methodological building blocks Reference
Reference Similarity Verbal Rating Ranking
DAd a Lawless and Heymann, 2010
FPe a Dairou and Sieffermann, 2002
CATAf a Adams et al., 2007
RATAg a Ares et al., 2014; Reinbach et al., 2014
Sorting a Labelingb Lawless et al., 1995; Chollet et al., 2011
Napping & PMh a UFPb,c Pagès (2003, 2005); Risvik et al. (1994,1997)
PSPi a Teillet et al., 2010
PPMj a UFPb,c Ares et al., 2013
PPk a Thuillier et al., 2015
aThe task or block that determines the main classification of the method.
bTechnique commonly used during a second supplementary step to obtain sensory descriptors.
Acronyms used for rapid sensory methods: cUltra flash profile, dDescriptive analysis; eFlash profile ;fCheck-all-that-apply ;gRate-all-that-apply; hProjective mapping; iPolarised sensory positioning; jPolarised projective mapping; kPivot profile.
12
2.2.2 Verbal-based methods
Verbal-based methods rely on the ability of sensory judges to express their perception using words, phrases (Valentin et al., 2012) or emoji’s (Jaeger et al., 2018). A list of sensory attributes can be pre-determined and provided by the experimenter, or sensory judges can be asked to provide the terms themselves. Free comments (Lawrence et al., 2013), free listing (Hough & Ferraris, 2010), free choice profiling (FCP, Williams & Langron, 1984), repertory grid (RP, Veinand et al., 2011), flash profiling (FP, Dairou & Siefferman, 2002), check-all-that-apply (CATA, Adams et al., 2007; Lancaster & Foley, 2007) and open-ended questions are examples. These methods were used in sensory science to profile products since the late 1900s.
2.2.2.1 Free choice profiling (FCP) and repertory grid (RG)
FCP (Williams & Langron, 1984) and RP (Veinand et al., 2011) were among the first rapid methods proposed and tested, where the classical descriptive analysis’ training step was bypassed. When performing FCP, sensory judges develop their own vocabulary to describe the samples and rate the intensities of the attributes on line scales. The data is then analysed by means of generalised procrustes analysis (GPA) since judges use different attributes. A similar approach is followed for RG with the difference that attributes are generated by providing triads of samples to judges (Kelly, 1955; Veinand et al., 2011) when the vocabulary is generated. When RG is performed judges are asked to explain in their own words how two of the three products in a triad differ or are alike when compared to the third. As the second step intensities for the vocabulary generated in step one are rated. The main difficulty with FCP and RP is the fact that sensory judges are asked to rate the intensity of attributes on a line scale without prior training.
2.2.2.2 Free description, free listing, free comments and CATA
Free description, free comments or free listing of the sensory properties of products are frequently used to supplement liking data from consumers (Bécue-Bertaut, 2014). In addition it has been used in research for the description of products by industry professionals (Lawrence et al., 2013). Processing the data obtained from these methods is time consuming and prone to biases. These biases can occur during the semantic interpretation of the results by the experimenter since the experimenter together with colleagues and/or industry professionals reduce the number of attributes and not the sensory judges who evaluated the products. In order to simplify data processing and narrow down the variation in language used, CATA has become a popular technique for rapid profiling of food and lately
13
wine (Etaio et al., 2010; Ares et al., 2015 ;Vidal et al., 2015, 2017, 2018; Lezaeta et al., 2017, 2018; Corsi et al., 2017; Alencar et al., 2018; Coste et al., 2018).
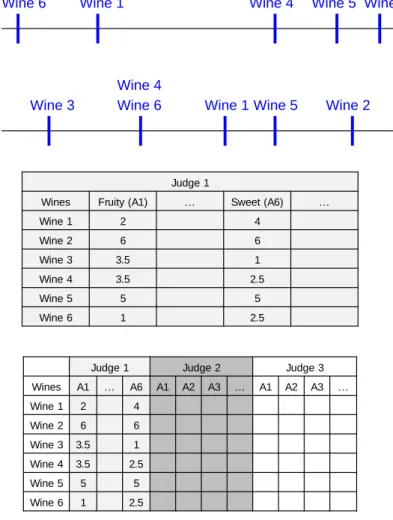
CATA questions consist of a list of words or phrases representing sensory attributes or terms related to emotions and product acceptability (Fig. 1). Sensory judges choose terms from the list to describe the products. Samples are presented according to a randomised monadic serving design where judges get samples in a different order one-at-a-time (Adams et al., 2007; Jaeger et al., 2018).
The most challenging aspect of CATA is to choose the specific terms and deciding on the number of terms when constructing the list. Lists can be constructed during focus group sessions or from literature and previous studies. CATA data are most frequently analysed by means of correspondence analysis (CA), multiple correspondence analysis (MCA) and multiple factor analysis (MFA, Ares et al., 2011a,b; Valentin et al., 2012).
An extension of CATA was proposed where the selected attributes’ intensities are rated. Ares et al. (2014) called this method rate-all-that-apply, using a 3-point scale with “low”, “medium” and “high” (RATA) and Reinbach et al. (2014) called it CATA with intensity rating using a 15-point scale ranging from “very weak” to “very strong”. In addition, 5-point and 7-point scales have also been used (Ares et al., 2014; Franco-Luesma et al., 2016).
Wine 1
Fig. 1. Schematic presentation of a check-all-that-apply (CATA) question and the data capturing process where a contingency table is constructed with the sum of the attribute citations over all the judges for every sample for every attribute. Correspondence analysis (CA) can be performed on the contingency table (right-hand data table) or multi-block analysis, e.g. multiple factor analysis (MFA) can be performed on the individual data tables (left-hand data table).
14
2.2.2.3 Flash profile (FP)
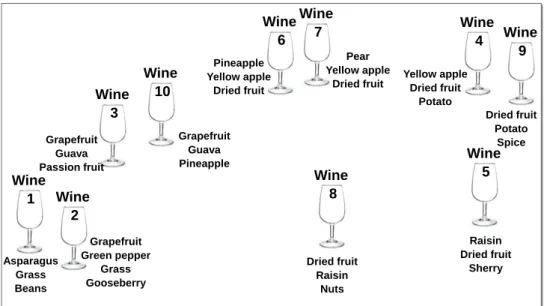
FP is a combination of two methods; free choice profiling (FCP), also known as free description, and ranking (Dairou & Sieffermann, 2002). This method is used to rapidly profile products highlighting the most prominent attributes by ranking them (Fig. 2). When FCP is performed, the samples are presented simultaneously during a two-step process with a break between steps. Sensory judges are asked to evaluate the samples and generate a list of descriptors that will be sufficient to describe them, and discriminate between them. The descriptors from all the judges are pooled. Judges then select the most appropriate descriptors from the list and rank the samples from low to high for each attribute. The individual sensory judges’ rank data are captured (Fig. 2). Due to the ranking step this method is not suitable for analysing large numbers of samples since short-term memory problems might compromise the quality of the data obtained (Valentin et al., 2012).
Least intense Most intense
Fruity aroma
Least intense Most intense
Sweet taste
Wine 1 Wine 2 Wine 4
Wine 3 Wine 6 Wine 5
Wine 1 Wine 4 Wine 2 Wine 3
Wine 5 Wine 6
Judge 1 Judge 2 Judge 3 Wines A1 … A6 A1 A2 A3 … A1 A2 A3 … Wine 1 2 4 Wine 2 6 6 Wine 3 3.5 1 Wine 4 3.5 2.5 Wine 5 5 5 Wine 6 1 2.5 Judge 1
Wines Fruity (A1) … Sweet (A6) …
Wine 1 2 4 Wine 2 6 6 Wine 3 3.5 1 Wine 4 3.5 2.5 Wine 5 5 5 Wine 6 1 2.5
Fig. 2. Schematic presentation of flash profile (FP), where FP is a combination of free choice profiling (FCP) and ranking. Rank data are collected after which generalised procrustus analysis (GPA) is performed with the data from the individual sensory judges as separate data tables.
15
2.2.3 Similarity-based methods
Similarity-based methods used for profiling of food products consist of a two-step process. The first step is to evaluate the entire samples set holistically to identify similarities and differences between samples. The second step is to describe the differences and similarities between the samples using sensory attributes either from a list or from memory. The second step is, therefore, a verbal-based method supplementing the similarity-based method. Sorting (Lawless, 1995; Chollet et al., 2011) and projective mapping (PM, Risvik et al., 1994) with its restricted version called Napping by Pagès (2003) fall into this category.
2.2.3.1 Sorting
Sorting is an intuitive task performed during everyday life by people while organising and interpreting their environment and is, therefore, regarded as an easy task (Qannari et al., 2010; Chollet et al., 2011). When sorting is conducted sensory judges receive all the samples simultaneously in a random order and are asked to group samples according to similarity (Fig. 3).
When judges are allowed to use their own criteria to sort the samples into as many groups as they deem necessary, it is known as the free sorting task (FST). Alternatively, directed sorting can be conducted where the experimenter provides sorting criteria by specifying: (1) the number of groups to be formed or (2) the nature of the properties of the groups. Examples of the latter scenario can be found in studies conducted where Sauvignon Blanc wines were sorted according to: (1) origin (Parr et al., 2010); (2) specific wine style groups called “green” and “not green; (3) ripeness levels with groups called “ripe” and “not ripe” and (4) typicality calling groups “good varietal definition” and “not good varietal definition” (Parr et al. 2007).
A variation of sorting, called hierarchical sorting, has been used and indicated by Courcoux et al. (2012) as more precise and stable than free sorting. During ascendant hierarchical sorting judges are asked to sort the samples according to similarities into groups and then merge groups until only one group exists (Coxon et al., 1999; Courcoux et al., 2012). Descendant sorting can also be conducted where groups are subdivided until no further groups can be formed (Santosa et al., 2010; Cadoret et al. 2011). Both ascendant and descendant can be used conjointly in the same experiment to obtain a full hierarchy of similarities and dissimilarities of the products (Honoré-Chedozeau et al., 2017).
A second step known as “verbalisation” or “labelling” (Bécue-Bertaut et al., 2011) is usually conducted after the judges sorted the wine samples. During this step words are provided to describe the groupings in such a way that the differences and similarities between the groups are highlighted. This step can be seen as a verbal step (Fig. 3)
16
supplementary to the similarity-based main task where samples are grouped. The grouping data obtained during sorting is then captured by constructing similarity or distance matrices.
Judge 1
Group Samples Descriptors
1 Wines 1, 2 Grapefruit, Green pepper, Grass, Asparagus 2 Wines 3, 10 Grapefruit, Guava, Passion fruit 3 Wines 6, 7, 4 Pineapple, Yellow apple, Dried fruit, Pear 4 Wines 5, 8 Dried fruit, Raisin, Nuts, Sherry 5 Wine 9 Dried fruit, Potato, Spice Wine 2 Wine 1 Grapefruit Green pepper Grass Asparagus Group 1 Wine 7 Wine 6 Wine 4 Pineapple Yellow apple Dried fruit Pear Group 3 Wine 10 Wine 3 Grapefruit Guava Passion fruit Group 2 Wine 5 Wine 8 Dried fruit Raisin Nuts Sherry Group 4 v Wine 9 Dried fruit Potato Spice Group 5 v Wine 1 Wine 2 Wine 3 … Wine 10 Wine 1 1 1 0 … 0 Wine 2 1 1 0 … 0 Wine 3 0 0 1 … 1 … … … … … Wine 10 0 0 1 … 1
Passion fruit Guava Grapefruit … Grass
Wine 1 0 0 1 … 1
Wine 2 0 0 1 … 1
Wine 3 1 1 1 … 0
… … … … …
Wine 10 1 1 1 … 0
Passion fruit Guava Grapefruit … Grass
Wine 1 0 2 19 … 21 Wine 2 5 0 22 … 12 Wine 3 15 17 12 … 0 … … … … … Wine 10 7 9 10 … 0 Wine 1 Wine 2 Wine 3 … Wine 10 Wine 1 30 18 2 … 0 Wine 2 18 30 0 … 0 Wine 3 2 0 30 … 1 … … … … … Wine 10 0 0 1 … 30
Fig. 3. Schematic presentation of the sorting task. Products are grouped according to similarity and descriptors provided to describe the groups. The grouping data are captured as distance matrices and the descriptors compiled in contingency tables. DISTATIS can be applied to the individual distance matrices or multidimensional scaling (MDS) to a summed distance matrix with the attributes projected onto the multivariate map as supplementary variables.
17
2.2.3.2 Projective mapping (PM)
Projective mapping (PM) depends on the ability of sensory judges to translate similarities and differences between products onto a two-dimensional space. Samples are presented simultaneously to sensory judges, and the judges are instructed to place samples close to each other if they are similar and far apart if they are different (Risvik et al., 1994, 1997). In addition to positioning the samples on a two-dimensional space, judges are asked to describe each sample using descriptors. Verbal-methods such as ultra flash profile (UFP, Perrin et al., 2008, 2009) or CATA can be used for that purpose (Fig. 4).
The X and Y coordinates for each product is measured and tabulated in a data matrix keeping the X and Y coordinates provided by each judge as a separate data table. The descriptor data are compiled in a contingency table (Fig. 4).
A restricted version of PM was introduced by Pagès (2003) where a 60 x 40 cm two-dimensional space is used for the organisation of the samples and MFA (Escofier & Pagès 1990, Pagès 2003, 2005) is used to analyse the X and Y coordinates of each sample as provided by the sensory judges.
Pagés et al. (2010) proposed to combine PM and sorting calling the new method “sorted Napping”. Sensory judges first organise the samples in terms of similarity by placing them close to or far from each other. As a second step, samples are grouped by drawing circles around them.
18
PM Coordinates table Supplementary data table
Judge 1 Judge 2 … Sensory attributes – sum of all the tasters’ data Wines X1 Y1 X2 Y2 ... Passion fruit Guava … Grapefruit
Wine 1 15 28 12 32 23 16 24 … Wine 10 Wine 1 Grapefruit Guava Passion fruit Green pepper Wine 2 Grape fruit Green pepper Grass Gooseberry Wine 3 Asparagus Grass Beans Wine 6 Pineapple Yellow apple Dried fruit Wine 7 Pear Yellow apple Dried fruit Wine 4 Yellow apple Dried fruit Potato Wine 10 Grapefruit Guava Pineapple Wine 8 Dried fruit Raisin Nuts Dried fruit Potato Spice Wine 9 Wine 5 Raisin Dried fruit Sherry x-coordinate (X1) = 15 y-co or d in at e (Y1) = 28 Wine 9 Wine 5 Wine 8 Wine 7 Wine 6 Wine 10 Wine 2 Wine 1 Wine 3 Wine 4 Asparagus Grass Beans Grapefruit Green pepper Grass Gooseberry Grapefruit Guava Passion fruit Grapefruit Guava Pineapple Pineapple Yellow apple Dried fruit Pear Yellow apple Dried fruit Dried fruit Raisin Nuts Raisin Dried fruit Sherry Dried fruit Potato Spice Yellow apple Dried fruit Potato
Fig. 4. Schematic presentation explaining how projective mapping (PM) is conducted, by arranging samples based on similarity and dissimilarity. The data are captured, measuring the distance from the left bottom corner to obtain X and Y coordinates for each product position. Multiple factor analysis (MFA) is most frequently used to analyse and visualise PM data.
19
2.2.4 Reference-based methods
The common factor between reference-based methods is the use of a reference sample(s), against which the other samples in the set are profiled. The main advantage of this category of methods is the possibility of aggregating data when large sample sets are evaluated, as separate subsets, during different sessions or when samples are analysed over a longer time period. However, a suitable, stable reference, is needed for these methods. Polarised sensory positioning (PSP, Teillet et al., 2010), polarised projective mapping (PPM, Ares et al., 2013) and pivot profile(PP, Thuillier et al., 2015) belong to this category.
2.2.4.1 Polarised sensory positioning (PSP)
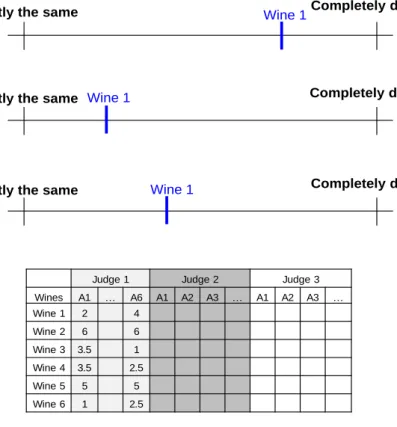
When PSP is performed the similarity between evaluated and reference products, called poles, are rated. The products are served one at a time and judges have to indicate on a line scale anchored at “exactly the same” to “completely different” how similar each product is to each reference (Fig. 5). Teillet et al. (2010) proposed the use of three poles and in addition proposed Triad-PSP where sensory judges are asked to which one of the poles the evaluated product is respectively most similar and least similar.
Exactly the same
Exactly the same
Exactly the same
Completely different Completely different Completely different R1 R2 R3 Wine 1 Wine 1 Wine 1
Judge 1 Judge 2 Judge 3 Wines A1 … A6 A1 A2 A3 … A1 A2 A3 … Wine 1 2 4 Wine 2 6 6 Wine 3 3.5 1 Wine 4 3.5 2.5 Wine 5 5 5 Wine 6 1 2.5
Fig. 5. Schematic presentation of the line scale used during polarised sensory positioning (PSP). The mark on the line scale is measured for each comparison between the reference and the product evaluated. Averages are used if principal component analysis (PCA) or multidimensional scaling (MDS) unfolding is used for the data analysis and individual data if STATIS or multiple factor analysis (MFA) is used.
20
2.2.4.2 Polarised projective mapping (PPM)
Ares et al. (2013) proposed to combine PSP and PM to address the limitations of the methods and combine their strengths. When PM is performed all samples are presented simultaneous, the number of samples that can be analysed is, therefore, limited. When PSP is performed samples are compared to the reference samples one at a time which does not facilitate direct comparison of the samples to each other. Furthermore, descriptive information is obtained only relative to the poles (Teillet et al., 2010).
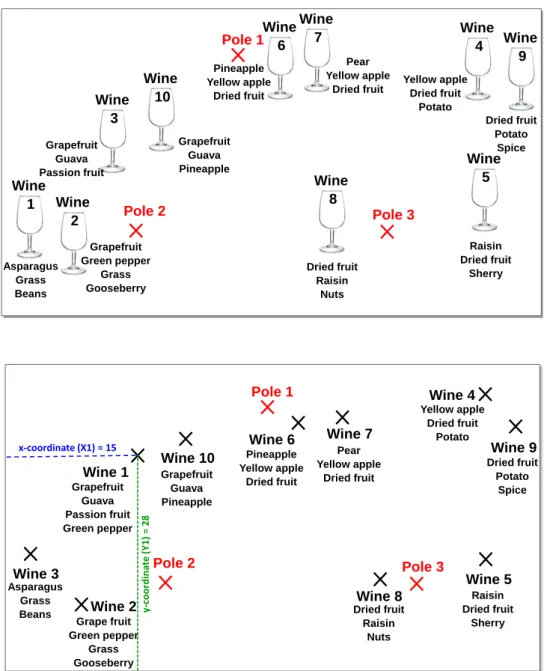
The rationale behind the development of PPM was to develop a method where a direct description of each product could be obtained relative to reference samples. Data aggregation is possible, combining data from more than one sensory evaluation session, by keeping the poles constant for all the sessions. When PPM is performed, sensory judges are provided with a PM sheet where the poles are pre-located and their positions marked. All the samples to be evaluated are presented simultaneously and have to be located close to, if they are similar, or far away, if they are perceived differently, from the poles. A few words to describe each sample are usually provided after the positioning is finalised as for UFP (Perrin et al., 2008) performed during PM (Fig. 6). The data are analysed with MFA using the same protocol as for PM data (Pagès, 2005).
2.2.4.3 Pivot profile (PP)
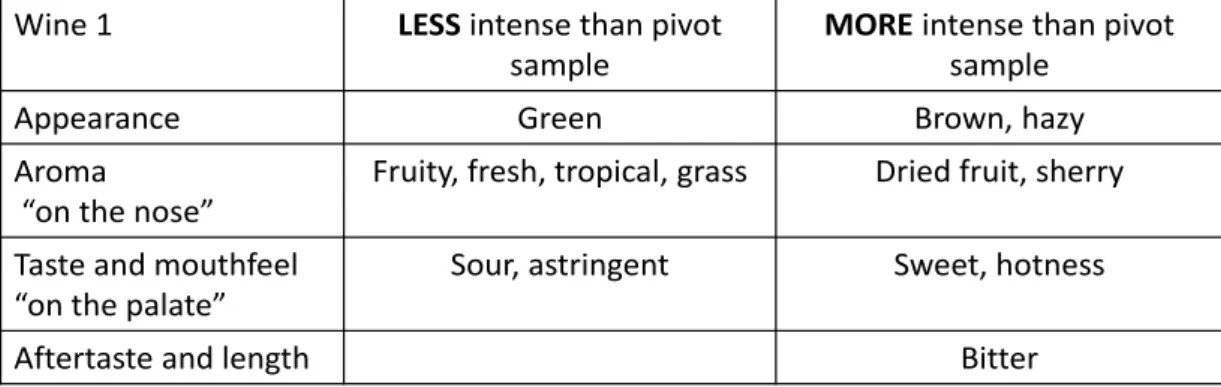
Pivot profile (PP) was introduced by Thuillier et al. (2015) when profiling Champagne with wine industry professionals as sensory judges. When PP is conducted, sensory judges receive samples in pairs of two, the pivot and a sample to be evaluated. Attributes perceived as “more intense” and “less intense” in the sample than the pivot has to be provided (Fig. 7). Judges are restricted to only use words, no phrases and refrain from using the negative form of words. When PP data are collected -1 is recorded when an attribute is perceived less intense than the pivot and 1 if it is perceived more intense. The sum of all the negative and the positive frequencies over all the judges are computed for each attribute for each wine. The number of negative frequencies is subtracted from the number of positive frequencies. The data is translated by adding the absolute value of the minimum to all the values to obtain positive values (Fig. 7).
21
PM Coordinates table Supplementary data table
Judge1 Judge2 … Sensory attributes – sum of all the tasters’ data Wines X1 Y1 X2 Y2 ... Passion fruit Guava … Grapefruit
Wine 1 15 28 12 32 23 16 24 … Wine 10 Wine 9 Wine 5 Wine 8 Wine 7 Wine 6 Wine 10 Wine 2 Wine 1 Wine 3 Wine 4 Asparagus Grass Beans Grapefruit Green pepper Grass Gooseberry Grapefruit Guava Passion fruit Grapefruit Guava Pineapple Pineapple Yellow apple Dried fruit Pear Yellow apple Dried fruit Dried fruit Raisin Nuts Raisin Dried fruit Sherry Dried fruit Potato Spice Yellow apple Dried fruit Potato Wine 1 Grapefruit Guava Passion fruit Green pepper Wine 2 Grape fruit Green pepper Grass Gooseberry Wine 3 Asparagus Grass Beans Wine 6 Pineapple Yellow apple Dried fruit Wine 7 Pear Yellow apple Dried fruit Wine 4 Yellow apple Dried fruit Potato Wine 10 Grapefruit Guava Pineapple Wine 8 Dried fruit Raisin Nuts Dried fruit Potato Spice Wine 9 Wine 5 Raisin Dried fruit Sherry x-coordinate (X1) = 15 y-co or d in at e (Y1) = 28 Pole 1 Pole 2 Pole 3 Pole 1 Pole 2 Pole 3
Fig. 6. Schematic presentation of polarised projective mapping (PPM) showing how sensory judges place the samples relative to the poles on a 2-dimensional surface. The pre-located poles are indicated in red and the unknown products in black. Data capturing and analysis are conducted using the same approach used when projective mapping (PM) is conducted. Multiple factor analysis (MFA) with the descriptors added as supplementary variables is used frequently.
22
Wine 1 LESS intense than pivot
sample
MORE intense than pivot
sample
Appearance Green Brown, hazy
Aroma
“on the nose”
Fruity, fresh, tropical, grass Dried fruit, sherry
Taste and mouthfeel “on the palate”
Sour, astringent Sweet, hotness
Aftertaste and length Bitter
Sum over all the judges
Wines Fruity Tropical Dried fruit Sherry Grass …
Wine 1 -14 -6 15 8 -7 Wine 2 12 13 -11 4 5 Wine 3 7 6 -7 12 11 …… Wine 6 0 0 0 8 9 Judge 1
Wines Fruity Tropical Dried fruit Sherry Grass …
Wine 1 -1 -1 1 1 -1
Wine 2 1 1 -1 1 1
Wine 3 1 0 1 1 1
……
Wine 6 1 0 -1 1 1
Sum over all the judges - translated
Wines Fruity Tropical Dried fruit Sherry Grass …
Wine 1 0 8 29 22 7
Wine 2 26 27 3 18 19
Wine 3 21 20 7 26 25
……
Wine 6 0 0 0 22 23
Fig. 7. Schematic presentation of pivot profile (PP) showing how data from the tasting ballot are captured. The sum of the citation frequencies are recorded for the individual judges, summing over all the sensory judges and translation of the data is performed prior to statistical analysis. Correspondence analysis (CA) is used to visualise PP data.
2.3 Sensory panels performing rapid sensory methods
In a review by Varela and Ares (2012) the authors noted that rapid sensory methods “cross the fine line between sensory testing and consumer acceptance testing”. Although consumers are most frequently used as sensory judges, product specialists referred to as industry professionals or experts are also used as sensory judges to perform rapid sensory