Technological University Dublin Technological University Dublin
ARROW@TU Dublin
ARROW@TU Dublin
Dissertations School of Computing
2019-1
An Investigation of Three Subjective Rating Scales of Mental
An Investigation of Three Subjective Rating Scales of Mental
Workload in Third Level Education
Workload in Third Level Education
Nha Vu Thanh NguyenTechnological University Dublin
Follow this and additional works at: https://arrow.tudublin.ie/scschcomdis
Part of the Computer Engineering Commons
Recommended Citation Recommended Citation
Vu Thanh Nguyen, N. (2019) An Investigation of Three Subjective Rating Scales of Mental Workload in Third Level Education, Masters Dissertation, Technological University Dublin.
This Dissertation is brought to you for free and open access by the School of Computing at ARROW@TU Dublin. It has been accepted for inclusion in Dissertations by an authorized administrator of ARROW@TU Dublin. For more information, please contact
yvonne.desmond@tudublin.ie, arrow.admin@tudublin.ie, brian.widdis@tudublin.ie.
This work is licensed under a Creative Commons Attribution-Noncommercial-Share Alike 3.0 License
Subjective Rating Scales of Mental
Workload in Third Level Education
Nha Vu Thanh Nguyen
A dissertation submitted in partial fulfilment of the requirements of
Dublin Institute of Technology for the degree of
M.Sc. in Computing (Data Analytics)
Declaration
I certify that this dissertation which I now submit for examination for the award of MSc in Computing (Data Analytics), is entirely my work and has not been taken from the work of others save and to the extent that such action has been cited and acknowledged within the text of my work.
This dissertation was prepared according to the regulations for postgraduate study of the Dublin Institute of Technology and has not been submitted in whole or part for an award in any other Institute or University.
The work reported in this dissertation conforms to the principles and requirements of the Institutes guidelines for ethics in research.
Signed: Nha Vu Thanh Nguyen
Mental Workload assessment in educational settings is still recognized as an open re-search problem. Although its application is useful for instructional design, it is still unclear how it can be formally shaped and which factors compose it. This paper is aimed at investigating a set of features believed to shape the construct of mental workload and aggregated together in models trained with supervised machine learning techniques. In detail, multiple linear regression and decision trees have been chosen for training models with features extracted respectively from the NASA Task Load Index and the Workload Profile, well-known self-reporting instruments for assessing mental workload. Additionally, a third feature set was formed as a combination of the two aforementioned feature sets and a number of other features believed to contribute to mental workload modeling in education. Models were trained with cross-validation due to the limited sample size. On the one hand, results show how the features of the NASA Task Load index are more expressive for a regression problem than the other two feature sets. On the other hand, results show how the newly formed feature set can lead to the development of models of the mental workload with a lower error when compared to models built with the other two feature sets and when employed for a classification task.
Keywords: Mental Workload, Cognitive Load Theory, Education, NASA-TLX,
Work-load Profile, Decision Trees, Multiple Linear Regression, Regression, Classification, Machine Learning, Modeling
Acknowledgments
I would like mainly to send many thanks to Dr.Luca Longo, Lecturer of Dublin Insti-tute of Technology and a member of the Applied Intelligence Research Center. This work would not have been possible without his support. He has helped me understand my study goals and encourages me to pursue it. He has shown me, by his example, what a good scientist should be.
I want to thank Dr.Deirdre Lawless, Dr.John McAuley, Dr.Brendan Tierney. As my teachers and mentors, they have taught me more than I could ever give them credit for here. The knowledge I learned from them supported me to complete this work.
I am grateful to my Guru and friends all in the Dublin Meditation center with whom I have had the pleasure to work during this time. They taught me a great deal about love in whatever I have enthusiasm for, light in whatever I concentrate, and life in whatever I put efforts.
Nobody has been more important to me in the pursuit of this project than the members of my family. I want to thank my mother whose love and guidance are with me in whatever I pursue. She has provided me extensive personal and professional advice to complete my Dissertation.
Declaration I
Abstract II
Acknowledgments III
Contents IV
List of Figures VIII
List of Tables XI
List of Acronyms XIV
1 Introduction 1
1.1 Background . . . 1
1.2 Research Project . . . 2
1.3 Research Objectives . . . 3
1.4 Research Methodologies . . . 3
1.5 Scope and Limitations . . . 4
1.6 Document Outline . . . 4
2 Literature review and related work 6 2.1 Cognitive Load Theory . . . 6
2.1.1 Types of cognitive load theory . . . 7
2.2 Mental Workload . . . 10
2.2.1 Measurement methods . . . 11
2.2.2 Multi-dimensional and uni-dimensional measures . . . 12
2.2.3 Criteria for evaluating Mental Workload measures . . . 12
2.3 Subjective rating scales . . . 13
2.3.1 NASA Task Load Index . . . 14
2.3.2 Workload Profile - Multiple resource theory . . . 15
2.4 Summary . . . 16
2.4.1 Gaps in research . . . 16
2.4.2 Research question . . . 18
3 Design and methodology 19 3.1 Business understanding . . . 20
3.1.1 Extended Feature Sets . . . 21
3.1.2 Research hypothesis . . . 22
3.2 Data understanding . . . 22
3.2.1 Data collection . . . 22
3.2.2 Data description . . . 23
3.2.3 Data exploration . . . 24
3.2.4 Data quality verification . . . 25
3.3 Data preparation . . . 26 3.3.1 Data selection . . . 26 3.3.2 Data cleaning . . . 26 3.4 Modelling . . . 27 3.4.1 Error-based learning . . . 29 3.4.2 Information-based learning . . . 30 3.5 Evaluation . . . 30
3.6 Strength and limitation . . . 32
4 Results and discussion 34 4.1 Data description . . . 35
4.1.3 Extended Feature Sets . . . 39
4.2 Data exploration . . . 41
4.2.1 Correlation between Mental Workload score and its factors of three rating scales in whole datasets . . . 41
4.2.2 Difference between Mental Workload score of three rating scales in training datasets . . . 47
4.3 Model training . . . 51
4.3.1 NASA Task Load Index . . . 52
4.3.2 Workload Profile . . . 63
4.3.3 Extended Feature Sets . . . 71
4.4 Model comparison . . . 81
4.4.1 NASA Task Load Index . . . 81
4.4.2 Workload Profile . . . 83
4.4.3 Extended Feature Sets . . . 85
4.5 Model selection . . . 87
4.5.1 Within three subjective rating scales . . . 87
4.5.2 Between subjective rating scales . . . 88
4.6 Strengths and limitations of the results . . . 101
4.6.1 Strengths of the results . . . 101
4.6.2 Limitations of the results . . . 101
5 Conclusion 103 5.1 Research Overview . . . 103
5.2 Problem Definition . . . 103
5.3 Design, Evaluation & Results . . . 104
5.4 Contributions and impact . . . 104
5.5 Future Work & recommendations . . . 105
A Additional content 118
A.1 NASA Task Load Index . . . 118
A.1.1 Data description . . . 118
A.1.2 Model Training . . . 119
A.2 Workload Profile . . . 124
A.2.1 Data description . . . 124
A.2.2 Linear regression . . . 125
A.3 Extended Feature Sets . . . 125
A.3.1 Data description . . . 125
2.1 Six components of NASA Task Load Index . . . 14
2.2 Workload Profile - Multiple Resource Theory . . . 15
3.1 Schema of research . . . 20
3.2 Extended Feature Sets . . . 21
4.1 Histogram of Mental Workload score in three subjective rating scales . 35 4.2 Q-Q plot of NASA dataset (N=230) . . . 36
4.3 Boxplot of NASA dataset (N=230) . . . 36
4.4 Q-Q plot of Workload Profile dataset (N=217) . . . 37
4.5 Box plot of WP dataset (N=217) . . . 38
4.6 Q-Q plot of EFS dataset (N=237) . . . 39
4.7 Box plot of EFS dataset (N=237) . . . 39
4.8 NASA Scatter plot matrix (N=230) . . . 41
4.9 Workload Profile Scatter plot matrix (N=217) . . . 43
4.10 EFS Scatter plot matrix with NASA factors (N=237) . . . 44
4.11 EFS Scatter plot matrix with WP factors (N=237) . . . 45
4.12 EFS Scatter plot matrix with additional factors (N=237) . . . 46
4.13 Histogram of 10 NASA training sets (N=154) . . . 48
4.14 Box plot of 10 NASA training sets (N=154) . . . 48
4.15 Histogram of 10 WP training sets (N=153) . . . 49
4.16 Box plot of 10 WP training sets (N=153) . . . 50
4.18 Box plot of 10 EFS training sets (N=155) . . . 51
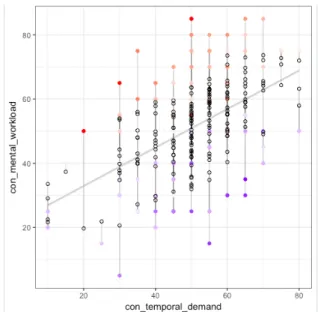
4.19 NASA training result of sample 1 cross-validation (10 times, 10 folds) . 52 4.20 Correlation of MWL and Mental demand in NASA set . . . 54
4.21 Correlation of MWL and Temporal demand in NASA set . . . 54
4.22 Training of NASA in Residual plot . . . 55
4.23 Training of NASA in comparison of Actual & Predicted values . . . 56
4.24 NASA decision tree Gini Regression pruned at cp=0.04157 (N=154) . . 59
4.25 NASA decision tree Gini Classification pruned at cp=0.02985 (N=154) 60 4.26 WP training result of sample 1 cross-validation (10 times, 10 folds) . . 63
4.27 Correlation of MWL and Central Processing (Solving&Deciding) in WP 64 4.28 Correlation of MWL and Verbal material in WP . . . 65
4.29 Training of WP in Residual plot . . . 65
4.30 Training of WP in comparison of Actual & Predicted values . . . 66
4.31 EFS training result of sample 1 cross-validation (10 times, 10 folds) . . 71
4.32 Correlation of MWL and Mental demand in EFS set . . . 73
4.33 Correlation of MWL and Temporal demand in EFS set . . . 73
4.34 Correlation of MWL and Visual attention in EFS set . . . 74
4.35 Training of EFS in Residual plot . . . 74
4.36 Training of EFS in comparison of Actual & Predicted values . . . 75
4.37 Training results of RMSE of Mental Workload score boxplots . . . 89
4.38 Training results of R-squared of Mental Workload score boxplots . . . . 89
4.39 Training results of RMSE of Mental Workload score density plots . . . 90
4.40 Training results of R-squared of Mental Workload score density plots . 90 4.41 Significance test of difference (lower) & estimates of the difference of RMSE, R-squared as in Mental Workload score . . . 91
4.42 Test results of RMSE of Mental Workload score boxplots . . . 92
4.43 Test results of R-squared of Mental Workload score boxplots . . . 93
4.44 Training results of Accuracy, Precision, Recall of Mental Workload classes boxplots . . . 94
4.46 Significance test of difference (lower) & estimates of the difference of
Accuracy in Mental Workload level classes . . . 95
4.47 Significance test of difference (lower) & estimates of the difference of Mental Workload in Precision & Recall . . . 96
4.48 Test results of Accuracy of Mental Workload classes boxplots . . . 99
4.49 Test results of Precision of Mental Workload classes boxplots . . . 99
4.50 Test results of Recall of Mental Workload classes boxplots . . . 100
A.1 Shapiro-wilk test of NASA normality . . . 118
A.2 Variable importance of NASA in model . . . 119
A.3 NASA decision tree trained by Information Gain (N=154) . . . 119
A.4 NASA decision tree Information Gain with cross-validation (N=154) . . 120
A.5 NASA decision tree Information Gain trained by Grid, tuning parame-ters and cross-validation on actual sample (N=154) . . . 120
A.6 NASA decision tree Information Gain trained by Grid, tuning parame-ters and cross-validation on upSampling (N=154) . . . 121
A.7 NASA model decision tree Regression trained by Gini Index (N=154) . 121 A.8 NASA decision tree Regression trained by Gini Index (N=154) . . . 122
A.9 NASA decision tree Gini Regression with cross-validation (N=154) . . . 122
A.10 NASA model decision tree Classification trained by Gini Index (N=154) 123 A.11 NASA decision tree Classification trained by Gini Index (N=154) . . . 123
A.12 NASA decision tree Gini Classification with cross-validation (N=154) . 124 A.13 Shapiro-wilk test of WP normality . . . 124
A.14 Variable importance of WP in model . . . 125
A.15 Shapiro-wilk test of EFS normality . . . 125
List of Tables
3.1 Variable definition of 3 subjective measures . . . 23
3.2 Data exploration of NASA . . . 24
3.3 Data exploration of WP . . . 24
3.4 Data exploration of EFS . . . 25
4.1 MWL as categorical feature in NASA . . . 37
4.2 MWL as categorical feature in WP . . . 38
4.3 MWL as categorical feature in EFS . . . 40
4.4 Correlation of Mental Workload score & factors in NASA set . . . 42
4.5 Correlation of Mental Workload score & factors in WP set . . . 43
4.6 Correlation of Mental Workload score & NASA factors in EFS set . . . 44
4.7 Correlation of Mental Workload score & WP factors in EFS set . . . . 45
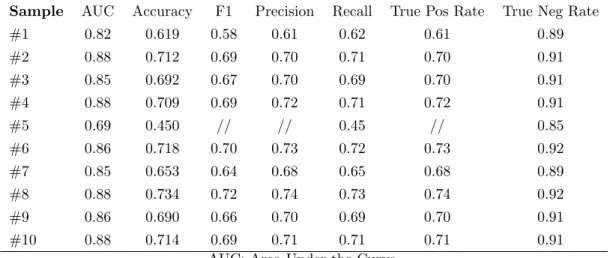
4.8 Correlation of Mental Workload score & additional factors in EFS set . 46 4.9 Summary of NASA training result of 10 samples cross-validation (10 times, 10 folds) . . . 53
4.10 Variable importance of NASA in model . . . 54
4.11 Summary of NASA training result of 10 samples cross-validation (10 times, 10 folds) . . . 57
4.12 Summary of NASA Information Gain training result of 10 Up-sampling cross-validation (10 times, 10 folds) . . . 58
4.13 Summary of NASA Information Gain training result of 10 Up-sampling cross-validation on each class . . . 58
4.15 Summary of NASA Gini Classification training result of 10 samples cross-validation (10 times, 10 folds) . . . 61 4.16 Summary of NASA Gini Classification training result of 10 Up-sampling
cross-validation (10 times, 10 folds) . . . 61 4.17 Summary of NASA Gini Classification training result of 10 Up-sampling
cross-validation on each class . . . 62 4.18 Summary of WP training result of 10 samples cross-validation (10 times,
10 folds) . . . 63 4.19 Variable importance of WP in model . . . 64 4.20 Summary of WP training result of 10 samples cross-validation (10 times,
10 folds) . . . 67 4.21 Summary of WP training result of 10 Up-sampling cross-validation (10
times, 10 folds) . . . 67 4.22 Summary of WP training result of 10 Up-sampling cross-validation on
each class . . . 68 4.23 Summary of WP Gini Regression training result of 10 samples
cross-validation (10 times, 10 folds) . . . 69 4.24 Summary of WP Gini Classification training result of 10 samples
cross-validation (10 times, 10 folds) . . . 69 4.25 Summary of WP Gini Classification training result of 10 Up-sampling
cross-validation (10 times, 10 folds) . . . 70 4.26 Summary of WP Gini Classification training result of 10 Up-sampling
cross-validation on each class . . . 70 4.27 Summary of EFS training result of 10 samples cross-validation (10
times, 10 folds) . . . 72 4.28 Variable importance of EFS in model . . . 72 4.29 Summary of EFS training result of 10 samples cross-validation (10
4.30 Summary of EFS training result of 10 Up-sampling cross-validation (10
times, 10 folds) . . . 76
4.31 Summary of EFS training result of 10 Up-sampling cross-validation on each class (10 times, 10 folds) . . . 77
4.32 Summary of EFS Gini Regression training result of 10 samples cross-validation (10 times, 10 folds) . . . 78
4.33 Summary of EFS Gini Classification training result of 10 samples cross-validation (10 times, 10 folds) . . . 78
4.34 Summary of EFS Gini Classification training result of 10 Up-sampling cross-validation (10 times, 10 folds) . . . 79
4.35 Summary of EFS Gini Classification training result of 10 Up-sampling cross-validation on each class . . . 79
4.36 NASA multiple linear regression test results of 10 samples . . . 81
4.37 NASA decision tree Information Gain test results of 10 samples . . . . 81
4.38 NASA Gini Regression test results of 10 samples . . . 82
4.39 NASA Gini Classification test results of 10 samples . . . 82
4.40 WP multiple linear regression in 10 test results . . . 83
4.41 WP decision tree information gain test results of 10 samples . . . 83
4.42 WP Gini Regression test results of 10 samples . . . 84
4.43 WP Gini Classification test results of 10 samples . . . 84
4.44 EFS multiple linear regression in 10 test results . . . 85
4.45 EFS decision tree information gain test results of 10 samples . . . 85
4.46 EFS Gini Regression test results of 10 samples . . . 86
4.47 EFS Gini Classification test results of 10 samples . . . 86
4.48 Test results of Mental Workload score in comparison of RMSE, R-squared 92 4.49 Test results of Mental Workload classes in comparison of Accuracy, Precision, Recall . . . 97
Acc Accuracy
ANOVA Analysis of Variance
CLT Cognitive Load Theory
CTML Cognitive Theory of Multimedia Learning
DT Decision Tree
EFS Extended Feature Sets rating scale
GiniClas Decision Tree GINI Classification
GiniReg Decision Tree GINI Regression
Inf Information
LR Linear Regression
MAE Mean Absolute Error
MSc Master of Science
MWL Mental Workload
NASA, NASA TLX NASA rating scale
Pre Precision
Rec Recall
RMSE Root Mean Squared Error
Chapter 1
Introduction
1.1
Background
A person affected by Mental Workload is likely to show some psychological symptoms such as emotional stress and inability in achieving goals which is typically felt over a sustained period of time. This is often accompanied by feelings of hopelessness and inadequacy resulting in more errors in task performance and results (Miyake, 2001). Hence, Mental Workload on a student in the third level education can directly impact on the effectiveness and quality of ones learning process (Fredricks, Blumenfeld, & Paris, 2004).
The third level Education System in Ireland comprises of all training after second-level, encompassing higher education in universities and colleges, further education on Post Leaving Certificate and other courses. The degree-awarding authorities can grant awards at all academic levels 1, approved by the Government of Ireland. According to The Higher Education Authority (HEA, 2004), the 35 years from 1965 to 2000 saw the number of students in the third level education grow from 18,200 to almost 120,000 2. These rapidly increasing numbers reflect the number of third-level students seeking help with depression, anxiety, relationship problems and academic issues. Today these numbers have reached unprecedented levels. Members of Psychological Counsellors in
1https://en.wikipedia.org/wiki/Third-level education in the Republic of Ireland 2www.education.ie (A Brief Description Of the Irish Education System)
Higher Education pointed to a 40% increase in demand for counseling over the last 10 years, with waiting lists for counseling services at many colleges 3. In 2016, the USI Student Dropout Survey found that 61.6% of students experienced burnout while attending third level and 27.6% dropped out due to stress and anxiety 4.
Nowadays, diversity appears in many fields, especially in the third level education. Many students who study together come from a different culture, different background, different mother-tongue, different ages, male and female, and often different in behav-ior. Considering all of this, it is necessary to value the Mental Workload through the verbal or written feedback of students. Based on self-assessment, the lecturer can predict the Mental Workload on students participated in study activities.
Previous studies have focused mainly on laborer Mental Workload in the ergonomics area of the industry and on working environments in order to improve staff produc-tivity or performance. This study aims to investigate three subjective rating scales of Mental Workload, which is still recognized as an open research problem in higher education.
1.2
Research Project
Many studies nowadays discuss Mental Workload in the office and factory environment. How about Mental Workload in education, especially in the third level education? And the question is: can a mechanism that creates “machine learning” support a lectures strategy?
In this research, Mental Workload is measured through three self-assessment instru-ments: the NASA Task Load Index, the Workload Profile, well-known self-reporting instruments for assessing mental workload and a third feature set which was formed as a combination of the two above but also considering features believed to contribute to mental workload modeling in Education. The students would carry out self-assessment
3 https://www.irishtimes.com/news/education/there-is-a-tsunami-of-third-level-students-with-mental-health-problems-1.2924516
4 https://www.independent.ie/irish-news/education/going-to-college/coping-with-college-37239268.html
CHAPTER 1. INTRODUCTION
before and after their class activities. To obtain a more accurate prediction model, strong correlation variables and good control features will allow for the critical im-provements in this research. Measurable attributes need to be included in designing advanced responses to problem case and reference models.
1.3
Research Objectives
Literature review is for stating the concepts and opinions on Mental Workload, which is the indicator equivalent to Cognitive Load Theory, but in education. The design of the experiment is to create a proper model learning environment for three self-assessment scales of Mental Workload. Implementation and execution of the designed solution are required in order to find the optimal model. This is done by algorithms of error-based and information-based data which, once learnt, become critical in forming the data structure of three given data sets. For the evaluation of proposed solutions for models, as a continuous target and a categorical target, are two combined indicators (RMSE, R-squared) and the combination of Accuracy, Precision and Recall, respectively.
1.4
Research Methodologies
Mental Workload is an excellent measure for designing instructional conditions and also for use a relevant indicator in predicting the learning processes. With the clarity of relevant variables and a validated ques
tionnaire, we can adopt two supervised learning algorithms which are good pre-dictors for optimal training of categorical and continuous, namely, Decision Tree and Linear Regression, respectively.
The research methodologies are quantitative, i.e., finding the relationship between student Mental Workload and statistically significant features, learning algorithms, training models, and carrying out hypothesis tests on comparative indicators for the optimal model selection.
1.5
Scope and Limitations
The domain is a supervised process set to identify the correlated variables in the relationship between student Mental Workload and the features affecting instructional conditions.
The scope of the research is limited to one module and the number of classes in four years with only one lecturer. Thus, the sample may not be entirely representative of the whole student population base.
1.6
Document Outline
This document is organized into five chapters:
• Chapter 1 is this introduction to the dissertation which provides the overall context and answers to two important questions needed in order to proceed with the research: who cares? and what for?
• Chapter 2 introduces the theoretical frameworks, including Cognitive Load The-ory and how to apply it for education through measuring Mental Workload indirectly by the subjective rating scales. This will present the practical aspects of designing instructional conditions based on individual Mental Workload score. Subsequently, this research will fill the gap in existing research by its findings. • Chapter 3 describes the research hypothesis and makes an approach in solving
the stated problem. It also attempts to clearly explain the steps to collect and prepare the data, in order to proceed with model training and testing. Lastly, selecting the optimal model is based on the best outcome of accuracy and least errors found.
• Chapter 4 focuses on the implementation of the optimal model and the results thereof. Based on this there is a critical discussion about the results and the existing research in similar contexts.
CHAPTER 1. INTRODUCTION
• Finally, chapter 5 concludes the contribution of the research to the existing body of knowledge.
Literature review and related work
2.1
Cognitive Load Theory
Cognitive load is mainly referred to as human Mental Workload in the field of Er-gonomics, used to improve working conditions (Ree et al., 2014; Weigl, Mller, An-gerer, & Hoffmann, 2014; Balfe, Crowley, Smith, & Longo, 2017). Regarding that, it becomes increasingly popular as one of the first-hand indicators when taking into account learning interaction (Foo et al., 2013). J. Sweller (1988) discussed learners can absorb and retain information effectively only if it is provided in a way that does not “overload” their mental capacity. In other words, instructional design and materials of an instructor can be used to reduce cognitive load in learners (J. Sweller, 1994). An instructor would play her/his role to help learners become an expert in a given topic. An expert can categorize problems using the capacity of long-term memory; the ability to explain and perform tasks easily.
Cognitive load theory (CLT) is a contemporary educational psychology theory applying cognitive science principles to instructional design (V. M. J. Sweller J. & Paas, 1998). It has been considered among instructional designers for early years to create resources in such a way that encourages the activities of the learners and optimizes their learning performance (Jeng-Chung, 2014). Within CLT, three types of cognitive load have been conceptualized to have an adequate Mental Workload. It would be a balance between the intrinsic difficulties of a task (intrinsic load) (Galy &
CHAPTER 2. LITERATURE REVIEW AND RELATED WORK
Mlan, 2015), the way it is presented (extraneous load) (Blayney, Kalyuga, & Sweller, 2015; Galy & Mlan, 2015) and the amount of effort performed by the learner to integrate the new knowledge into the old one (germane load).
2.1.1
Types of cognitive load theory
Cognitive Load is understood under three types, namely, intrinsic cognitive load, ex-traneous cognitive load, and germane cognitive load.
• Intrinsic Cognitive Load is the term that was first used in the early 1990s by Chandler and Sweller (1991). It describes how much capacity of the working memory is used by the interactivity of the units of information being processed. • Extraneous Cognitive Load is the term used to express some type of unnec-essary (artificially induced) cognitive load which is attributed to the design of the instructional materials. Chandler and Sweller (1991) introduced this con-cept of extraneous cognitive load to report the results of experiments. These experiments were conducted to investigate the working memory load, such as instructors presentation, the textbook in its format and the external distrac-tions, the internal emotional concerns, etc. Many of these experiments involved materials demonstrating the split-attention effect. They found that the format of instructional materials either promoted or limited learning.
• Germane Cognitive Load was first described by V. M. J. Sweller J. and Paas (1998). It is known as the processing, construction, and automation of schema. Therefore, a germane load is working memory of learners, which will process new information into advanced and more complex memory storage.
The three types of Cognitive Load mentioned above together have an interactive impact on learners. The more extraneous load, the less room there will be for the germane load. Hence it is necessary to have the instructional materials designed to limit the amount of extraneous load and to facilitate the increase in germane load.
2.1.2
Instructional conditions in the third level education
Third level students, who get involved in class activities will improve in various men-tal abilities like critical thinking, decision making, memory and analytical skills, etc. However, psychological fear and a sense of inferiority can lead to non-optimal mental workload devoted to the learning task, with higher chances of error, less productivity, and a predominant sense of uneasiness. As a driving factor in class activity, a lecturer needs to recognize and to predict the students problem and to build teaching activities and instructional materials in order to resolve the Mental WorkloadIn practice, interactive learning is related to instructional strategies, in-class activ-ities, goal setting, and individual personalities (Wei, Chen, & Kinshuk, 2012) (pg 540). A good way to increase learner’s interaction is by reducing the human Mental Work-load when interacting on workflow. Instead of assessing learning progress, it would be have a greater impact to assess human Mental Workload (MWL), as it is proven to have an early effect on student performance. This study attempts to identify the different variations of student Mental Workload through a variet of teaching methods and lessons in class through self-assessment techniques, such as the NASA Task Load Index (NASA-TLX) and Workload Profile (WP).
Direct instructions
Direct instruction is a general term used for the explicit teaching of a skill-set to students through lectures or demonstrations of source material. It is a teacher-directed method, meaning that the teacher stands in front of a classroom and presents the information, in contrast to exploratory models such as inquiry-based learning. Direct instruction includes tutorials, participatory laboratory classes, discussion, recitation, seminars, workshops, observation, active learning, practice, or internships.
Multimedia learning
As in the context of information explosion, the studying and teaching are always relevant to the internet wholly or partly. A human can access or process only a finite
CHAPTER 2. LITERATURE REVIEW AND RELATED WORK
amount of information at a time, despite the huge amount of information available on the Internet. The human brain does not interpret multimedia instructions made by words, sensory information and pictures in a mutually exclusive way. As a result, the combination of direct instructions one-way to the electronic communication and extended to group activity multiple-way is the adopted way in modern times.
According to Cognitive Theory of Multimedia Learning (CTML), instructional condition is based upon three assumptions: (1) dual-channel, or the auditory and the visual channel (Wong, Castro-Alonso, C., Ayres, & Paas, 2015; Gough Young, Wodehouse, & Sheridan, 2015; Jaewon, Dongsik, & Chungsoo, 2016); (2) limited processing capacity, each channel has a finite capacity (Haji et al., 2016; Lin et al., 2017); and (3) active processing, learning is an active process including selection, filtering, organization and integration of information to prior knowledge (Macken & Ginns, 2014; Blayney et al., 2015; Agostinho et al., 2015) . The expected result is that higher learning outcomes and lower cognitive load (Yung & Paas, 2015); whatsoever the level of instructional guidance needed to match learners’ levels of expertise (Yuling, Yuan, Tzu-Chien, & Sweller, 2015; Kalyuga, Chandler, & Sweller, 1998). For such instances, the designed instructional conditions should keep intrinsic load being static (Haji, Rojas, Childs, Ribaupierre, & Dubrowski, 2015), minimizing extraneous load (Jihyun, Dongsik, & Chungsoo, 2014) and promoting germane load (Leahy, Hanham, & Sweller, 2015; Young, Van Merrienboer, Durning, & Ten Cate, 2014).
Social constructivist
Social constructivist emphasizes the importance of culture and context in understand-ing what occurs in society and in constructunderstand-ing knowledge based on this understandunderstand-ing. Social constructivist approaches can include reciprocal teaching, peer collaboration, cognitive apprenticeships, problem-based instruction, web quests, anchored instruction and other methods that involve learning with others (Kim, 2001).
On the whole, the expected outcome is that learners can transfer learned concepts to a new context. By that way, the thinking of the group as a whole at first, with the objective of processing certain information is aimed at increasing understanding
(Orru, Gobbo, O’Sullivan, & Longo, 2018). As referred to the cognitive-effective theory of learning with media, learner’s mood had an effect on germane load, extraneous load, and intrinsic motivation (Liew & Tan, 2016). These three loads when combined into computational methods, in the context of Mental Workload representation and assessment, will quantify the Mental Workload imposed on learners by social teaching activities and instructional material (Galy & Mlan, 2015; Kalyuga & Singh, 2016).
2.2
Mental Workload
In education, the main reason for assessing cognitive load or Mental Workload is to measure the mental cost of performing a learning task with the goal of predicting the learner’s performance (Jimenez-Molina, Retamal, & Lira, 2018; Byrne, Tweed, & Halligan, 2014). Cognitive Load Theory (CLT) in the context of instructional design theory is one of the important indicators to measure. It not only works on the de-sign phase but also becomes a guideline for dede-signers in making appropriate structural changes (Foo et al., 2013). The assumption in design approaches is that the more difficult the task is, the more Mental Workload increases and the performance usu-ally decreases (Xie et al., 2017). However, it is personal and complicated in different ways that are difficult to predict (Longo, 2015a). To construct the measurement in educational settings, the majority of research used Mental Workload in Ergonomics as the alternative one (Longo & Barrett, 2010), i.e., the experience of Mental Workload depends on each individual by way of different cognitive style, different education, and upbringing. There is no widely accepted definition of MWL in spite of the to-tal cognitive load needed to accomplish a specific task under a finite period (Cain, 2007). As a consequence, Mental Workload (MWL) is a fundamental design concept in Human-Computer interaction (HCI) and Ergonomics (Human Factors) and some-times is referred to as Cognitive Load, specifically in Cognitive Psychology.
There is leading research in measuring and evaluating the Mental Workload. How-ever, how it effects instructional design or performance measurement when linked with the workload measure is still unclear (Hancock, 2017).
CHAPTER 2. LITERATURE REVIEW AND RELATED WORK
2.2.1
Measurement methods
To measure MWL is as necessary in predicting human performance as in designing technologies (Longo & Leva, 2017), interfaces (Longo & Dondio, 2015), information-based procedures and instructions (Longo, 2016). There are different ways proposed for measuring MWL, but categorized into three main techniques:
Self-assessment or subjective measures
This measure is based on the analysis of the subjective feedback provided by human interacting with an underlying task or system (Moustafa, Luz, & Longo, 2017). The form is often a survey or questionnaire, mostly post-survey. The common instruments are the NASA Task Load Index (NASA, NASA-TLX) (G. Hart & E. Stavenland, 1988), the Workload Profile - Multiple resource Theories (WP) (Tsang & L. Velazquez, 1996), the Subjective Workload Assessment Technique (SWAT) (Reid & Nygren, 1988) and the simplified SWAT (Luximon & Goonetilleke, 2001).
Task performance measures
This measure refers to primary and secondary task measures and is considered as an objective performance measurement. The time to complete a task, the reaction time to secondary tasks and the number of errors on the primary task are examples of measures, are concrete ways of tracking the different actions performed by a user during a primary task. However, these human performance indicators can be assessed by subjective usability (Longo, 2017, 2018).
Physiological measures
This measure performs as the analysis of physiological indicators and responses of the human body, including EEG (electroencephalogram), eye tracking and heartbeat measurements during the time of completion of the tasks.
2.2.2
Multi-dimensional and uni-dimensional measures
Concerning subjective measures, the NASA-TLX and WP are multi-dimensional be-cause they include more than one method to assess and measure; whereas uni-dimensional measure has only one. The Rating Scale Mental Effort (RSME) is a uni-dimensional procedure that considers the exerted subject’s effort and subjective ratings. These ratings are indicated across a continuous line, within the interval 0 to 150 with ticks every ten units. Labels on ’absolutely no effort’, ’almost no effort’, ’a little effort’, ’some effort’, ’rather much effort’, ’considerable effort’, ’great effort’, ’very great ef-fort’ and ’extreme efef-fort’ are used along the line. On the one hand, the procedure is relatively simple, quick and it has shown a good degree of sensitivity. On the other hand, it has also demonstrated to have a poor diagnostic capacity (Zijlstra, 1993).
Following the research of MWL, subjects performed two laboratory tasks sepa-rately (single function) and simultaneously (dual function). The multi-dimensional procedure compared better than the uni-dimensional methods regarding sensitivity to task demands, concurrent validity with performance, and test-retest reliability. This finding strongly supports the notion that MWL is multi-dimensional in nature (Tsang & L. Velazquez, 1996).
2.2.3
Criteria for evaluating Mental Workload measures
There are different criteria for the development of MWL measurement methods and hence an array of literary terms needed to evaluate their inferential capacity (ODonnel & Eggemeier, 1986).
• Sensitivity: the measurement method should be responsive to variations in task difficulties and other factors believed to influence MWL on the task level; • Diagnosticity: the method should be diagnostic and be capable of identifying
the changes in workload variation and the causes of these changes;
• Intrusiveness: the method should not be intrusive or interfere with the primary task performance;
CHAPTER 2. LITERATURE REVIEW AND RELATED WORK
• Requirements: the method should demand minimum requirements to avoid in-fluencing the performance of the person during primary task execution;
• Acceptability: the method should achieve high acceptance from the person; • Selectivity: the method should be highly sensitive to MWL factors and not
affected by other factors that are not related to MWL;
• Bandwidth and reliability: the method should be consistent or stable;
• Validity: comprising of face validity (the method covers the construct of MWL) and concurrent validity (the degree to which measures of MWL expected to be theoretically related, are related).
A measurement technique including in all the criteria above is ideal, but it is not always the case. First things first is a good construct built for Mental Workload representation & assessment (Guastello, Marra, Correro, Michels, & Schimmel, 2017). In the study of Longo (2015a) has demonstrated how the framework outperformed state-of-the-art subjective MWL assessment techniques regarding sensitivity, diagnosticity, and validity (Longo, 2018, March). So far, the criteria for evaluating MWL assessment techniques were also in the research of (Rizzo & Longo, 2017).
2.3
Subjective rating scales
In the perspective of research, human Mental Workload is measured by subjective rating scales which are easy to administer and analyze by comparison of two other measures: performance and physiological (Xiaoru, Damin, & Huan, 2014). Subjective measures provide an index of general workload, and multi-dimensional measures can determine the source of Mental Workload. The main drawback is that they can only be administered post-task, thus influencing the reliability of long tasks. In addition, meta-cognitive limitations can diminish the accuracy of reporting and cause difficulty in performing comparisons among raters on an absolute scale. Despite that, they ap-pear to be the most appropriate types of measurement for assessing Mental Workload
because they have demonstrated high levels of sensitivity and diagnosticity (Rubio, Daz, Martn, & Puente, 2004).
To measure the Mental Workload, subjective workload techniques recently used are NASA-TLX, (Seker, 2014; Byrne et al., 2014; Longo, 2018; Foo et al., 2013; Adar & Delice, 2017; Xiaoru et al., 2014; Mitropoulos & Memarian, 2013; Weigl et al., 2014) or Workload Profile (Valdehita, Ramiro, Garca, & M. Puente, 2004; ?, ?). Both are multi-dimensional measures applied in the field of psychology or technological improvements. Furthermore, when evaluating the cognitive load, it is better to consider combined measures (Xiaoru et al., 2014; Adar & Delice, 2017). A regression equation is often applied to predict the model for Mental Workloads, such as Partial Least Square of Structural Equation Modelling (Kuo-Kuang, Chung-Ho, Shuh-Yeuan, & Wei-Jhung, 2013).
2.3.1
NASA Task Load Index
Figure 2.1: Six components of NASA Task Load Index
The NASA Task Load Index (NASA, NASA-TLX) instrument has been used far be-yond its original application (aviation), in the field of requiring concentration (crew competence), health care (Colligan, Potts, Finn, & Sinkin, 2015), language (English)
CHAPTER 2. LITERATURE REVIEW AND RELATED WORK
and other complex socio-technical domains (G Hart, 2006). The Human Performance Group developed it at NASA’s Ames Research Center over a three-year development cycle that included more than 40 laboratory simulations (G. Hart & E. Stavenland, 1988). It is a combination of six factors believed to influence MWL (figure2.1). The goal was to summarize the productivity during activities performed by the test sub-jects in different environments.
2.3.2
Workload Profile - Multiple resource theory
Figure 2.2: Workload Profile - Multiple Resource Theory
Tsang and L. Velazquez (1996) built the Workload Profile (WP) upon the Multiple Resource Theory proposed in the structure of Wickens (2008). The theory was shown to be partially relevant to the concept of Mental Workload, with the greatest relevance to decreased performance due to dual-task overload (Wickens, 2017). Its history comes from a computational version of the multiple resource model which was applied to multitask driving simulation data. The importance of four dimensions accounts for
task interference and the association of resources within the brain structure. In this theory, individuals have different capacities or resources related to:
• stage of information processing - central processing, response selection; • code of information processing - spatial processing, verbal processing; • resources - visual input, auditory input;
• response - manual response, speech response.
The most important application of the multiple resource model is to recommend design changes when conditions of multitask resource overload exist.
2.4
Summary
2.4.1
Gaps in research
The majority of models in the research predict a cognitive load score through to-tal cognitive load by multi-criteria (Jaewon et al., 2016) or combined measurement methods:
• Adar and Delice (2017) evaluated MWL using Multi-criteria HFLTS method: a new decision-making method, Hesitant Fuzzy Linguistic Term Set, and eval-uating the mental workload by employing the dimensions used in NASA-TLX. The HFLTS method, which allows qualitative and quantitative criteria is used in alternative evaluation interchangeably.
• Sewell, Boscardin, Young, Cate, and O’Sullivan (2016) measured cognitive load during procedural skills training with colonoscopy as an exemplar: the instru-ment (the Cognitive Load Inventory for Colonoscopy) using a multi-step process and cognitive load theory to develop a self-report instrument measured three types of cognitive load (intrinsic, extraneous and germane load).
CHAPTER 2. LITERATURE REVIEW AND RELATED WORK
• Naismith, Cheung, Ringsted, and Cavalcanti (2015); Ngu and Phan (2016) had evidence of correlation of intrinsic cognitive load and instructional design. Naismith et al. (2015) showed limitations of subjective cognitive load measures in simulation-based procedural training: The questionnaires appear to be in-terchangeable as measures of intrinsic cognitive load, but not of total cognitive load.
Some research indicated the effect of cognitive load theory on cognitive types in designing the learning conditions framework. Nevertheless, it is still unclear as to how it can formally shape a successful framework and which factors compose it:
• In the research of the germane load impact (Schwonke, 2015; Cheon & Grant, 2012), Cheon and Grant (2012) described the effects of the metaphorical interface on germane cognitive load in Web-based instruction. The results indicated that germane cognitive load positively affected learning performance despite there being no relationship between germane cognitive load and students’ prior knowl-edge. That being said, both germane cognitive load and prior knowledge simi-larly contributed to learning performance. Besides, Schwonke (2015) considered a metacognitive type of load in resource-oriented theories, which was expected to have the as same effect as cognitive load theory.
• Effects of cues and real objects on learning in a mobile device supported envi-ronment (Liu, Lin, & Paas, 2013): The theoretical framework of cognitive load theory with arrow-line cues would decrease extraneous cognitive load. But there is no proof of overlap between the different sources of information used and that it affects learning, i.e., the availability of real plants would increase germane cognitive load.
• Xiaoru et al. (2014) suggested improving pilot MWL evaluation with combined measures. However, the inconsistent conclusions on the sensitivities of various MWL evaluation indices probably resulted from the different experiment tasks, which were designed to induce MWLs.
There are leading research to fill the gaps above:
• On one hand, a defeasible reasoning framework (Longo, 2015a; Blayney et al., 2015) was essential. The research provided an extensible framework built upon defeasible reasoning, and implemented with argumentation theory, in which MWL can be better defined, measured, analyzed, explained and applied with different human-computer interactive contexts. On the other hand, Kalyuga and Singh (2016) studied within the frameworks of productive failure and inven-tion learning that has reportedly demonstrated as minimally guided tasks before explicit instruction might benefit novice learners.
• Blayney et al. (2015) found out more finely-grained methods of evaluation of learner prior experience, which required for optimal tailoring of instructional methods to levels of learner expertise. The benefit of rapid diagnostic tests is to monitor learners progress and alter the instructional techniques in real time. • Davids, Halperin, and Chikte (2015) applied evidence-based design principles
to manage cognitive load and optimize usability. It is essential to improve the educational impact of e-learning resources, especially relevant to multimedia resources.
There are experiment research in Mental Workload prediction in aviation (Xu, Xiaoru, & Damin, 2015) to optimize human factors and reduce human errors (Smith, 2017), in education to understand why negative sentence is more difficult to remember (Macbeth et al., 2014), in communication (Longo, 2015b) and networking technology (Colombi et al., 2012). This study aims to predict the total Mental Workload by subjective rating scales with statistically significant variables.
2.4.2
Research question
To what extent ”can a model of Mental Workload be built upon a set of features extracted from the literature of mental workload and applied in third-level education?”
Chapter 3
Design and methodology
The study will be implemented in four main parts. Firstly, the phase of data under-standing, which includes data collection, description, exploration and quality verifica-tion. Secondly, the phase of data preparation, which describes how to select, clean, construct, integrate and format data for the purpose of analysis. Thirdly, the phase of modeling, describing the chosen technique; how to generate test design, how the model is built and assessed. Fourthly, the evaluation phase, which describes the reliability and validity of the results, and suggests the next steps for development.
The schema of research is shown in figure 3.1. Each subjective rating scale or subjective measure in the training set and test set, contains a constant value and categorical value of output (MWL). The chosen model should reflect the type of output. If it were a case of Mental Workload score (as a continuous feature), it would be trained and tested through Linear Regression and Decision Tree GINI Regression; if it were a case of Mental Workload level classes (as a categorical feature), it would be trained and tested through Decision Tree Information Gain and Decision Tree GINI Classification.
Figure 3.1: Schema of research
3.1
Business understanding
The application of Human Mental Workload in third level education will allow the prediction of student performance. The benefits of which include restricting the num-bers of students at risk of failure, and allowing the design of class conditions to reduce the load on learners. In the current era of information explosion, the significant task
CHAPTER 3. DESIGN AND METHODOLOGY
of continuous knowledge gathering is crucial to higher education.
3.1.1
Extended Feature Sets
Figure 3.2: Extended Feature Sets
Human behaviour is both personal and complicated, in different ways that are difficult to predict. A working model to assess Mental Workload, comprising of task assessment (NASA) and multiple resources effects (WP) with additional education factors, is the aim of the complete subjective rating scales, which is the Extended Feature Sets (EFS). The other education factors are listed below:
• Context - distractions/ interruptions during the teaching session
• Parallelism - not engaged with teaching session or engaged in other parallel tasks • Motivation - motivated by teaching session
• Skill - have no influence or help
• Utility - teaching session useful for learning
• Arousal - sleepy tired or fully cognizant
3.1.2
Research hypothesis
This research aims to investigate the optimal model in predicting the Mental Workload score with the new subjective rating scale (EFS). The hypothesis of the research:
• Ha: A model trained with EFS lead to significantly more accurate and less error in prediction of overall Mental Workload than models trained with NASA-TLX or WP (through Decision Tree, Linear Regression).
3.2
Data understanding
3.2.1
Data collection
The dataset has been collected from delivering the Research Design & Proposal Writing module from 2015 to 2018. The training and test sets split from the data of 684 records. Two different groups of part-time and full-time students participated in the study. They attended the MSc module ’Research design and Proposal writing’ in different years. Both groups spent time on four topics in Science; The scientific method; Planning research; Literature Review in two conditions (1) multimedia slides verbally presented by lecturer on a board, (2) multimedia video projected on a white-board. At the end of each topic, students were asked to fill in questionnaires, aimed at quantifying the Mental Workload during the class.
The NASA-TLX, the WP and the EFS are multi-dimensional and thus require participants to answer some questions. RSME (Rating Scale Mental Effort) is uni-dimensional adding one further question to compare to the other scale in the same delivered questionnaire. The formation of the two subgroups, one received the NASA-TLX, one received the WP and the other proceeded EFS randomly.
CHAPTER 3. DESIGN AND METHODOLOGY
3.2.2
Data description
Table 3.1: Variable definition of 3 subjective measures Feature Description
MWL - Perception of Mental Workload, multi-dimensional measure is also the target variable in 3 subjective measures (NASA-TLX, WP and EFS). - Continuous variable, range from 0 to 100; Ordinal type with 5 groups: Extreme underload [0-10], Underload [11-25], Optimal load [26-75], Overload [76-90], Extreme overload [91-100]
Features below are continuous variables and having the range from 0 to 100 NASA Ment - Task demand features, Mental and perceptual activity required,
the teaching session easy or demanding, simple or complex. NASA Phys - Task demand features, Physical activity required,
the teaching session easy or demanding, slack or strenuous. NASA Temp - Task demand features, Time pressure due to the pace,
the space was slow or rapid.
NASA Perf - Perceived performance, how successful or satisfied felt with learner’s performance.
NASA Frus - Cognitive state, how irritated, stress, annoyed felt. NASA Effo - Cognitive state, how hard (mentally, physically)
to accomplish the performance.
WP Solv - Central Processing, attention for activities like remembering, problem-solving, decision-making and perceiving.
WP Resp - Response Processing, attention for selecting the proper response channel (manual or speech) and its execution.
WP TaSpa - Task and space, attention for spatial processing. WP Verb - Verbal material, attention for reading or processing
linguistic material or listening to verbal conversations.
WP Visu - Visual resources, attention for attending the teaching session based on the visual information.
WP Audi - Auditory resources, attention for attending the teaching session based on the auditory information.
WP Manu - Manual response, attention for manually responding to the teaching session. WP Spee - Speech response, attention for producing the speech response
(engaging in a conversation, answering questions). Features comprise of the factors in NASA and WP EFS nasa Ment - Mental demand (NASA).
EFS Para - Just attending teaching session or engaged in other parallel tasks (mobile browsing/ social networks, chatting, reading, conversation). EFS nasa Temp - Temporal demand (NASA).
EFS wp Manu - Manual response (WP). EFS wp Visu - Visual resources (WP). EFS nasa Effo - Effort (NASA).
EFS wp Solv - Central Processing (WP). EFS nasa Frus - Frustration (NASA).
EFS Cont - Interruptions during the teaching session
distractions (mobile, noise, questions, other participants,..) EFS wp TaSpa - Task & space (WP).
EFS Moti - Motivated by the teaching session. EFS wp Verb - Verbal material (WP).
EFS Skil - Skills have no influence or help. EFS wp Audi - Auditory resources (WP). EFS nasa Phys - Physical demand (NASA). EFS wp Spee - Speech response (WP).
EFS Util - The teaching session was useful for learning. EFS Know - How much experience knowledge with the session. EFS Arou - Sleepy tired or fully activated awake.
3.2.3
Data exploration
Table 3.2: Data exploration of NASA Feature set 1: NASA-TLX (N=230)
Feature type miss n min 1stQ median 3rdQ max mean sd
RSME [0-150] R 1 229 10 40 50 73 105 53.74 21.72
Features below range from 0 to 100
MWL R 1 229 10 45 55 65 85 53.65 14.84 Mental R 0 230 5 40 50 65 100 50.20 16.99 Physical R 0 230 5 15 25 50 100 31.10 20.75 Temporal R 1 229 5 30 45 55 100 45.28 17.86 Performance R 0 230 10 30 45 60 85 44.35 18.04 Frustration R 0 230 5 25 35 55 95 38.24 19.52 Effort R 0 230 5 35 50 60 100 49.13 19.24 R: Range, Q: quarter
There were 230 students enrolling in the NASA questionnaire. The mean and median of MWL (MeanM W L = 53.65, MedianM W L = 55) and RSME (Mean = 53.74, Median = 50) were not so different. Two features having the opposite trend of MWL were Physical demands and Frustration. In terms of six features having the impact on MWL, the lowest score was Physical demands (mean = 31.1) and the highest one was Mental demands (mean = 50.2).
Table 3.3: Data exploration of WP Feature set 2: Workload Profile (N=217)
Feature type miss n min 1stQ median 3rdQ max mean sd
RSME [0-150] R 1 216 0 35 50 70 100 50.36 20.95
Features below range from 0 to 100
MWL R 0 217 5 40 50 65 90 51.72 16.63 Central R 0 217 5 45 55 70 100 55.03 19.47 Response R 0 217 5 35 50 65 100 49.44 21.72 Spatial R 1 216 5 25 47.5 60 100 44.13 22.85 Verbal R 0 217 5 50 65 75 100 61.97 19.19 Visual R 0 217 10 50 65 75 100 61.47 19.09 Auditory R 1 216 5 55 65 75 100 64.16 18.88 Manual R 0 217 5 30 50 65 100 46.89 24.41 Speech R 0 217 5 25 50 65 100 46.18 24.93 R: Range, Q: quarter
The number of 230 students enrolled in the NASA questionnaire. The mean and median of MWL (MeanM W L = 53.65, MedianM W L = 55) and RSME (Mean = 53.74, Median = 50) were not so different. Two features having the opposite trend of MWL were Physical demands and Frustration. Regarding six features having an impact on MWL, the lowest score was Physical demands (mean = 31.1), and the highest one was Mental demands (mean = 50.2).
CHAPTER 3. DESIGN AND METHODOLOGY
Table 3.4: Data exploration of EFS
Feature set 3: Extended Feature Sets - EFS (N=237)
Feature type miss n min 1stQ median 3rdQ max mean sd Features below range from 0 to 100
MWL R 2 235 5 40 50 60 95 50.79 16.60 NASA Men R 0 237 5 35 50 60 90 48.46 16.50 Parallelism R 0 237 5 10 15 35 80 25.50 21.42 NASA Tem R 1 236 10 45 50 60 85 51.40 14.24 WP Manual R 0 237 5 30 50 65 100 47.74 24.25 WP Visual R 1 236 10 50 65 75 100 62.5 17.94 NASA Eff R 4 233 10 40 55 65 100 51.83 18.74 WP Central R 0 237 10 35 50 70 100 52.65 21.76 NASA Fru R 1 236 5 30 50 55 90 44.13 19.07 Context R 0 237 5 10 20 35 95 25.74 20.31 WP Spatial R 0 237 5 15 35 55 100 36.46 23.01 Motivation R 0 237 5 50 65 75 100 61.73 20.32 WP Verbal R 1 236 5 45 60 70 100 57.92 20.20 Skill R 1 236 5 35 52.5 65 100 49.96 23.32 WP Audi R 0 237 5 50 60 70 100 59.05 18.93 NASA Phy R 0 237 5 10 25 45 80 29.43 20.72 WP Speech R 0 237 5 20 40 60 100 40.61 24.06 Utility R 0 237 5 55 70 80 100 66.62 20.37 PastKnow R 1 236 5 35 55 66.25 95 52.5 20.83 Arousal R 0 237 10 45 55 70 100 57.81 19.38 NASA Per R 0 237 10 45 65 75 100 61.71 18.82 R: Range, Q: quarter
The number of 237 students enrolled in the EFS questionnaire. The mean and median of MWL were not so different (MeanM W L = 50.79, MedianM W L = 50). Four features having the opposite trend of MWL were two additional features (Parallelism, Context), one feature relevant to NASA (Physical demands) and one relevant to WP (Spatial Processing). In the total of twenty features having the impact on MWL, the lowest score was Parallelism (mean = 25.50), Context (mean = 25.74); and the highest one was Utility (mean = 66.62).
3.2.4
Data quality verification
The data set of assessing Mental Workload with three measures are NASA-Task Load Index (N=230), Workload Profile (N=217) and Extended Feature Sets (N=237). There are 0.5-2 % missing values, and the median of each variable values are imputed. Thedescriptive featuresare factors in measuring and classifying the levels of Mental Workload score. Thetarget feature is the perception of Mental Workload score.
3.3
Data preparation
3.3.1
Data selection
Data is randomly divided into approximately 70:30 for training and test sets. For each data division of the three subjective scales, the target variable is Mental Workload, but the description variables can be different in quantities and characteristics. For instance, NASA-TLX has six independent factors (mental demand, physical demand, temporal demand, performance, frustration, and effort); WP has eight factors (central, response, spatial, verbal processing, visual and auditory input, manual and speech response); EFS is the combination of 6 factors in NASA-TLX as above, 7 factors in WP as listed above without response processing variable; and 7 others (parallelism, context, motivation, skill, utility, past knowledge expertise and arousal) which has 20 factors in total.
Three measures will have the list of datasets extracted from cross-validation by ten folds and ten occurences.
3.3.2
Data cleaning
The first step is testing for normality of target feature. There are two main methods of assessing normality, graphically by histogram, and numerically by Shapiro-Wilk Test or skewness and kurtosis measure for skewed data.
If seeing Mental Workload shows as an interval, the second step would be ana-lyzing the correlation between the Mental Workload score and independent variables (descriptive features) to illustrate the factors put into the model. The Mental Work-load score is an interval scale, but non-parametric as the distribution is discrete in the lowest and highest range. When the Mental Workload score is non-parametric, we carry out two tests: Kruskal-Wallis (as for nominal descriptive feature); Spearman (as for numeric descriptive feature). The correlation will be a reasonable explanation for the essential variables in models of Multiple Linear Regression and Decision Tree Gini Regression after training. If Mental Workload shows as ordinal, the second step
CHAPTER 3. DESIGN AND METHODOLOGY
is resolving a class imbalance. In classification problems, a disparity in the frequencies of the observed classes can have a significant negative impact on model fitting. One technique is to subsample the training data in a manner that mitigates the issues. There are three types of sampling methods. Firstly, down-sampling randomly subset all the classes in the training set so that their class frequencies match the least preva-lent level. Secondly, up-sampling sample randomly (with replacement) the minority class to be the same size as the majority class. Lastly, hybrid methods are techniques such as SMOTE down-sample the majority class and synthesize new data points in the minority class. This method is used for the models of Decision Tree Information Gain and Decision Tree Gini Classification.
Lastly, the best model will be the one with less error or better accuracy after comparing the training and evaluation output.
3.4
Modelling
In the prospect of matching Machine Learning approaches to projects, the pre-requisites of a project are mostly the viable creation of an accurate prediction model. Firstly, data should be split into training and test sets (70:30) to train and validate the model. With the training set, data is trained in Decision Tree and Multiple Linear Regression. The nature of the target value is similar to the Likert scale as rating scales to capture estimations of magnitude. Data from Likert scales and continuous rating scales are quantitative (Joshi, Kale, Chandel, & Pal, 2015) which is interval data. However, it can also be ordinal scale in some point of views (Joshi et al., 2015). As in the context, the Multiple Linear Regression is applied for Mental Workload score as a continuous feature; the Decision Tree is applied to train in two methods, Information Gain (ap-plied C5.0) to deal with ordinal value and Gini index (ap(ap-plied CART) to deal with both viewpoint as interval or ordinal value. Therefore, there are four models (2 models for numeric target value and 2 models for categorical target value) on each instrument. Accordingly, twelve models will be produced to compare the accuracy, precision, and recall of actual and predicted value for categorical models; and RMSE, R-squared for
numeric models.
To achieve a representative sample to select for the optimal predictive model, requires cross-validation to take place. Cross-validation is primarily used in applied machine learning to estimate the skill of a machine learning model on unseen data. To use a limited sample for estimating how the model performs predictions on data, which is the test set not applied during the training of the model. The procedure is as follows:
1. Shuffle the dataset randomly 2. Split the dataset into k groups 3. For each unit group:
• Take the group as a hold-out or test data set • Take the remaining groups as a training data set
• Fit a model on the training set and evaluate it on the test set • Retain the evaluation score and discard the model
4. Summarize the skill of the model using the sample of model evaluation scores Any preparation of the data prior to fitting the model occurs on the cross-validation assigned training dataset within the loop rather than on the broader data set. The tuning of hyperparameters also applies to cross-validated training. A failure to perform these operations within the loop may result in data leakage and an optimistic estimate of the model skill ((Gareth, Daniela, Trevor, & Robert, 2013), pg 181). The results of running k-fold cross-validation are the mean of the model skill scores ((Stuart & Peter, 2016), pg 708).
The ”caret” package (short for Classification and Regression Training) is a set of functions that attempt to streamline the process for creating predictive models. The ’train’ function can be used to evaluate, resample, estimate the effect of model tuning parameters on performance. It is used for training models, dealing with class imbalance and testing data on the background of RStudio software. Also, ”ggplot” package is also used for visualization comparison of models.
CHAPTER 3. DESIGN AND METHODOLOGY
3.4.1
Error-based learning
Multiple Linear Regression
Multiple Linear Regression is fundamental to error-based learning. Linear Regression models determine the optimal values for the weights in the model, in fact, reducing the error of the weights. Proceeding the Multiple Linear Regression by multiplying the weights by the descriptive features. The weights of Linear Regression are the effect of each descriptive feature on the predictions returned by the model. In detail, regression is a method of modeling that a target value (named y) based on independent predic-tors (named x1, x2, x3). Hence, for estimating and discovering the cause and effect relationship between variables, one would apply regression. The regression equation can differ in the number of xi variables and the type of relationship between the xi and y.
In general, the simple linear regression equation is y = m*X + b, where “m” is the slope and “b” is the intercept. In machine learning, the equation above will be: y(x) = w0 + w1*x, where ws are the parameters of the model, x is the input, and y is the target variable. Different lines will have different values of w0 and w1. In real value, having the multiple input variables data set; and the Multiple Linear Regression Machine Learning model would be described as: y(x) = w0 + w1*x1 + w2*x2 + + wi*xi. The question must then be asked for how well do the coefficients of “w” predict the target value? This can be determined by (1) squaring the error difference between the predicted value y(x) and the target value y-true; (2) sum over all data points; (3) divide that value by the total number of data points. This value provides the average squared error over all the data points. These three steps are called cost function also known as the Mean Squared Error (MSE) function, as:
J(w) = 1 n n X i=1 (y(xi)−ytruei )2 (3.1)
The method used in ”caret” package is ’lm’. The tuning parameter for the model is the intercept.
3.4.2
Information-based learning
Machine learning algorithms build predictive models using only the most informative features. The most informative features are the descriptive features whose values split the instances of the data set into similar sets for the target feature value.
Decision Tree through Information Gain
The ideal discriminatory feature will partition the data into pure subsets where all the instances in each subset have the same classification. Information Gain of a descriptive feature is a measure of the reduction in the overall entropy of a prediction task by testing on that feature. As in, entropy is a computational measure of the impurity or heterogeneity of the elements in a set.
The method used in ”caret” package is ’C5.0’. C5.0 pruning technique adopts the Binomial Confidence Limit method. The tuning parameters are trials, models and winnow.
Decision Tree through Gini Index
Gini index shows the frequency of instance misclassification in a data set, if classifying it based on the distribution of classifications in the data set. The Decision Tree model uses the Gini Index as its splitting criteria.
The method used in ”caret” package is ’CART.’ CART can handle both nominal and numeric attributes to construct a decision tree. The tuning parameter is cp (com-plexity pruning) which removes excess branches from the decision tree for improved accuracy.
3.5
Evaluation
In the course of model evaluation, three other important issues to be considered are “prediction speed, capacity for retraining and interpretability” (D.Kelleher, Namee, & Darcy, 2015).