Visual and cognitive processing in hemispatial neglect
288
0
0
Full text
(2) UNIVERSITY OF SOUTHAMPTON FACULTY OF SOCIAL AND HUMAN SCIENCES Psychology. Visual and Cognitive Processing in Hemispatial Neglect by Louise-Ann Leyland. Thesis for the degree of doctor of philosophy March 2014. i.
(3) ii.
(4) Academic Thesis: Declaration of Authorship. I, Louise-Ann Leyland, declare that this thesis entitled Visual and Cognitive Processing in Hemispatial Neglect and the work presented in it are my own and have been generated by me as the result of my own original research.. I confirm that: 1. This work was done wholly or mainly while in candidature for a research degree at this University; 2. Where any part of this thesis has previously been submitted for a degree or any other qualification at this University or any other institution, this has been clearly stated; 3. Where I have consulted the published work of others, this is always clearly attributed; 4. Where I have quoted from the work of others, the source is always given. With the exception of such quotations, this thesis is entirely my own work; 5. I have acknowledged all main sources of help; 6. Where the thesis is based on work done by myself or jointly with others, I have made clear exactly what was done by others and what I have contributed myself; 7. None of this work has been published before submission.. Signed: ………………………………………………………………………………………. Date: ………………………………………………………………………………………. iii.
(5) iv.
(6) This thesis is dedicated to my parents, Patricia June Leyland and the late Bryan Edward Leyland. v.
(7) vi.
(8) UNIVERSITY OF SOUTHAMPTON ABSTRACT FACULTY OF SOCIAL AND HUMAN SCIENCES Psychology Doctor of Philosophy Visual and Cognitive Processing in Hemispatial Neglect Louise-Ann Leyland A number of theoretical issues can be investigated by examining patterns of eye movements in hemispatial neglect. For example, how the brain codes spatial information, how oculomotor behaviour relates to perception and awareness and what affects the allocation of spatial attention. These interesting questions will be outlined and discussed in a literature review presented in Chapter 1. Experiment 1 involved collection of behavioural and eye movement data obtained from a chronic neglect patient (SS), stroke controls and older adult controls during completion of the three cancellation tasks from the Behavioural Inattention Test (Wilson, Cockburn, & Halligan, 1987). This revealed underlying deficits that were contributing to neglect. Not only was SS’s visual sampling of the neglected information limited, she also exhibited deficient and delayed processing of contralesional information when it was sampled. Experiments 2 and 3, through newly developed cancellation tasks, examined whether different frames of reference for the coding of spatial information operate in neglect. The findings indicated that an allocentric (object-based) reference frame was not exhibited by patients with neglect when searching for specific targets letters, or clocks displaying specific times. Importantly, an egocentric reference frame based upon the position of gaze was able to account for the neglect behaviour exhibited. This suggests that many findings interpreted as evidence for allocentric neglect may be explained by the left side of the object falling to the left of the point of fixation, and therefore results from egocentric neglect. Experiment 4 determined that the reference frame operating in neglect could be affected by task demands. As a processing deficit for contralesional information was shown in all the previous experiments reported in this thesis, Experiment 4 also aimed to investigate the stages of visual and cognitive processing that may be disrupted in neglect for contralesional information. The final chapter summarises the main findings and discussion of the main theoretical questions that have been outlined is presented. Conclusions are drawn with regards to these issues, which have previously been considered elusive functions of the brain (Buxbaum, 2006).. vii.
(9) viii.
(10) Acknowledgements Without the help of the following people this thesis would not be what it is now. First and foremost I would like to thank my supervisors, Professor Simon P. Liversedge and Dr. Valerie Benson, for their constant support, knowledge and understanding throughout my postgraduate research. Even though I chose to conduct a clinical project from the outset, they have supported my decision wholly and offered valued advice and encouragement throughout. I would also like to extend my eternal gratitude to Dr. Hayward Godwin for programming scripts in R in order for meaningful measures to be obtained from handscored eye movement data; Dr. Katie Meadmore for spending many hours hand-scoring eye movements data and for enabling me to be involved in a ground-breaking project on rehabilitation after stroke; Joice Dickel Segabinazi for also spending many hours handscoring eye movement data to provide inter-rater reliability. Dr. Katie Gray has been vital in the progression of my thesis, reading through all my chapters and providing unbelievably good advice when I needed it the most. Gratitude also goes to Paul Reynolds for being my saviour when equipment malfunctioned or needed servicing. I greatly appreciate my Mother, Patricia Leyland’s, help in proof-reading my work and providing treasured emotional support in the early stages of my Ph.D., before she suffered a stroke in September 2011. Thomas Lloyd has been there for me throughout, experiencing the good and bad times with me. I cannot articulate the amount of respect I have for you being able to provide insight into my work and challenges. Also, thank you, Sarah Lloyd, for proof reading my chapters. Thanks to everyone that I have shared 3109 with for being my colleagues and friends. I’m sorry I deserted you to become a recluse during the last few months of my write up! Last but not least, I extremely appreciate all the participants and stroke patients that took the time to complete my experiments and were interested in being a part of this research. This project would not have been possible without your involvement.. This research was funded by the Biotechnology and Biological Sciences Research Council (BBSRC) and the Psychology Academic Unit, University of Southampton.. Funding for patient recruitment support was provided by the Stroke Research Network (SRN) and the National Institute for Health Research (NIHR) Clinical Research Network. ix.
(11) x.
(12) Contents Chapter 1. Literature Review of Visual and Cognitive Processing in Hemispatial Neglect ........................................................................................ 1 1.. Hemispatial Neglect: Characterisation, Incidence and Effect ..................................................... 1 1.2 The Behavioural Inattention Test ..........................................................................................4 1.3 Hemispatial Neglect and Hemianopia.................................................................................11. 2.. Spatial Frames of Reference in Neglect .................................................................................... 13 2.1 Frames of Reference for the Coding of Spatial Information ...............................................14 2.2 The Value of Figure Copying Tasks in Revealing Frames of Reference Operating in Neglect ......................................................................................................................................23. 3.. Mechanisms Underlying Neglect: The Value of Eye Movement Analyses.............................. 26 3.1 Eye Movements in Hemispatial Neglect .............................................................................27. 4.. Theories of Hemispatial Neglect............................................................................................... 33 4.1 The Neuroanatomy of Neglect ...........................................................................................34 4.2 Spatial accounts of neglect ..................................................................................................35 4.3 Non-spatial models of neglect.............................................................................................37 4.4 Rehabilitation of neglect .....................................................................................................39. 5.. Summary of Hemispatial Neglect, Frames of Reference Operating and Pattern of Eye. Movements Exhibited ....................................................................................................................... 40 6.. Outline of Thesis ....................................................................................................................... 41. Chapter 2. Patterns of Eye Movements in Hemispatial Neglect during Completion of the Behavioural Inattention Test Cancellation Tasks. ..... 45 1.1 Sampling and Processing Deficits in Hemispatial Neglect .................................................46 1.2 Sensitivity of the Letter, Star and Line Cancellation Tasks included in the BIT ................47 1.3 Hypo-attention to the Left and Hyper-attention to the Right in Hemispatial Neglect ........48 1.4 Limb Stimulation in the Treatment of Hemispatial Neglect ...............................................49 1.5 The Present Study and Hypotheses .....................................................................................52 2. Method .......................................................................................................................................... 56 2.1 Participants ..........................................................................................................................56 2.2 Stimuli .................................................................................................................................57 2.3 Apparatus ............................................................................................................................57 2.4 Design .................................................................................................................................58 2.5 Procedure ............................................................................................................................59. xi.
(13) 2.6 Data Analysis ...................................................................................................................... 60 3. Results and Discussion ................................................................................................................. 64 3.1 Eye Movement Measures ................................................................................................... 64 3.2 Statistical Analyses ............................................................................................................. 65 3.3 Letter Cancellation Task Results ........................................................................................ 65 3.4 Star Cancellation Task Results ........................................................................................... 73 3.5 Line Cancellation Task Results .......................................................................................... 77 4. General Discussion ....................................................................................................................... 81 4.1 Summary ............................................................................................................................. 81 4.2 The Mechanisms Underlying Neglect: Sampling Deficit and Processing Deficits for Contralesional Information ....................................................................................................... 82 4.3 The Effect of Task Demands on Eye Movements and Hemispatial Neglect ...................... 84 4.4 Hyper-attention to the Right? ............................................................................................. 86 4.5 Did Limb Stimulation Treatment affect the Pattern of Eye Movements and Extent of Neglect Exhibited in SS? .......................................................................................................... 87. Chapter 3. Eye Movements in Hemispatial Neglect: Simultaneously investigating Egocentric and Allocentric Neglect....................................... 91 1. The Present Study ......................................................................................................................... 91 2. Method .......................................................................................................................................... 95 2.1 Participants ......................................................................................................................... 95 2.2 Stimuli ................................................................................................................................ 97 2.3 Screening Tests ................................................................................................................... 98 2.4 Apparatus .......................................................................................................................... 105 2.5 Design ............................................................................................................................... 105 2.6 Procedure .......................................................................................................................... 105 2.7 Data Analysis .................................................................................................................... 106 3. Results and Discussion ............................................................................................................... 106 3.1 Eye Movement Measures ................................................................................................. 107 3.2 Target Identification Accuracy (TIA) in the SEAN Task ................................................. 107 3.3 Scanning Patterns ............................................................................................................. 110 3.4 Number of Gazes made on each Region........................................................................... 111 3.5 Proportion of Total Trial Time spent fixating each Region .............................................. 113 3.6 Average Gaze Duration (AGD) on each Region .............................................................. 114 4. General Discussion ..................................................................................................................... 117. xii.
(14) 4.1 Why was there no Evidence of Allocentric Neglect Observed in this Experiment? .........117 4.2 Did a Sampling or Processing Deficit of Contralesional Space Occur? ...........................120 4.3 Is Hyper-attention to the Ipsilesional Space Occurring in Neglect? .................................122 4.4 Conclusions .......................................................................................................................122. Chapter 4. Eye Movements in Neglect during Completion of Clock Cancellation Tasks: Distinguishing between Allocentric and FixationBased Neglect ............................................................................................... 125 1. The Present Study ....................................................................................................................... 129 2. Method ........................................................................................................................................ 131 2.1 Participants ........................................................................................................................131 2.2 Stimuli ...............................................................................................................................132 2.3 Screening Tests .................................................................................................................134 2.4 Apparatus ..........................................................................................................................135 2.5 Design ...............................................................................................................................135 2.6 Procedure ..........................................................................................................................135 2.7 Data Analysis and Eye Movement Measures....................................................................135 3. Results and Discussion ............................................................................................................... 136 3.1 Was Allocentric or Fixation-based Neglect Operating? The Effect of Identifying Left compared to Right Sided Targets on TIA. ..............................................................................136 3.2 Did Neglect Patients Demonstrate Egocentric Neglect? ...................................................142 3.3 Number of Gazes made on each Region ...........................................................................144 3.4 Proportion of Total Trial Time spent Fixating each Region .............................................147 3.5 Average Gaze Duration on Regions of the Left and Right Clock Tasks ..........................150 4. General Discussion ..................................................................................................................... 153 4.1 Summary ...........................................................................................................................153 4.2 Was Allocentric Neglect or Fixation-Based Neglect Operating? .....................................154 4.3 To what Extent were Sampling and Processing Deficits Contributing to the Egocentric Neglect Present in the Clock Cancellation Tasks? ..................................................................156 4.4 Comparing the SEAN and Clock Cancellation Tasks: Which Factors Affected the Neglect Exhibited and Pattern of Eye Movements Produced? .............................................................158 4.5 Conclusions .......................................................................................................................160. Chapter 5. Eye Movements in Hemispatial Neglect during Figure Tracing and Copying: Attempting to Complete the Picture. ................. 163 1.1. Do Task Demands Effect Frames of Reference Operating in Neglect? ......................164. xiii.
(15) 1.2 Does a Processing Deficit for Contralesional Information in Neglect result from Difficulty in Visually Encoding Information or Defective Representation of Encoded Information? ... 167 1.3 Present Study .................................................................................................................... 170 2. Method ........................................................................................................................................ 172 2.1 Participants ....................................................................................................................... 172 2.2 Stimuli .............................................................................................................................. 173 2.3 Screening Tests ................................................................................................................. 178 2.4 Apparatus .......................................................................................................................... 179 2.5 Design ............................................................................................................................... 179 2.6 Procedure .......................................................................................................................... 179 3. Results and Discussion ............................................................................................................... 180 3.1 Data Analysis and Eye Movement Measures ................................................................... 180 3.2 Figure Completion Accuracy ............................................................................................ 181 3.3 Proportion of Time Fixating the Four Regions of the Stimuli .......................................... 184 3.4 Number of Gazes Made on the Regions ........................................................................... 188 3.5 Proportion of Time spent Fixating Regions on the Stimulus at Different Stages during the Trial ........................................................................................................................................ 191 3.6 Average Gaze Duration .................................................................................................... 193 4. General Discussion ..................................................................................................................... 195 4.1 Do Task Demands affect the Operation of Different Frames of Reference in Neglect? .. 196 4.2 Conclusions ...................................................................................................................... 200. Chapter 6. General Discussion ................................................................... 201 1. Summary of Experimental Chapters ........................................................................................... 201 2. Mechanisms Underlying Hemispatial Neglect: The Value of Eye Movement Analyses ........... 208 3. The Allocation of Spatial Attention ............................................................................................ 212 4. Frames of Reference Operating in Neglect ................................................................................ 215 5. Conclusions ................................................................................................................................ 218. References .................................................................................................... 221 Footnotes ...................................................................................................... 235 Appendices ................................................................................................... 237 Appendix A .................................................................................................................................... 237 Appendix B ..................................................................................................................................... 238. xiv.
(16) Appendix C ..................................................................................................................................... 239 Appendix D ..................................................................................................................................... 241 Appendix E ..................................................................................................................................... 243 Appendix F...................................................................................................................................... 246 Appendix G ..................................................................................................................................... 248 Appendix H ..................................................................................................................................... 249 Appendix I ...................................................................................................................................... 253 Appendix J ...................................................................................................................................... 254 Appendix K ..................................................................................................................................... 256 Appendix L ..................................................................................................................................... 259. xv.
(17) List of Tables Table 1 ................................................................................................................................. 69 Table 2 ................................................................................................................................. 74 Table 3 ................................................................................................................................. 79 Table 4 ............................................................................................................................... 101 Table 5 ............................................................................................................................... 103 Table 6 ............................................................................................................................... 138 Table 7 ............................................................................................................................... 139 Table 8 ............................................................................................................................... 175 Table 9 ............................................................................................................................... 177 Table 10 ............................................................................................................................. 241 Table 11 ............................................................................................................................. 242 Table 12 ............................................................................................................................. 242 Table 13 ............................................................................................................................. 242 Table 14 ............................................................................................................................. 243 Table 15 ............................................................................................................................. 243 Table 16 ............................................................................................................................. 243 Table 17 ............................................................................................................................. 244 Table 18 ............................................................................................................................. 244 Table 19 ............................................................................................................................. 244 Table 20 ............................................................................................................................. 244 Table 21 ............................................................................................................................. 245 Table 22 ............................................................................................................................. 251 Table 23 ............................................................................................................................. 251 Table 24 ............................................................................................................................. 251 Table 25 ............................................................................................................................. 252. xvi.
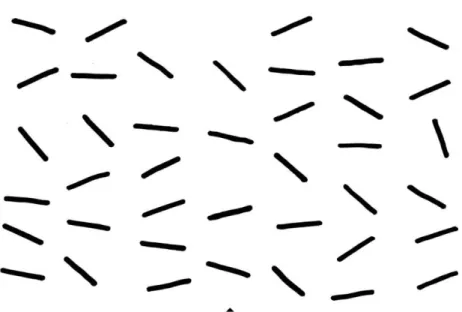
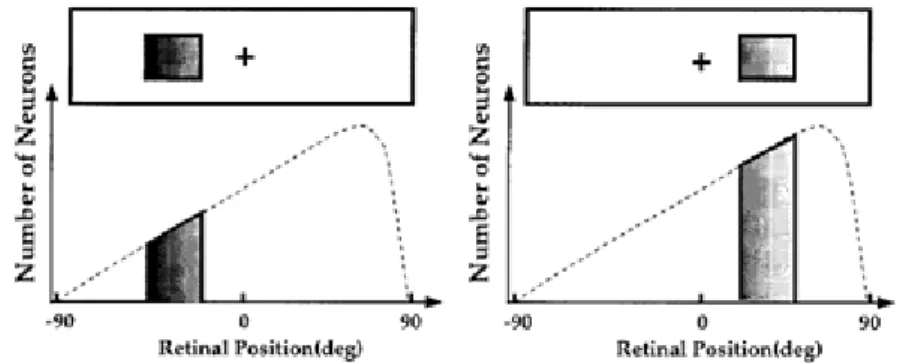
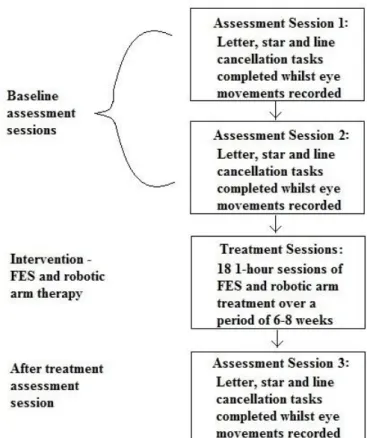
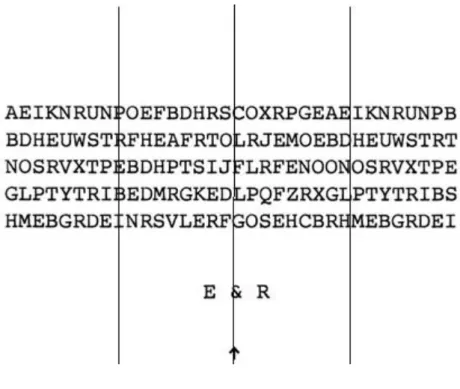
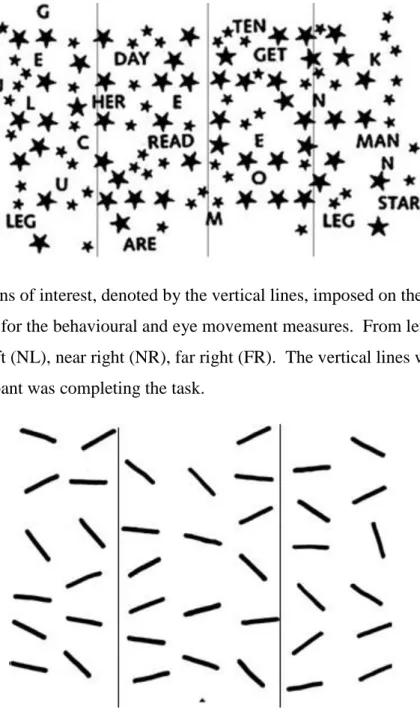
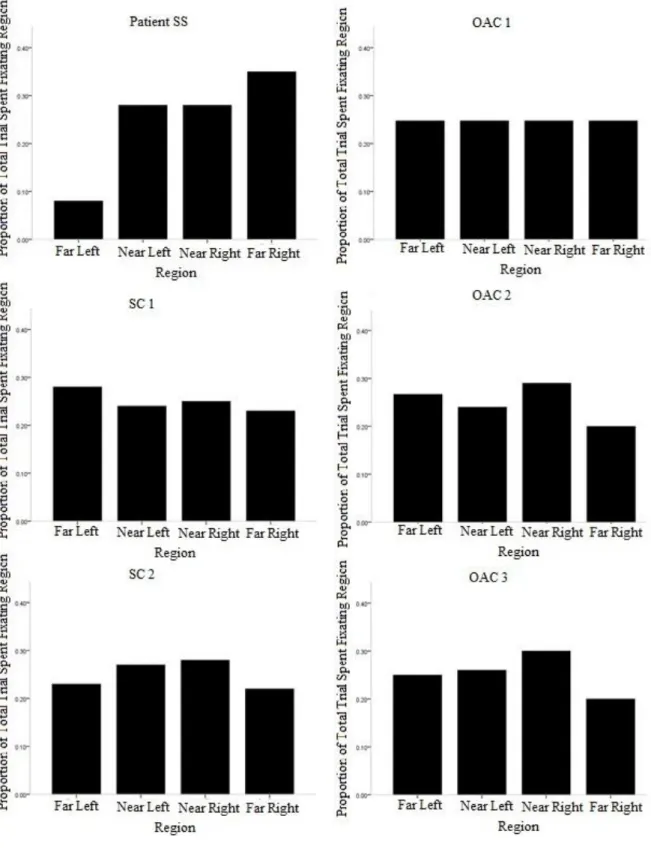
(18) List of Figures Figure 1. The line cancellation task from the Behavioural Inattention Test. This, along with the letter and star cancellation tasks, was employed in Experiment 1 reported in Chapter 2. The participants were instructed to use a pen to ‘cancel’ all the lines that they could see on the page. ............................................................................................................4 Figure 2. The letter cancellation task from the Behavioural Inattention Test. The participants were instructed to cross through the letters ‘E’ and ‘R’ in the stimulus. ...........5 Figure 3. The star cancellation task from the Behavioural Inattention Test. Patients are instructed to mark all the small stars on the page with a pen after the experimenter demonstrates the difference between the large and small stars in the task and crosses through two of the central small stars. ...................................................................................6 Figure 4. An analogue clock presented upright and inverted. The operation of allocentric and egocentric reference frames would result in differential neglect of these clocks. Allocentric (object-centred) neglect would result in the numbers 7-11 being neglected, regardless of orientation or position of the clock relative to the viewer. However, with egocentric neglect, the numbers 7-11 would be neglected when the clock is upright and presented centrally to the viewer, but numbers 1-5 would be neglected when the clock was inverted.................................................................................................................................15 Figure 5. An image of a cow, either upright or rotated by 90o, surrounded by four sections presented in different colours. These were the stimuli employed in the study conducted by Behrmann and Moscovitch (1994). ......................................................................................16 Figure 6. A graphical depiction of relative egocentric neglect. The grey boxes above the graphs represent an object being positioned at that point in the visual field, with 0 aligning with the midline of the patients’ egocentric reference frame. The left side of an object receives a reduction in the neural response compared to the right side of the object, regardless of the objects’ position in relation to an absolute egocentric midline. Adapted from Driver and Pouget (2000). ...........................................................................................20 Figure 7. Classic ‘Ogden scene’ used by Hillis et al. (1998). .............................................24 Figure 8. Consort diagram demonstrating the design of Experiment 1, including all assessment and treatment sessions. ......................................................................................59 Figure 9. Regions of interest, denoted by the vertical lines, imposed on the letter cancellation task for the behavioural and eye movement measures. From left to right: far left (FL), near left (NL), near right (NR), far right (FR). The vertical lines were not present when the participant was completing the task. The arrow at the bottom of the stimulus was aligned with the sagittal midplain of the participants’ trunk................................................62 Figure 10. Regions of interest, denoted by the vertical lines, imposed on the star cancellation task for the behavioural and eye movement measures. From left to right: far left (FL), near left (NL), near right (NR), far right (FR). The vertical lines were not present when the participant was completing the task......................................................................63. xvii.
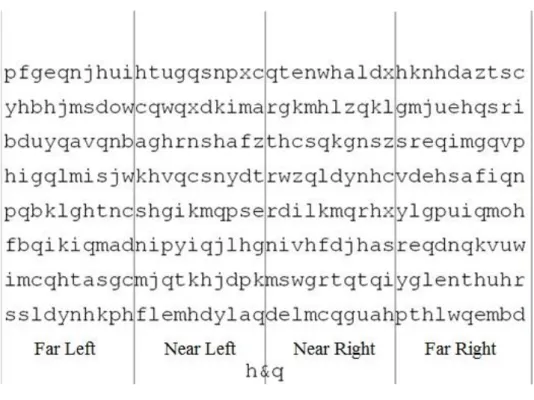
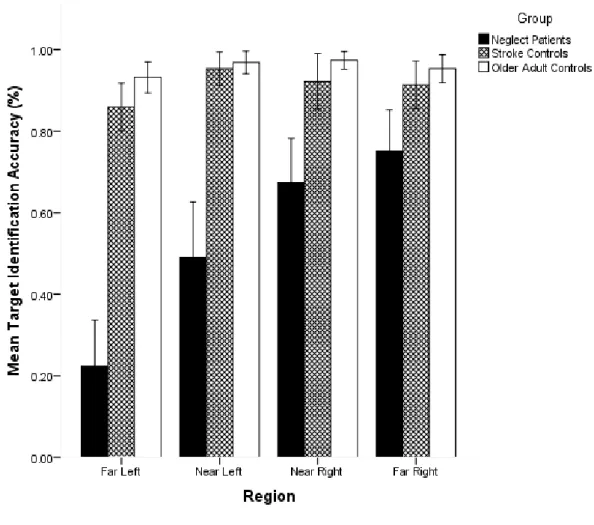
(19) List of Figures Figure 11. Regions of interest, denoted by vertical lines, imposed on the line cancellation task for the behavioural and eye movement analyses. From left to right: left, centre, right. The arrow at the bottom of the stimulus was aligned with the sagittal midplain of the participants’ trunk. The vertical lines were not present when the participant was completing the task. ............................................................................................................. 63 Figure 12. The proportion of the total trial time spent fixating each region (Far Left, Near Left, Near Right, Far Right) of the letter cancellation task in Session 1, for SS, Stroke Controls (SCs) and Older Adult Controls (OACs). Whereas control participants spent a similar proportion of time fixating each region, SS spent less time fixating regions further to the left of the stimulus. .................................................................................................... 70 Figure 13. The target letters included in the SEAN task are presented on the far left. The faded sections demonstrate the parts of the letters that may be neglected if a patient presented with left allocentric neglect. Patients with left allocentric neglect would find it more difficult to distinguish between the left sided target ‘h’ and its distractors than the right sided target letter ‘q’ and its distractors. The ‘n’ and ‘m’ were highly similar distractors for the left sided target and ‘g’ and ‘d’ for the right sided target. ...................... 94 Figure 14. The SEAN task developed for and employed as the task in this experiment, with the four regions of interest indicated by the vertical lines (Far Left; Near Left; Near Right; Far Right). These lines were not presented on the stimulus. The participant was required to search for and cross through all of the ‘h’s and ‘q’s they could find and place the pen down when they had completed the task. ...................................................................................... 98 Figure 15. Target Identification Accuracy (TIA; %) on the SEAN task for Neglect Patients (NPs), Stroke Controls (SCs) and Older Adult Controls (OACs) for each region on the stimulus (Far Left; Near Left; Near Right; Far Right). Error bars represent 95% confidence intervals around the mean. .............................................................................. 109 Figure 16. Mean number of gazes made on the four regions of the stimulus (Far Left, Near Left, Near Right, Far Right) of the SEAN task for Neglect Patients (NPs), Stroke Controls (SCs) and Older Adult Controls (OACs). Error bars represent 95% confidence intervals around the mean. ................................................................................................................ 112 Figure 17. Proportion of total trial time spent fixating the four regions (Far Left; Near Left; Near Right; Far Right) on the SEAN task for the Neglect Patients, Stroke Controls, and Older Adult Controls. Error bars represent 95% confidence intervals around the mean. 114 Figure 18. Average Gaze Durations (AGD; ms) made on the regions (Far Left; Near Left; Near Right; Far Right) of the SEAN task for Neglect Patients (NPs), Stroke Controls (SCs) and Older Adult Controls (OACs). Error bars represent 95% confidence intervals around the mean. ............................................................................................................................ 116 Figure 19. A clock presented upright or inverted. The operation of allocentric and egocentric reference frames would result in differential neglect of these clocks. Allocentric neglect would result in the numbers 7-11 being neglected, regardless of orientation. However, with egocentric neglect, the numbers 7-11 would be neglected when the clock was upright, but numbers 1-5 would be neglected when the clock was inverted. ........................................................................................................................................... 129 xviii.
(20) Figure 20. The highly similar distractors that were included (c, d, g, h) displayed the same position and angle of the hands to the targets in the Left Clock Task (LCT; a and b) and Right Clock Task (RCT; e and f) when they were presented in the opposite orientation. If fixation-based neglect was operating, with information that fell to the left of a central fixation position being neglected, then upright left sided targets (a) and inverted right sided targets (f) would be neglected. Left sided targets that were inverted (b) and upright right sided targets (e) would be able to be identified accurately, as information would have been projected to the RVF and therefore to the right of an egocentric midpoint. If Neglect Patients (NPs) presented with allocentric neglect, and this was not caused by fixationbased neglect, then the canonical left of the clock would always be neglected regardless of the clock’s orientation. This would result in both targets in the LCT being identified less often than those in the RCT. Therefore, NPs would have lower Target Identification Accuracy (TIA) on the LCT than the RCT. .......................................................................130 Figure 21. The Left Clock Task (LCT) stimulus. Participants were instructed to search for and cross through all the clocks displaying ‘five-to-nine’. Target items were presented both upright and inverted and distractor items had identical distances between the clock hands and similar positioning of the hands depicting the time in order to ensure participants could not use hand position to select and identify targets. The regions of interest employed for the analyses are denoted by the vertical lines presented in the figure (Far Left; Near Left; Near Right; Far Right). These lines were not present in the stimulus. The arrow at the bottom of the stimulus was aligned with the centre of the participants’ trunk to ensure that the regions on the left of the stimulus fell on the left of an egocentric reference frame. ............................................................................................................................................133 Figure 22. The Right Clock Task (RCT) stimulus. Participants were instructed to search for and cross through all the clocks displaying ‘five-past-three’. The regions of interest employed for the analyses are denoted by the vertical lines presented in the figure (Far Left; Near Left; Near Right; Far Right). These lines were not present in the stimulus. Target items were presented both upright and inverted and distractor items had identical distances between the clock hands and similar positioning of the hands depicting the time in order to ensure participants could not use this information to select and identify targets...............134 Figure 23. Target Identification Accuracy (TIA; %) for Left and Right Sided Targets presented Upright and Inverted in the Clock Cancellation Tasks for the Neglect Patients (NPs). Error bars represent 95% confidence intervals around the mean. .........................140 Figure 24. Target Identification Accuracy (TIA; %) for Left and Right Sided Targets presented Upright and Inverted in the Clock Cancellation Tasks for the Stroke Controls (SCs). Error bars represent 95% confidence intervals around the mean...........................141 Figure 25. Target Identification Accuracy (TIA; %) for Left and Right Sided Targets presented Upright and Inverted in the Clock Cancellation Tasks for the Older Adult Controls (OACs). Error bars represent 95% confidence intervals around the mean. .......141 Figure 26. Target Identification Accuracy (TIA; %) on Different Regions of the Left Clock Task (Far Left; Near Left; Near Right; Far Right) for Neglect Patients (NPs), Stroke. xix.
(21) List of Figures Controls (SCs) and Older Adult Controls (OACs). Error bars represent 95% confidence intervals around the mean. ................................................................................................. 143 Figure 27. Target Identification Accuracy (TIA; %) for Different Regions on the Right Clock Task (Far Left; Near Left; Near Right; Far Right) for Neglect Patients (NPs), Stroke Controls (SCs) and Older Adult Controls (OACs). Error bars represent 95% confidence intervals around the mean. ................................................................................................. 144 Figure 28. Number of gazes made on the different regions of the Left Clock Task (LCT; Far Left, Near Left, Near Right, Far Right) for Neglect Patients (NPs), Stroke Controls (SCs) and Older Adult Controls (OACs). Error bars represent 95% confidence intervals. ........................................................................................................................................... 145 Figure 29. Number of gazes made on different regions of the Right Clock Task (RCT; Far Left, Near Left, Near Right, Far Right) for Neglect Patients (NPs), Stroke Controls (SCs) and Older Adult Controls (OACs). Error bars represent 95% confidence intervals. ....... 146 Figure 30. Proportion of the total trial time spent fixating the regions of the Left Clock Task (LCT; Far Left, Near Left, Near Right, Far Right) for Neglect Patients (NPs), Stroke Controls (SCs) and Older Adult Controls (OACs). Error bars represent 95% confidence intervals around the mean. ................................................................................................. 149 Figure 31. Proportion of total trial time spent fixating the four regions of interest on the Right Clock Task (RCT; Far Left, Near Left, Near Right, Far Right) for Neglect Patients (NPs), Stroke Controls (SCs) and Older Adult Controls (OACs). Error bars represent 95% confidence intervals around the mean. .............................................................................. 150 Figure 32. Average Gaze Durations (AGD; ms) made on the Left Clock Task (LCT) for each region on the stimulus (Far Left; Near Left; Near Right; Far Right). Error bars represent 95% confidence intervals around the mean. ...................................................... 151 Figure 33. Average Gaze Durations (AGD; ms) made on the different regions of the Right Clock Task (RCT; Far Left, Near Left, Near Right, Far Right). Error bars represent 95% confidence intervals around the mean. .............................................................................. 151 Figure 34. Average Gaze Durations (AGD; ms) made on the Left Clock Task for Neglect Patients (NPs), Stroke Controls (SCs) and Older Adult Controls (OACs). Error bars represent 95% confidence intervals around the mean. ...................................................... 152 Figure 35. Average Gaze Duration (AGD; ms) made on the Right Clock Task for Neglect Patients (NPs), Stroke Controls (SCs) and Older Adult Controls (OACs). Error bars represent 95% confidence intervals around the mean. ...................................................... 153 Figure 36. Figures used in the tracing and Copying Conditions of the Experiment 4. The participants either traced or copied (1) and (4) or (2) and (3). .......................................... 178 Figure 37. Regions of interest on one of the stimuli used in the Tracing and Copying Conditions of Experiment 4. The stimulus was divided into four equal quadrants that provided four regions of interest along the horizontal plane (Far Left, Near Left, Near Right and Far Right) for the behavioural (figure completion accuracy) and eye movement measures. ........................................................................................................................... 179. xx.
(22) Figure 38. The regions that were used in the computation of figure completion accuracy for each of the four stimuli are denoted by the different coloured boxes. .........................181 Figure 39. Figure completion accuracy for the Tracing Condition of Experiment 4. Displayed is the proportion of the figure in each region of the stimulus (Far Left; Near Left; Near Right; Far Right) that was completed accurately for Neglect Patients (NPs), Stroke Controls (SCs) and Older Adult Controls (OACs). ...........................................................183 Figure 40. Figure completion accuracy during the Copying Condition of Experiment 4. Displayed is the proportion of the figure in each region of the stimulus (Far Left; Near Left; Near Right; Far Right) that was completed accurately for Neglect Patients (NPs), Stroke Controls (SCs) and Older Adult Controls (OACs). ...........................................................184 Figure 41. Proportion of total trial time spent fixating the four regions of the stimulus (Far Left, Near Left, Near Right and Far Right) during the Tracing Condition for the Neglect Patients (NPs). ....................................................................................................................186 Figure 42. Proportion of total trial time spent fixating the four regions of the stimulus (Far Left, Near Left, Near Right and Far Right) during the Copying Condition for the Neglect Patients (NPs). ....................................................................................................................187 Figure 43. The average number of gazes made on the four regions of the stimulus (Far Left, Near Left, Near Right, Far Right) during the Tracing Condition for Neglect Patients, Stroke Controls and Older Adult Controls. ........................................................................190 Figure 44. The average number of gazes made on the four regions of the stimulus (Far Left, Near Left, Near Right, Far Right) during the Copying Condition for Neglect Patients, Stroke Controls and Older Adult Controls. ........................................................................190 Figure 45. The proportion of time spent fixating each region of the stimulus (Far Left; Near Left; Near Right, Far Right) during different stages of the Copying Condition trial (the first 25% of the trial; 25% to 50% of the trial; 50% to 75% of the trial and 75% to 100% of the trial) for the Neglect Patients. ..................................................................................191 Figure 46. The proportion of time spent fixating each region of the stimulus (Far Left; Near Left; Near Right, Far Right) during different stages of the Copying Condition trial (the first 25% of the trial; 25% to 50% of the trial; 50% to 75% of the trial and 75% to 100% of the trial) for the Neglect Patients. ..................................................................................192 Figure 47. Average Gaze Durations (AGD; ms) made by the three participant groups (Neglect Patients, Stroke Controls and Older Adult Controls) on the four regions of the stimulus (Far Left, Near Left, Near Right, Far Right) during the Tracing and Copying Conditions. .........................................................................................................................194 Figure 48. The proportion of time spent fixating each region of the stimulus (Far Left; Near Left; Near Right, Far Right) during different stages of the Tracing Condition trial (the first 25% of the trial; 25% to 50% of the trial; 50% to 75% of the trial and 75% to 100% of the trial) for the Older Adult Controls................................................................................249 Figure 49. The proportion of time spent fixating each region of the stimulus (Far Left; Near Left; Near Right, Far Right) during different stages of the Copying Condition trial. xxi.
(23) List of Figures (the first 25% of the trial; 25% to 50% of the trial; 50% to 75% of the trial and 75% to 100% of the trial) for the Older Adult Controls. .......................................................................... 249 Figure 50. The proportion of time spent fixating each region of the stimulus (Far Left; Near Left; Near Right, Far Right) during different stages of the Tracing Condition trial (the first 25% of the trial; 25% to 50% of the trial; 50% to 75% of the trial and 75% to 100% of the trial) for the Stroke Controls. ....................................................................................... 250 Figure 51. The proportion of time spent fixating each region of the stimulus (Far Left; Near Left; Near Right, Far Right) during different stages of the Copying Condition trial (the first 25% of the trial; 25% to 50% of the trial; 50% to 75% of the trial and 75% to 100% of the trial) for the Stroke Controls.................................................................................... 251 Figure 52. Average Gaze Duration (AGD; ms) made during the Tracing Condition and Copying Condition for the four regions of interest on the stimulus (Far Left, Near Left, Near Right, Far Right). ...................................................................................................... 252. xxii.
(24) Abbreviations AGD Average Gaze Duration BIT. Behavioural Inattention Test. CT. Computed Tomography. ERP. Event Related Potential. FES. Functional Electrical Stimulation. FL. Far Left. fMRI functional Magnetic Resonance Imaging FR. Far Right. ICA. Internal Carotid Artery. LED. Light-Emitting Diode. LH. Left Hemianopia. LVF. Left Visual Field. RVF. Right Visual Field. MCA Middle Cerebral Artery NL. Near Left. NP. Neglect Patient. NR. Near Right. OAC Older Adult Control R. Right. SC. Stroke Control. SEAN Simultaneously investigating Egocentric and Allocentric Neglect SS. Neglect patient included in Experiment 1. PACs Partial Anterior Circulation infarct PET. Positron Emission Tomography. TACs Total Anterior Circulation infarct TIA. Target Identification Accuracy. xxiii.
(25)
(26) 1.
(27) 0.
(28) Literature Review. Chapter 1. Literature Review of Visual and Cognitive Processing in Hemispatial Neglect In this literature review, firstly hemispatial neglect will be defined and characterised. The tests used to diagnose and determine the severity of this disorder will be described and evaluated in terms of their sensitivity in identifying the presence of neglect. It is important to note that this disorder is distinguished from another, hemianopia, by a fundamental difference with regard to the visual and attentional mechanisms underlying the disorders (Walker, Findlay, Young, & Welch, 1991). Frames of reference that may operate in neglect are outlined and evidence is presented for and against the existence of two main types of neglect: egocentric and allocentric. This leads to a discussion of the underlying mechanisms that may be deficient in neglect and introduces the value of eye movement recording and analyses for enhanced understanding of factors contributing to neglect of information and spatial processing. Factors that affect both eye movements and the frames of reference operating in neglect will also be considered. Finally, the chapters presented in this thesis will be outlined and the theoretical questions that the experiments address will be specified. 1. Hemispatial Neglect: Characterisation, Incidence and Effect Strokes are, unfortunately, frequent and devastating, with around 150,000 people a year in the UK suffering from a stroke resulting in brain damage (The Stroke Association, 2011). Lesions can result from ischemia (lack of blood to an area) or haemorrhage (ruptured blood vessels leading to a bleed inside the brain). Most stroke survivors experience severe cognitive and physical disabilities resulting from brain damage which can persist for the remainder of their lives (The Stroke Association, 2011). Stroke is the most common cause of chronic physical disability in adults (Feigin, Barker-Collo, McNaughton, Brown, & Kerse, 2008). Hemispatial neglect is an acquired neuropsychological condition that frequently results from stroke (Stone et al., 1991). This disorder involves decreased awareness of an area of space. The area of space most frequently neglected is contralateral (opposite) to the lesioned hemisphere (contralesional). Often patients with hemispatial neglect fail to eat food on the contralesional side of their plate, do not apply make-up to/shave that side of their face, and do not respond to people on the neglected side (e.g. Bisiach, 1996). It is as if that side of space has vanished from their representation of the world.. 1.
(29) Chapter 1. Hemispatial neglect is a debilitating disorder which is a strong predictor of hampered functional recovery and a major disruptive factor impeding rehabilitative success following stroke (Denes, Semenza, Stoppa, & Lis, 1982; Jehkonen et al., 2000; Kinsella & Ford, 1984; Smith, Akhtar, & Garraway, 1983; Sunderland, Wade, & Langton-Hewer, 1987). Patients with neglect show reduced independence, with extensive and more demanding motoric rehabilitation compared to stroke survivors without neglect (Denes et al., 1982). The effectiveness of rehabilitative techniques for motoric and cognitive deficits may also be reduced in neglect due to a high proportion of neglect patients experiencing anosognosia, a condition whereby patients do not acknowledge their deficit (e.g. Stone, Halligan, & Greenwood, 1993) or anosodiaphoria (indifference to their deficits; Gainotti, 1972, as cited in Denes et al., 1982). These additional complications can lead to a failure in neglect patients adopting compensatory responses and behaviours to aid attention to the usually neglected side of space. It is important to note that the failure to report information on the neglected side of space is not due to a sensory and/or motor loss, although these aspects may be implicated (e.g. the motor intention hypothesis, Karnath, Milner, & Vallar, 2002), but due to a deficit of attention (Behrmann, Ghiselli-Crippa, Sweeney, Di Matteo, & Kass, 2002). It has been suggested that neglect reflects a fundamental failure in allocating attention to the contralesional side of space, and it is that which causes the perceptual deficit (e.g. Rizzolatti & Carmada, 1987). It has been demonstrated that patients are able to accurately perceive information on the neglected side if they are prompted to attend to it (e.g. Grabowecky, Robertson, & Treisman, 1993); although there is evidence that this is not always the case, as they mat not perceive information even if they do look at it (Forti, Humphreys, & Watson, 2005; Walker, Findlay, Young, & Lincoln, 1996; see Eye Movements in Hemispatial Neglect, below). There is also suggestion that there is no ocular deficiency in neglect (e.g. Van der Stigchel & Nijboar, 2010). Even though it is often assumed that patients fail to report information because they do not look to the contralesional area, participants can saccade (make an eye movement) to the contralateral side of space if a target is presented there (Van der Stigchel & Nijboar, 2010). However, whether they then can sufficiently, and efficiently, process that information in order to accurately report it once they have fixated it is not entirely clear. This is the main question outlined in the section entitled Mechanisms Underlying Neglect: The Value of Eye Movement Analyses. The reason that the attentional deficit is contralesional is due to the anatomy of the visual system. The visual field is split vertically 2.
(30) Literature Review into left and right visual fields for each eye (Buser & Imbert, 1992). The external environment is processed contralaterally, such that information presented to the left visual field (LVF) is predominantly processed by the right hemisphere, and vice-versa (MichaelTitus, Revest, & Shortland, 2007). Therefore, the area of space predominantly ignored in hemispatial neglect is contralesional to the damage. However, bilateral inattention can occur in neglect (see Bisiach & Vallar, 1988), with contralesional and ipsilesional information (information on the same side of the lesion) being missed, depending on the reference frame that is operating for the task (see the section on Spatial Frames of Reference in Neglect). Nevertheless, typically patients fail to attend to the area of space contralateral to the lesion, as well as information falling within the LVF. This is an important distinction and there is an on-going debate with regard to the spatial frames of reference that are operating in neglect. Hemispatial neglect is observed with greater frequency and severity after lesions to the right hemisphere compared to when there are left hemisphere lesions, resulting in the left side of space being neglected (e.g. Denes et al., 1982; Halligan, Marshall, & Wade, 1990; Stone et al., 1993). Up to 85% of patients suffering from right hemisphere stroke demonstrate neglect, if only for a short period of time (e.g. Denes et al., 1982; Stone et al., 1993). Additionally, hemispatial neglect is more likely to result after right parietotemporal lesions (Brain, 1941), which may be a result of the right hemisphere serving many spatial functions (Coull & Nobre, 1998; Corbetta, Miezin, Shulman, & Peterson, 1993; Nobre et al., 1997) which damage to this area disrupts. Therefore, throughout this review, where appropriate, the neglected side of space will be referred to as the left side. Even though sometimes neglect recovers after the acute phase has passed (Kinsella & Ford, 1985; Stone et al., 1993), 10% of stroke patients still present with neglect three months after the stroke occurred (Hurwitz & Adams, 1972; Stone, Patel, Greenwood, & Halligan, 1992). Thus, given that individuals suffering from visual neglect have a hindered rehabilitation, it is important to understand the underlying deficits involved in this disorder in order to develop effective rehabilitative techniques (see Mechanisms Underlying Neglect: The Value of Eye Movement Analyses section). Neglect is also of scientific interest, due to the insight gained regarding elusive functions of the brain, such as how the brain codes spatial information, allocates attention and processes visual information (Buxbaum, 2006), and how these factors may interact. These will be considered in detail later in the review. First, the various ways in which neglect is currently measured and neglect patients’ typical performance on the tasks will be discussed. 3.
(31) Chapter 1. 1.2 The Behavioural Inattention Test The Behavioural Inattention Test (BIT) was developed to diagnose and determine the severity of neglect (Wilson, Cockburn, & Halligan, 1987). This battery is composed of six different conventional tests and nine behavioural tasks. The conventional tests are the line, star and letter cancellation tasks; figure and shape copying; representational drawing; and line bisection. The behavioural tests are menu reading; picture scanning; telephone dialling; article reading; telling and setting the time; coin sorting; address and sentence copying; map navigation; and card sorting. Two of the most commonly used sub-tests to diagnose and determine the severity of neglect are the cancellation and figure copying tasks (Black et al., 1994; Parton, Malhotra, & Husain, 2009), which are employed in experiments reported in this thesis. Cancellation tasks require the patient to find and cross through all target items that are displayed amongst distractor items on a piece of paper presented in front of them (e.g. crossing through all the lines in the line cancellation task, see Figure 1). Neglect patients often fail to cross through target items lying on the left side of the stimulus, which corresponds to information on the patients’ left side. Figure copying tasks require the patient to draw an image placed in front of them, with patients routinely failing to produce information presented on the left side of the picture (Black et al., 1994; see 2.2 The Value of Figure Copying Tasks in Revealing Frames of Reference Operating in Neglect for further information).. Figure 1. The line cancellation task from the Behavioural Inattention Test. This, along with the letter and star cancellation tasks, was employed in Experiment 1 reported in Chapter 2. The participants were instructed to use a pen to ‘cancel’ all the lines that they could see on the page. 4.
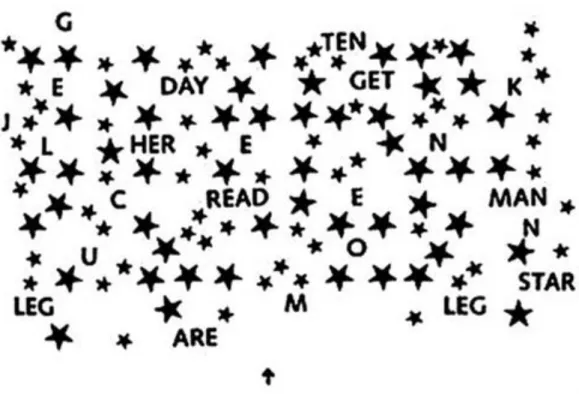
(32) Literature Review The three cancellation tasks included in the BIT are the line, letter and star cancellation tasks. The line cancellation task is composed of 40 short lines of varying orientations arranged in seven columns each containing six or four lines (see Figure 1). This is a detection task only, as patients are required to cross through all the lines presented on the page and therefore do not have to discriminate between targets and distractors (as there are no distractors present). The letter cancellation task contains 5 lines of 34 random capital letters, containing 40 target letters to be identified by the participant (‘E’s and ‘R’s [see Figure 2]). The star cancellation task is composed of small and large stars, along with short words and capital letters (see Figure 3). The participant is required to ‘cancel’ the 54 small stars with a pen. Frequently, neglect patients fail to cross through targets that lie to the left (the contralesional side) of the page and will also start the task on the right (the ipsilesional side), which is unusual for control participants (e.g. Forti et al., 2005; Behrmann, Watt, Black & Barton, 1997).. Figure 2. The letter cancellation task from the Behavioural Inattention Test. The participants were instructed to cross through the letters ‘E’ and ‘R’ in the stimulus.. 5.
(33) Chapter 1.. Figure 3. The star cancellation task from the Behavioural Inattention Test. Patients are instructed to mark all the small stars on the page with a pen after the experimenter demonstrates the difference between the large and small stars in the task and crosses through two of the central small stars. 1.2.1 Sensitivity and Reliability. The cancellation tasks are widely used in clinical settings due to the fact that they are simple and easy to administer at the bedside, and are also scored objectively. These tests are regarded as sensitive pen-and-paper measures (Azouvi et al., 2002) for demonstrating whether neglect is present. A limited number of investigations have been conducted to determine the sensitivity of the sub-tests included in the BIT. For a test to be sensitive, the task should place demands on underlying deficits experienced by neglect patients and, therefore, reveal whether a patient has neglect through their failure to successfully complete the task. Studies have demonstrated that increasing demands on visual selective attention, for example presenting targets amongst distractors that are required to be distinguished from one another, decreases performance in visual search tasks in patients with neglect (Ferber & Karnath, 2001). For example, it has been established that cancellation tasks requiring search for target elements, like the letter and star cancellation tasks in the BIT, are more sensitive than the simple line bisection tests (Ferber & Karnath, 2001) that involves participants placing a vertical line at the midpoint of a horizontal line, outlined next. The main subtests that are used in isolation to diagnose neglect within the clinical setting will now be 6.
(34) Literature Review outlined with regards to the underlying deficit(s) they reveal and the sensitivity of the test in indicating neglect is present will be considered. Line bisection. In the line bisection task from the BIT the participant is required to place a vertical line at the midpoint of three horizontal lines that are presented at different positions on the page. Typically patients with neglect bisect the line further to the right. Some researchers have postulated neglect patients bisect the line further to the right because they have failed to perceive the left side of the line or underestimated its extent. This has been supported by research that has demonstrated that patients failed to fixate to the left of the centre of the line and, therefore, may not have been able to encode it (Ishiai, Furukawa, & Tsukagoshi, 1989). An alternative explanation has been offered by McIntosh, Schindler, Birchall, and Milner (2005). They provided evidence that line bisection error was due to the patients being unable to concurrently represent both sides of the line, which would occur even if the left side were to have been fixated. However, eye movements were not recorded during this task, and therefore, it is not clear whether the left side of the line was neglected because it was not fixated, or because it was fixated but not represented by the neglect patients. This is an important theoretical issue that will be outlined later in this review and investigated by the experiments conducted on neglect patients using eye movement methodology reported in Experiments 1-4 in this thesis. The contribution of eye movement research to the understanding of neglect will be outlined in the section entitled Mechanisms Underlying Neglect: The Value of Eye Movement Analyses. In an investigation conducted by Ferber and Karnath (2001) on the sensitivity of tasks in revealing neglect, they compared neglect patients performance on the line bisection and cancellation tasks. They found that when the patient’s accuracy on the line bisection task was taken into consideration in isolation (i.e. without performance measures from any other test of neglect), almost 40% of the patients were not identified as having neglect. This raises the question of the sensitivity of this test in revealing neglect or even whether this test reflects a specific type of deficit of neglect. Milner and McIntosh (2005) note that double dissociations between performance on line bisection tasks and other tests of neglect, such as cancellation tasks, occur in neglect. This means that these tests cannot be measuring the same unitary disturbance. Cancellation tasks. The BIT includes the line, letter and star cancellation tasks, which are regularly used in isolation to identify neglect and have been suggested to be more sensitive measures of neglect than the line bisection task (Ferber & Karnath, 2001). 7.
(35) Chapter 1. Additionally, differences in the sensitivity of the cancellation tasks in revealing neglect have been established. Ferber and Karnath (2001) compared accuracy on three cancellation tasks that were similar to the line, letter and star cancellation tasks included in the BIT for 35 neglect patients. The letter cancellation, which included 60 target items (the letter ‘A’) pseudo-randomly interspersed with distractors, was found to have the highest sensitivity of all the tasks employed. This was indexed by 94% of patients with neglect being accurately diagnosed when the letter cancellation task results were considered in isolation. Furthermore, this test had the highest percentage of omitted targets overall in the neglect group (62%) than any of the tests administered. The star cancellation task was the next most sensitive task, with 87% of stroke patients being correctly identified compared with only 71% when the line cancellation task was used. The line cancellation task is relatively less complex, as all the items on the page are required to be crossed through (as such this is a detection-task only). The line cancellation task includes fewer target items than the letter and star cancellation tasks. Therefore, it appears that the sensitivity of the tasks relate to the physical properties of the stimulus (e.g. density of the information presented, number of targets and distractors, size of the targets) and task demands. As tasks get more complex, they become more visually and cognitively demanding, resulting in poorer performance in neglect. For example, when conducting search for two items (as in the letter cancellation task) as opposed to one (as in the star), extent of neglect is exacerbated, as patients find it harder to identify targets overall in the letter cancellation task. It seems likely that this is due to the increased cognitive load in this task. Tasks with fewer cognitive demands may be less sensitive to neglect. This will be considered further in Experiment 1. Physical properties of the letter cancellation task that may affect the task’s difficulty are, firstly, the similarity of the distractors to the target items and the systematicity of search that is required for this task. To expand on the first difference, in the letter cancellation task other letters were employed as distractors for the target letter, ‘A’, so the distractors were highly similar to the target and harder to distinguish than the distractors and targets were in the star cancellation task. When targets and distractors are more difficult to distinguish, this may place higher demands on cognitive processing when searching for targets (Ferber & Karnath, 2001), as no ‘pop out’ effect occurs (Treisman & Gelade, 1980) for the target items. Targets that do not ‘pop-out’ fail to be salient items as they do not possess any features that can be detected (and distinguished from distractors) pre-attentively (i.e. without an eye movement being made to that target). The star 8.
(36) Literature Review cancellation task included many different distractors (e.g. words, letters, large stars), and these, arguably, can be more easily discriminated from the targets (due to size and shape). The more similar a target is to a distractor, the less salient that target item is (Aglioti, Smania, Barbieri, & Corbetta, 1997). Aglioti et al. (1997) found that neglect patients’ performance on a visual search task was exacerbated when the target was low in salience. Aglioti and colleagues believed that the processing of targets with low salience engaged higher focal attention so that it could be distinguished from the distractors. As mentioned earlier, the line cancellation task does not require the patient to distinguish between targets and distractors as it is a detection task, and therefore is the least cognitively demanding of the three tasks and the least likely to identify neglect in isolation. The second possible explanation for the increased sensitivity of the letter cancellation task is that reading may induce more systematic (left-to-right, line-by-line searching) and focused search. That is to say, reading starts on the left of a line in English and therefore there is likely to be an inherent tendency, when searching for target items in a letter cancellation task, to look at each letter along the horizontal extent of that line from left-to-right. Any disruption to this systematicity, likely experienced in neglect due to disinclination to explore the left side of space, could adversely affect performance. Azouvi et al. (2002), like Ferber and Karnath (2001), also found that tests with a strong visual component were more likely to reveal neglect. A reading task, composed of 12 lines (of which 5 were to be read by the participant) was the most sensitive measure compared to the other tests included in the battery. The bells test, in which participants are required to search a vast visual array composed of target items (bells) and distractors (a number of different objects) presented pseudorandomly on an A4 sheet of was deemed as the second most sensitive test. Furthermore, neglect appeared to be exacerbated by the following: increased density of the elements comprising the stimulus (i.e. targets and distractors being heavily concentrated), random distribution of targets amongst distractors and increased numbers of distractors (Azouvi et al., 2002). In summary, there appear to be two main aspects contributing to cancellation tasks’ sensitivity in identifying neglect. The first is the physical properties of the stimulus and the second is the level of task difficulty; the latter relates to the number of cognitive demands the test requires in order to be successfully completed. The physical properties of the stimulus (such as density of the information presented in the task) affect the task difficulty (i.e. the task is harder to complete when the stimulus has a high density of targets and distractors). It is currently not known why these aspects affect test sensitivity and 9.
(37) Chapter 1. modulate the extent of information that is neglected on a test. The fact that different cognitive demands affect the extent of neglect exhibited, suggests that the more information there is to process (e.g. many targets and distractors being present), or the harder it is to process information (e.g. similar targets and distractors being present in the task), the poorer a neglect patients’ performance will be. This in turn would imply that a processing deficit of contralesional information may be contributing to poor performance in visual search tasks. This is another main theoretical issue that will be considered later in this review under the Mechanisms Underlying Neglect: The Value of Eye Movement Analyses section. The offline measures these tasks provide are not informative with regards to how attention is allocated in neglect. The measurement of eye movements is now widely recognised within cognitive science as a valuable experimental technique to investigate human visual and cognitive and attentional processing (Liversedge & Findlay, 2000; Rayner, 1998). No empirical investigations have been conducted measuring neglect patients’ eye movements as they complete cancellation tasks, that are similar to those incorporated in the BIT. The letter, star and line cancellation tasks were employed as experimental stimuli in Experiment 1, reported in Chapter 2, in order to investigate visual, cognitive and attentional processing in neglect during these visual-motor tasks that vary in complexity. Figure copying. Figure copying it is also a conventional test contained in the BIT. It is the second most used test for identifying neglect (Bowen, McKenna, & Tallis, 1999) and it is easy to administer and is sensitive to the underlying deficits in neglect (Halligan, Marshall, & Wade, 1990; Halligan & Robertson, 1992). The task provokes a strong engagement of focal attention due to requiring encoding of visual information to be copied, if an attentional deficit exists then the task is likely to expose deficits, such as omissions of elements on the contralateral side (Ishiai, Seki, Koyama, & Yokota, 1996), and should reflect the dysfunctional spatial representations that exist in neglect. Additionally, the task is cognitively challenging as it requires complex and resource demanding visual-motor responses in the contralateral hemispace (Azouvi et al., 2002). Azouvi et al. (2002) found that figure copying was the third most sensitive test of visual neglect from a battery of tests, following the BIT letter cancellation task and the Bells test. However, the stimuli have to be designed appropriately in order to maximise the sensitivity of the test and minimise subjectivity in scoring the behavioural assessment. For example, copying of a single item has been shown to have low sensitivity and high subjectivity (Bailey, Riddoch, & Crome, 2006; Johannsen & Karnath, 2004). Johannsen 10.
Figure

+7
Outline
Frames of Reference for the Coding of Spatial Information
Eye Movements in Hemispatial Neglect
Data Analysis
Line Cancellation Task Results
Did Limb Stimulation Treatment affect the Pattern of Eye Movements and Extent of
Target Identification Accuracy (TIA) in the SEAN Task
Why was there no Evidence of Allocentric Neglect Observed in this Experiment?
Did Neglect Patients Demonstrate Egocentric Neglect?
Comparing the SEAN and Clock Cancellation Tasks: Which Factors Affected the Neglect
Do Task Demands Effect Frames of Reference Operating in Neglect?
Related documents
2 depicts the classification results of supervised SVM (trained with only two labeled samples), CCCP TSVM, and our Two-view TSVM on the synthetic data set.. The super- iority
This course uses the programming language Python as its basis for learning, which some people may find easier than the C language used in CS50x.. What should
In summary and taking into account the resonance characteristics of the ACUREX plant, the main contribution of this paper, is to improve a gain schedul- ing (GS) predictive
These starch grains can be confidently used to identify Zea mays due to the lack of similar starch grains produced by wild or domesticated plant species observed in the 154
For this study, a focus will be given on developing a prototype for a pond system by monitoring the feeding management, feeding management is control based on fish behaviour
Factors, Practices, and Policies Influencing Students’ Upward Transfer to.. Baccalaureate-Degree Programs and
Second, factors affecting the source, fate and transport of phosphorus that can be used to infer source water quality changes are examined to elucidate potential drinking
It then provides evidence of successful securitisation, demonstrates how the sequence of infectious outbreaks (SARS, H5N1, and H1N1) have occurred in the region over
