Figure 1: A demonstration <VRIA> application running on a mid-range smartphone with Chrome for Android and Google Cardboard. The user is able to fully interact with all controls via a gaze cursor.
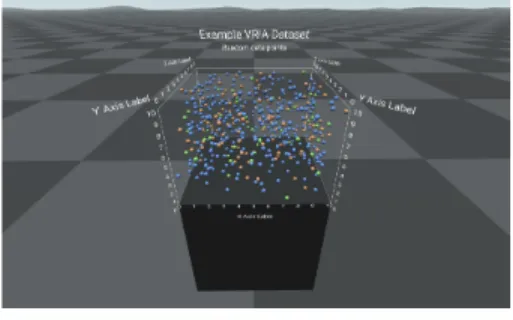
Figure 2: Example of a scatter plot, created with <VRIA>, depicting a randomly generated multivariate dataset with 500 data points.
VRIA - A Framework for Immersive
Analytics on the Web
Peter W. S. Butcher University of Chester Chester, Cheshire, UK [email protected] Nigel W. John University of Chester Chester, Cheshire, UK [email protected] Panagiotis D. Ritsos Bangor University Bangor, Gwynedd, UK [email protected] ABSTRACT
UPDATED—February 11, 2019. We report on the design, implementation and evaluation of<VRIA>, a framework for building immersive analytics (IA) solutions in Web-based Virtual Reality (VR), built upon WebVR, A-Frame, React and D3. The recent emergence of affordable VR interfaces have reignited the interest of researchers and developers in exploring new, immersive ways to visualize data. In particular, the use of open-standards web-based technologies for implementing VR in a browser facilitates the ubiquitous and platform-independent adoption of IA systems. Moreover, such technologies work in synergy with established visualization libraries, through the HTML document object model (DOM). We discuss high-level features of<VRIA>and present a preliminary user experience evaluation of one of our use-cases.
, , .
INTRODUCTION
KEYWORDS
Immersive Analytics; Information Visualization; Virtual Reality; Web-based Interaction.
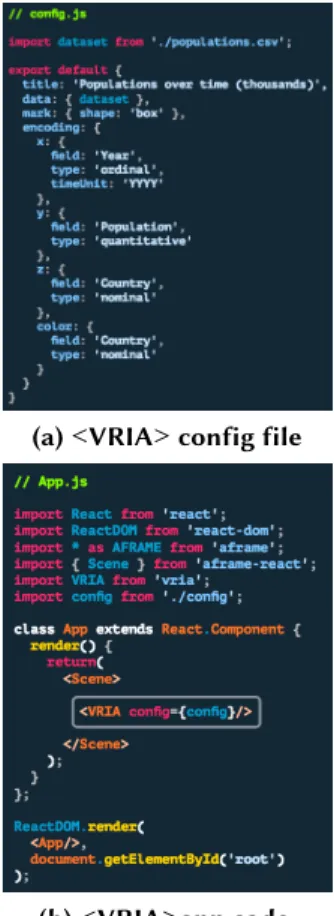
(a)<VRIA>config file
(b)<VRIA>app code
Figure 3: Examples of a configuration (a) and an application file (b) for<VRIA>.
Immersive Analytics (IA) is an emerging research theme, which explores visual mechanisms for data exploration and analysis, away from desktop computers and Window-Icon-Mouse-Pointer (WIMP) interfaces [4]. In this research theme, Virtual Reality (VR) has a prominent place as one of the most popular paradigms for beyond-the-desktop interaction. Motivated by the recent emergence of affordable, commercially available head-mounted-displays (HMDs), such as the HTC Vive and Oculus Rift, we investigate the design and implementation of tools that will enable the visualization community to explore whether, and how, data visualization can be enhanced by the use of VR.
We present work-in-progress on our IA framework,<VRIA>, which facilitates the development of IA solutions for the web, and is built upon WebVR, A-Frame and React. We are particularly interested in using open-standards Web-based technologies, as we believe that the Web is the most ubiquitous, collaborative and platform-independent way to build and share information [9]. Moreover, such open-standards technologies work in synergy with established visualization libraries (e.g., D3.js), through the HTML document object model (DOM).
BACKGROUND
The importance of standardization as an interoperability enabler in the development of VR systems has been highlighted [2]. Yet, for VR-based Immersive Analytics in particular, few efforts focus on open-standard Web technologies, e.g. [3]. Of particular interest to our work is the Web-based visualization library, Stardust [7], which has a focus on graphical, GPU-driven performance and shares a number of similarities with our work (declarative grammar, web-technologies, WebVR support). However, its main goal is to achieve significant performance improvements for GPU-based rendering of either 2D or 3D content. Our work, however, focuses on providing a flexible and extensible framework for building VRspacesfor IA solutions, accessible on the Web, that nonetheless support a variety of interface devices. Another recent effort using web-standards is VR-Viz [10] which, although it offers a large number of 3D depictions, interactions are (seemingly) limited to hovering. Other frameworks and prototyping tools for IA include DXR [12] and ImAxes [5], The former shares a similar philosophy to<VRIA>, in terms of prototyping visualizations for both VR and AR but is built around the game engine Unity. ImAxes [5], also built for Unity, is intended for exploring multivariate data using virtual axes that can be arranged and combined in virtual space.
THE<VRIA>FRAMEWORK
Following our prior investigations [2, 3], we were motivated to devise a framework that would allow anyone to create interactive spaces depicting immersive WebVR data visualizations.<VRIA>includes methods for rapid prototyping with simple configuration files, as well as an API that facilitates the
creation of bespoke visualizations and interactions. By accommodating both of these approaches, <VRIA>is suitable for both seasoned programmers and users with little programming experience.
<VRIA>is written in React, a JavaScript library for building user interfaces; Redux, a state container for JavaScript applications; A-Frame, a framework for building WebVR experiences and D3 for data transformations. The exact structure and implementation of the high-level DOM architecture of an application that makes use of<VRIA>is up to the user. There is also no requirement for the whole application to be written in React.<VRIA>can be integrated into existing applications, with the only requirement being that the overarching application makes use of A-Frame scenes.
<VRIA>provides a simple method of mapping a dataset into WebVR-ready 3D visualizations, coupled with a set of appropriate interfaces (controls), through a declarative format described with JSON (Fig 3a). This forms a visualization configuration that our framework can interpret, and allows users to create different depictions through setting parameters, properties and constraints tailored to each visualization type. In its most basic form, a visualization configuration consists of a dataset, a set of encoding channels and data fields, akin to Vega-Lite [11]. This can either be packaged up as a JSON file or as a JavaScript module. If extra functionality is required, such as a custom set of interactions or a bespoke visualization type, then these can be created with A-Frame and<VRIA>’s API.
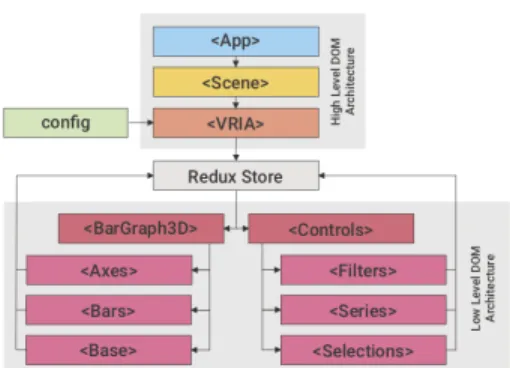
Figure 4: Architectural overview of an example application built with <VRIA>. This diagram also gives a high-level depiction of how data flows through an application.
The top level node in the example application depicted in Figure 4 is a React component ( ), which contains an A-Frame scene component ( ). The scene component can contain any other A-Frame components that a user desires.<VRIA>provides a React component calledVRIA( ) which must be placed within the scene element and should be passed a visualization configuration file ( ). Everything that this component generates is mandated by the configuration file that is passed to it. The store ( ), is implemented with Redux and contains the application state. It is connected to visualization and control components ( ). These components map data to React components ( ), which depict the visualization and all user interfaces with A-Frame (and ThreeJS that underlines it). They also respond to user interaction and report these actions back to the store, which then updates the visualization. <VRIA>currently supports tabular data inputs formatted as JSON or CSV. Data sets may contain any number of fields and records. Supported visualization types currently include 3D bar charts and multivariate scatter plots (Figure 2) with more abstract data visualization types planned. Each visualization has its own set of possible interactions that can be selectively enabled or disabled in the visualization configuration.
More information on<VRIA>is available at
https://github.com/vriajs. Visualization and control components are written using A-Frame. The framework’s API is used
to map controls to data transformations, which are then reflected in the visualization. The exact nature of the data transformations and desired interactions are left to the user; the framework then connects everything together. Data transformations for new visualizations can be achieved with existing libraries such as D3.js, or can be written from scratch.
EVALUATION
(a)
(b)
(c)
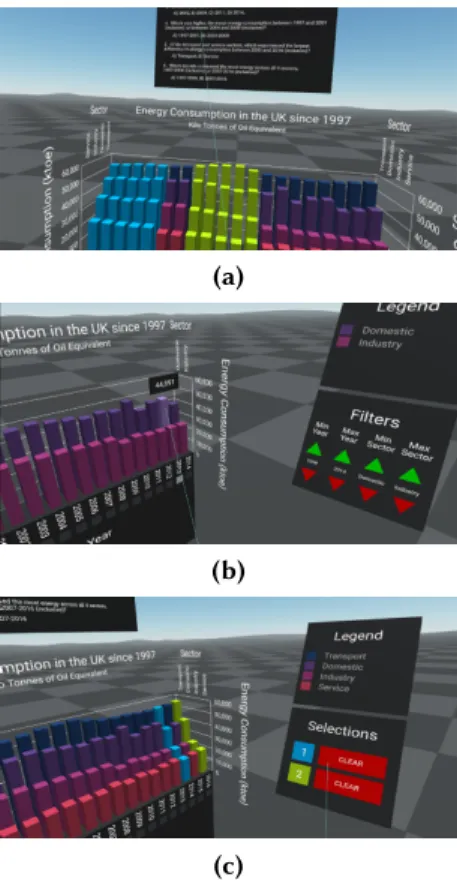
Figure 5: Different views of our use-case scenario, built with <VRIA>, depicting a 3D bar chart of the UK energy consumption data between 1997 and 2016. The evaluation questions are depicted in VR (a), and menus for filtering, brushing and selecting are provided (b) (c). All GUI elements were accessible using the Oculus Rift’s Touch controllers in VR.
We conducted a user study to evaluate a use-case scenario, produced with the current version of <VRIA>, in terms of usability, user experience and the presence of any simulator sickness symptoms. By evaluating our framework at this intermediate stage we aimed to inform design decisions going forward. We collected data using the Simulator Sickness Questionnaire (SSQ) methodology [6], the System Usability Scale (SUS) survey [1], timings of task completion and post-experiment open-ended questions. We recruited a convenience sample of 30 participants, between 18 and 65 years of age, 24 identifying as male and 6 female. 24 had prior experience with VR, whereas 6 (3 male and 3 female) had not used any VR technology before. All participants reported they had good or corrected eyesight. The evaluation was conducted using a Windows 10 PC (Intel i7, 32GB RAM, Nvidia GTX980 Ti). The web applications were displayed using the Mozilla Firefox Quantum browser.
To reduce the effect that the type of visualization has in the overall user experience we selected an analytical task that uses 3D bar charts, and builds upon our previous work [2, 3, 8]. Bar charts are easy for non-experts to understand, familiar and therefore simpler to comprehend, compared to, say, a node-link diagram. Our intention was to reduce the effect of the complexity of the visualization in the overall user experience. The test applications used UK energy consumption data between 1997 and 20161. We used three test conditions:
1
https://www.gov.uk/government/collections/energy-consumption-in-the-uk
Condition 1: WebVR with a<VRIA>application, interacting with the data via an Oculus Rift HMD and Oculus Touch controllers.
Condition 2: WebVR with a<VRIA>application but instead viewed on a 2D PC monitor with mouse interactions.
Condition 3: A non-immersive 2D visualization rendered on a 2D PC monitor with mouse interactions.
Each participant completed the experiment using all three test conditions with the order being randomized. Test conditions 1 and 2, used a 3D bar chart and condition 3, used a layered bar chart, to display the data from four different consumer sectors on a year by year basis. In each test condition, the participants were provided with six multiple-choice questions on the dataset. Users were able to filter the data and make selections, presenting users with basic statistics about their chosen data range. For the participants in VR, the questions were displayed in the application (see Fig. 5a).
Results and early insights
On average the participants reported, in the SSQ [6], none to slight levels of nausea, oculomotor issues and disorientation, with only one participant reporting slight levels of oculomotor issues after the experiment. In terms of the usability assessment, the average SUS score for the 3D HMD task was 77.75 (SD=12.7), indicating ‘good’ usability (see Figure 7). Scores ranged from a minimum of 45 to
a maximum of 95. Likewise, we collected SUS scores for the other two set-ups, for comparison and completions. The 2D desktop set-up was deemed good at 82.08 (SD=12.72), and the 3D desktop set up was deemed poor at 63.08 (SD=17.82) (see Fig. 7).
(a)
(b)
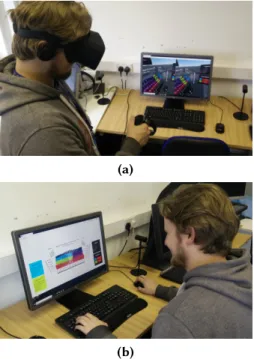
Figure 6: A study participant evaluating the WebVR IA application, using our
<VRIA>environment with an Oculus Rift and Touch controller (a), and the 2D evaluation task, with mouse controls (b).
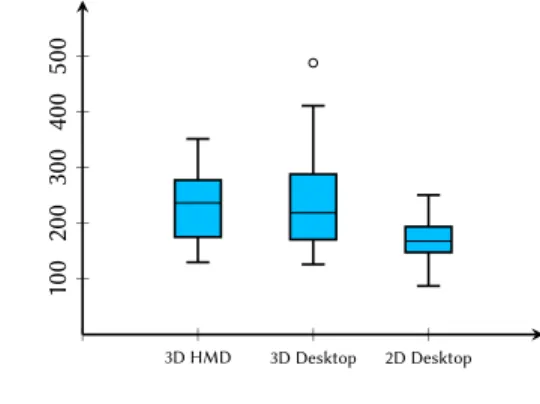
Completion times and accuracy data (a mark out of six per set of questions) for each test condition were run through a repeated measures ANOVA within-between interactions using a Bonferroni post-hoc statistical test. The difference in accuracy between the different test conditions showed no statistical significance, largely due to there only being a total of eight mistakes made across the entire sample, by seven participants. Three mistakes were made in the HMD-based test condition, three in the 3D desktop test condition, and two in the 2D desktop test condition. There was however statistical significance in completion times between the HMD-based and 2D test conditions, and between the 3D and 2D tasks on desktop (see Fig. 8). Once outliers are omitted, the mean task completion times were 232 sec for HMD/3D, 233 sec for Desktop/3D and 161 sec for Desktop/2D.
Out of the almost 200 constructive comments, we only report on those that focus on the<VRIA> application and are relevant to the HMD-based tasks. Positive sentiments that participants used in their open-ended comments, used to describe their experience included: satisfying,fun,novel,
entertaining,intuitive,enjoyable,amazing,engaging,uniqueandresponsive. A number of participants stated that they found the HMD-based condition"more enjoyable"and"more engaging"than the other. One user remarked that they were able to"focus on the task without stopping"as they weren’t being affected by"peripheral distractions present in the real world". Around half of all positive comments related specifically to the available interactions, stating that they felt the"controls were well tailored to the task", that they"enjoyed using the laser pointer", and in one case"preferred controller to mouse". A couple of comments eluded to the bars and control elements themselves:"Bars and controls were large enough for the sensitivity of the controller","Very responsive, liked feedback of interactive elements".
The single most common negative comment came from eleven people expressing that they"had to turn[their]head a lot between selections, questions and visualizations". Other negative comments included mention of a"lack of a hover prompt on filters"and difficulty trying to read"vertically aligned text". Usability issues raised included a mention that the pointer controller was"harder to use on distant objects". One participant also shared that they found the task"entertaining" but that it"didn’t feel as efficient as other [tasks]".
The most popular suggestion (made by seven participants), was the ability to"allow objects in the scene to be moved [as well as scaled] by the user". Six comments suggested that we"move scene objects closer together to reduce the amount of head turning". Suggestions to improve the user interface and interactions included the ability to"place the study questionnaire [and/or other UI elements] on to the hand controllers"so that a user may glance at them at wherever they’re facing in the scene.
CONCLUSIONS AND FUTURE WORK 3D HMD 3D Desktop 2D Desktop 50 100 Test Condition SUS Scor e
Figure 7: Box plot of SUS scores. The usability of the 2D desktop set-up is high, compared to the pseudo-3D variant, with the HMD-based system close in perceived usability to the 2D set-up.
3D HMD 3D Desktop 2D Desktop 100 200 300 400 500 487.76 363.28 319.04315 290.3 283.05 231.85 232.4 160.47 Test Condition Completion Time (se c )
Figure 8: Boxplots showing the difference in completion times across the three test conditions.
We present <VRIA>, a framework for building VR spaces for Immersive Analytics, using open-standards Web-technologies, built using WebVR, A-Frame, React and D3.<VRIA>uses a declarative format for specifying visualizations through simple configuration files, simplifying visualization prototyping, data binding and interaction configuration. Resulting IA spaces can be experienced through a WebVR-compliant browser and a variety of VR-enabled devices. Our preliminary evaluation indicated that users found our HMD-based solution more engaging, despite taking longer on average to complete each task. In that regard, VR has the potential to create experiences that engage the user’s more effectively on a preliminary stage despite possible limitations, in analytical versatility. We currently work towards more visualization types, along with their task-specific interaction mechanisms. We also plan to integrate features that allow collaboration in VR space.
REFERENCES
[1] John Brooke. 1996. SUS-A quick and dirty usability scale.Usability evaluation in industry189, 194 (1996), 4–7.
[2] Peter W. Butcher and Panagiotis D. Ritsos. 2017. Building Immersive Data Visualizations for the Web. InProcs. of
International Conference on Cyberworlds (CW’17). 142–145. https://doi.org/10.1109/CW.2017.11
[3] Peter W.S. Butcher, Jonathan C. Roberts, and Panagiotis D. Ritsos. 2016. Immersive Analytics with WebVR and Google
Cardboard. InPosters of the IEEE Conference on Visualization (IEEE VIS 2016), Baltimore, MD, USA.
[4] T. Chandler, M. Cordeil, T. Czauderna, T. Dwyer, J. Glowacki, C. Goncu, M. Klapperstueck, K. Klein, K. Marriott, F.
Schreiber, and E. Wilson. 2015. Immersive Analytics. InProcs. of Big Data Visual Analytics ((BDVA)). 1–8. https:
//doi.org/10.1109/BDVA.2015.7314296
[5] Maxime Cordeil, Andrew Cunningham, Tim Dwyer, Bruce H. Thomas, and Kim Marriott. 2017. ImAxes: Immersive Axes As
Embodied Affordances for Interactive Multivariate Data Visualisation. InProcs. of the ACM Symposium on User Interface
Software and Technology ((UIST)). ACM, New York, NY, USA, 71–83. https://doi.org/10.1145/3126594.3126613
[6] Robert S Kennedy, Norman E Lane, Kevin S Berbaum, and Michael G Lilienthal. 1993. Simulator sickness questionnaire:
An enhanced method for quantifying simulator sickness. The International Journal of Aviation Psychology3, 3 (1993),
203–220. https://doi.org/10.1207/s15327108ijap0303_3
[7] Donghao Ren, Bongshin Lee, and Tobias Höllerer. 2017. Stardust: Accessible and Transparent GPU Support for Information
Visualization Rendering.Computer Graphics Forum36, 3 (2017), 179–188. https://doi.org/10.1111/cgf.13178
[8] Panagiotis D. Ritsos, James Jackson, and Jonathan C. Roberts. 2017. Web-based Immersive Analytics in Handheld
Augmented Reality. InPosters presented at the IEEE Conference on Visualization (IEEE VIS 2017), Phoenix, Arizona, USA.
[9] Jonathan C. Roberts, Panagiotis D. Ritsos, Sriram Karthik Badam, Dominique Brodbeck, Jessie Kennedy, and Niklas
Elmqvist. 2014. Visualization Beyond the Desktop - the next big thing.IEEE Computer Graphics & Applications34, 6 (Nov.
2014), 26–34. https://doi.org/10.1109/MCG.2014.82
[10] Mustafa Saifee. 2018. VR-Viz. https://github.com/mustafasaifee42/VR-Viz.
[11] A. Satyanarayan, D. Moritz, K. Wongsuphasawat, and J. Heer. 2017. Vega-Lite: A Grammar of Interactive Graphics.IEEE
Transactions on Visualization and Computer Graphics23, 1 (Jan 2017), 341–350. https://doi.org/10.1109/TVCG.2016.2599030 [12] R. Sicat, J. Li, J. Choi, M. Cordeil, W. Jeong, B. Bach, and H. Pfister. 2019. DXR: A Toolkit for Building Immersive Data
Visualizations.IEEE Transactions on Visualization and Computer Graphics25, 1 (Jan 2019), 715–725. https://doi.org/10.