Dissertation
zur Erlangung des akademischen Grades Doktoringenieur (Dr.-Ing.)
vorgelegt an der
Technischen Universität Dresden Fakultät Informatik
eingereicht von
Siavash Ghiasvand
Gutachter: Prof. Dr. rer. nat. Wolgang E. Nagel Technische Universität Dresden Prof. Dr. rer. nat. Martin Schulz Technische Universität München
plexity, and the advent of faster and more complex Exascale systems, failures became the norm rather than the exception. Hence, the protection mechanisms need to be improved. The most de facto mechanisms such as checkpoint/restart or redundancy may also fail to support the continuous operation of future HPC systems in the presence of failures. Fail-ure prediction is a new protection approach that is beneficial for HPC systems with a short mean time between failure. The failure prediction mechanism extends the existing protec-tion mechanisms via the dynamic adjustment of the protecprotec-tion level. This work provides a prototype to analyze and predict system behavior using statistical analysis to pave the path toward resilience in HPC systems. The proposed anomaly detection method is noise-tolerant by design and produces accurate results with as little as 30minutes of historical
data. Machine learning models complement the main approach and further improve the accuracy of failure predictions up to85%. The fully automatic unsupervised behavior
anal-ysis approach, proposed in this work, is a novel solution to protect future extreme-scale systems against failures.
Contents
1 Introduction 3
1.1 Background and Statement of the Problem . . . 3
1.2 Purpose and Significance of the Study . . . 5
1.3 Jam–e ȷam: A System Behavior Analyzer . . . 6
2 Review of the Literature 7 2.1 Syslog Analysis . . . 8
2.2 Users and Systems Privacy . . . 12
2.3 Failure Detection and Prediction . . . 15
2.3.1 Failure Correlation . . . 16
2.3.2 Anomaly Detection . . . 16
2.3.3 Prediction Methods . . . 19
2.3.4 Prediction Accuracy and Lead Time . . . 22
3 Data Collection and Preparation 25 3.1 Taurus HPC Cluster . . . 26
3.2 Monitoring Data . . . 32
3.2.1 Data Collection . . . 32
3.2.2 Taurus System Log Dataset . . . 35
3.3 Data Preparation . . . 36
3.3.1 Users and Systems Privacy . . . 37
3.3.2 Storage and Size Reduction . . . 44
3.3.3 Automation and Improvements . . . 46
3.3.4 Data Discretization and Noise Mitigation . . . 48
3.3.5 Cleansed Taurus System Log Dataset . . . 50
3.4 Marking Potential Failures . . . 51
4 Failure Prediction 61 4.1 Null Hypothesis . . . 62 4.2 Failure Correlation . . . 65 4.2.1 Node Vicinities . . . 66 4.2.2 Impact of Vicinities . . . 69 4.3 Anomaly Detection . . . 70
4.3.1 Statistical Analysis (frequency) . . . 72
4.3.2 Pattern Detection (order) . . . 74
4.4 Adaptive resilience . . . 83
5 Results 84 5.1 Taurus System Logs . . . 85
5.2 System-wide Failure Patterns . . . 89
5.3 Failure Correlations . . . 90
5.4 Taurus Failures Statistics . . . 92
5.5 Jam-e JamPrototype . . . 97
5.6 Summary and Discussion . . . 99
6 Conclusion and Future Works 105
Bibliography 108
List of Figures 131
List of Tables 133
Appendix A Neural Network Models 137
Appendix B External Tools 143
Appendix C Structure of Failure Metadata Databse 145
Appendix D Reproducibility 147
Appendix E Publicly Available HPC Monitoring Datasets 149
Appendix F Glossary 152
1 Introduction
The increasing demand for higher computation power, leads to production of more complex computing units. According to Moore’s Law [1], the number of transistors per square centimeter on integrated circuits are doubled every two years thus, the computa-tional performance. The Moore’s Law holds true since 1965, and it is expected to remain valid in near future1. However, despite the higher computation power of complex
comput-ing units, this complexity contributes to instability and error proneness of components as well as the entire computing system.
On a higher granularity, failure rate in high performance computing (HPC) systems rapidly increases due to the growth in system size and complexity. Hence, failures became the norm rather than the exception [2, 3, 4, 5, 6]. The efficiency of failure recovery mech-anisms, e.g., checkpoint-restart, is highly dependent on the mean time between failure (MTBF). With the arrival of Exascale computers in the near future [7], the MTBF of HPC sys-tems is expected to become too short, and that current failure recovery mechanisms will no longer be able to efficiently protect the systems against failures [8, 9, 10, 11, 12, 13].
Early failure detection is a new class of failure recovery methods which is in particular beneficial for large computing systems with short MTBF [14, 15]. Detecting failures in their early stage can reduce their negative effects via barricading their propagation [16]. This work provides a prototype to analyze and predict system behavior. The behavioral analysis is then used to detect node-level failures as early as possible which paves the way toward resilience in Exascale high performance computing.
1.1 Background and Statement of the Problem
Although the distribution, origin, and cause of failures have changed throughout the years, addressing failures remained an important challenge in computing systems [17, 18]. Reliability of computing systems is becoming more and more important as the demand for higher computing performance is increasing. To fulfill the performance requirements of new algorithms and software, the computing units became complex and dense. Further-more, additional computing units are employed by HPC systems. High complexity and den-sity of computing units and higher number of components in computing systems, as well as aggressive power management approaches such as dynamic frequency scaling (CPU throttling) highly contribute to HPC systems error proneness [19].
Various approaches are proposed to address failures in HPC systems. Regardless of the system layer of application, existing general-purpose approaches can be categorized
1Although the transistors may not shrink their size anymore, the computational performance tends to double
in three main categories of: (1) checkpointing, (2) replication, and (3) failure prediction2.
The first two categories (checkpointing and replication) are currently de facto approaches to address failures in production HPC systems. Although these categories are shown sepa-rately, in most cases an integrated approach consisting both checkpointing and replication is being used [20].
Statistics indicate a persistent number of critical failures in major production HPC sys-tems. Table 2.1 on page 8 summarizes the failure statistics of various HPC systems over the course of 37 years (1948-2020). Hardware unreliability is one of the main sources of system failures in both industrial and commodity hardware [21, 22, 23]. The failure rate of commodity components in most computing systems can be described using the Bath-tub Curve [24] hazard function shown in Figure 1.1 [25]. Furthermore, the same relation is observed between failure rate and the system up-time. In Chapter 4 the bathtub curve concept is used to adjust the anomaly detection method.
Time
Failure Rate
Early life
Failures Random Failures
End of life Failures
Figure 1.1: TheBathtub Curvehazard function
Exascale HPC systems are expected to arrive by 2020 [7]. Current failure statistics in-dicate the dire need of failure mitigation mechanisms in Exascale systems. In various researches the MTBF is projected to be in the range of seconds and minutes instead of days3[2, 3, 27, 28, 29, 30, 31, 32].
Considering the short mean time to interrupt (MTTI) and the large size of Exascale HPC systems, none of the existing approaches in their current form may remain beneficial to address failures in the future. The checkpointing mechanisms require a certain amount of time to generate snapshots of the current system status (TCheckpoint) and to restore the snapshot after each failure (TRestore)4. Decreasing the MTTI to less thatTCheckpointorTRestore prevents further progress of applications. Full replication of the system status is also not cost-effective regarding the large size of the future Exascale HPC systems. Additional chal-lenges such as consistency, synchronization, and network congestion which are side effects of checkpointing and replication approaches may in turn introduce additional failures in HPC systems.
2This categorization considers general purpose approaches and does not include domain-specific and
special-purpose methods such as algorithm-based fault tolerance (ABFT).
3Exponential distribution is often used to predict the time interval until future events (failure). This
distri-bution predicts the time until the first failure. Gamma distridistri-bution, on the other hand, predicts the time
interval until the ithfailure occurrence. Weibull, Gamma, and Pearson6 are the best-fit distributions for the
MTBF [26].
It is important to note that most failure statistics shown in Table 2.1 belong to HPC sys-tems that operate in highly controlled environments. These HPC syssys-tems enforce strict usage regulations and are under constant monitoring and maintenance by administration personnel which regardless of the high imposed expenses, greatly contribute to systems reliability. The aim is to fully automate the system monitoring and optimize the mainte-nance periods according to systems behavior, and yet preserve the systems functionality.
1.2 Purpose and Significance of the Study
Operational HPC systems are facing failures on a daily basis, regardless of their size and application. Failures in HPC systems are often correlated. In many cases these cor-relations cause a failure chain5 to form. Regular maintenance as well as hardware and
software upgrades constantly change the system’s behavior. Analyzing and predicting the system behavior can effectively improve the HPC systems uptime, and reduce penalties imposed by regular failures6. Furthermore, automatic monitoring of the system reduces
the maintenance costs and increases the system’s functionality. The arrival of Exascale HPC systems with their massive number of components further reveals the importance of failure prediction for current and future computing systems.
This work provides a prototype to analyze and predict system behavior in order to de-tect node-level failures as early as possible. The proposed approach respects the users and system’s privacy and is applicable on operational HPC systems without further mod-ifications. Behavioral analysis enables the system to consider protective measures such as checkpointing, redundancy, and migration in useful time to stabilize the systems status and prevent further damages. Due to the large size of computing systems and the high vol-ume of monitoring data, the proposed approach performs the main tasks fully automatic or with minimum interactions.
It is important to emphasis that this work does not intend to introduce a replacement for de facto failure protection mechanisms. Instead, this work provides a prototype to analyze and predict systems behavior, to improve the functionality of available mechanisms. In an-other word, this work proposes an adaptive resilience approach that employs appropriate protective measures according to the system’s behavior.
The results of this work contribute to answer questions including the followings: Are the failures in HPC systems predictable? Which failures can be detected or predicted? Is it possible to provide a general behavioral analysis method? How to expand this approach to protect the Exascale computing systems? Which monitoring data has the required infor-mation for behavioral analysis? How to comply with data protection regulations (GDPR)? How to process and store the monitoring data for longer periods?
5Series of correlated failures (Section 3.1).
1.3
Jam–e ȷam
: A System Behavior Analyzer
This work introducesȷam–e ȷam7, a prototype to analyze and predict system behavior to
detect node-level failures as early as possible, in order to employ appropriate protective measures in useful time. The system log (syslog) entries are chosen as the main source of monitoring data in this work, due to their availability and information richness. A com-prehensive anonymization technique is proposed to address privacy concerns raised by syslog analysis. The proposed approach is applicable to HPC systems without any fur-ther modifications. To provide an automatic approach suitable for extremely large HPC systems,ȷam–e ȷam utilizes statistical analysis and failure correlations among nodes with
similar characteristics (node vicinity) to detect abnormal behaviors and predict upcoming node failures.
Figure 1.2 illustrates an example of system behavior analysis performed on Taurus. Timely detection ofanomaliescould have reduced the damages caused by failures via activating
the protection mechanisms before the occurrence of thefailure.
Steps
(each dot stands for a single syslog entry, in chronological order)
Ev
en
ts
(each ro w indi ca tes a di ff er en t type of e ven ts ) Anomalies Failure(at this point node crashed)
Normal behavior
Figure 1.2: The time interval between detection of an anomaly and occurrence of the sub-sequent failure (golden interval). The goal is to react during the golden interval to reduce the damages caused by failures via timely activation of the failure re-covery mechanisms.
Jam–e ȷam’s approach can be likened to the function of smoke detectors in buildings. The
smoke detectors activate protection mechanisms upon detection of smoke (the anomaly) to reduce the damages of a potential fire (the failure).
Although the behavior analysis in this work is aimed for early detection of node-level fail-ures, the proposed mechanism can be used to detect other anomalies too. Furthermore, syslog entries, that are used as the main monitoring data in this work, can be replaced with any other data source as long as it provides required information relevant to the granular-ity of the expected anomalies.
The remainder of this work is structured as follows. Chapter 2 provides a review of the literature. Details of the data collection and preparation process are provided in Chapter 3. The methods are described in Chapter 4 and the major findings are explained in Chapter 5. Chapter 6 concludes the work and specifies the important future work directions.
2 Review of the Literature
With drastic increase in the number of HPC system components, it is expected to ob-serve a sudden increase in the number of failures, which consequently poses a threat to the continuous operation of the HPC systems. Current statistics show a persistent number of critical failures in major production HPC systems. Hardware failures are responsible for the majority of long-lasting down times in computing systems. As an example, the root causes of network failures in data centers are shown in Figure 2.1.
Figure 2.1: Root causes of network failures in data centers [33]. Failures are defined as any unsuccessful link in the network. HW and SW stand for hardware and software respectively.
Table 2.1 summarizes 37 years of HPC systems failure statistics. The inconsistency of failure assessments and the heterogeneity of HPC systems shown in Table 2.1 make it dif-ficult to perform a one-to-one comparison. However, it can be concluded that failures are integral part of HPC systems. Therefore, failures must be addressed in order to guarantee efficient progress of computations on HPC systems. The studies summarized in Table 2.1 conclude that large scale regular failures are mostly caused by file systems however, the main cause of failures is hardware. The resiliency in HPC systems plays a vital role in com-parison to other computing systems due to the complexity of workflows, applications and the requirements of HPC systems. However, similar techniques can be applied on all types of computing systems.
In summary, failures became an integral part of computing systems. Although, despite imposing excessive overheads, existing failure recovery mechanisms such as checkpointing-restart and redundancy are still useful for current HPC systems, it is predicted that future HPC systems will not be able to perform efficient forward progress while running large ap-plications due to their ever reducing MTBF. To ensure the aliveness of HPC systems in the existence of failures, additional protective measures must be taken.
Table 2.1: High performance computing systems failure statistics from 1984 to 2020
Date Environment Observation
1984-1986 IBM Mainframe [34] 456 failures 1988-1990 Tandem [35, 36] 800 failures
1990 VAX [37] 364 failures
1989-1990 VICE [38] 300 failures 1999 70 Windows NT nodes [39] 1100 failures 1999 503 nodes [40] 2127 failures 2003 3000 nodes [41] 501 failures 2003-2004 395 nodes [42] 1285 failures 2004-2005 Liberty [43] 7.8 alerts per day 2005-2006 Blue Gene/L [43] 1,620 alerts per day 2005-2006 Thunderbird [43] 13,312 alerts per day 2006 Red Storm [43] 16,016 alerts per day 2005-2007 Spirit (ICC2) [43] 309,707 alerts per day 2007 BlueGene/L Coastal [44] MTBF 7-10 days
2007-2009 Unknown [45] MTBF 3-37 minutes 2005-2010 CENIC [46] 16-302 failures per link 2008-2010 Jaguar [47] 2.33 failures per day 2008-2011 Jaguar XT4 [18] MTBF 36.91 hours 2008-2011 Jaguar XT5 [18] MTBF 22.67 hours 2008-2011 Jaguar XK6 [18] MTBF 8.93 hours 2012-2013 K Computer [48] Failures rate 1.6% 2013 Blue Waters [49] MTBF 4.2 hours
2014 Titan [50] 317 HW and 270 SW failures 2014 Titan [51] 9 failures per day
2013-2015 EOS XC 30 [18] MTBF 189.04 hours 2013-2015 Titan XK7 [18] MTBF 14.51 hours 2015 BlueGene/Q Mira [52] MTBF 5.5 hours 2015 Petascale systems [53] MTBF 7-10 hours 2015 Cielo [54, 55] MTBF 24 hours 2011-2017 Facebook network [56] MTBF 1.8 months 2016-2017 Beocat [57] 10% job failure 2017 Argonne FUSION [58] MTBF 3-52 minutes
2013-2018 IBM Blue Gene/Q Mira [5] MTBF 1.3 days (99,245 job failure) 2014-2018 Titan [59] MTBF few minutes
2015-2018 Titan [60] 164,593 alerts per day 2020 TaihuLight [61] MTBF relatively short 2020 Summit [62] MTBF several hours
2.1 Syslog Analysis
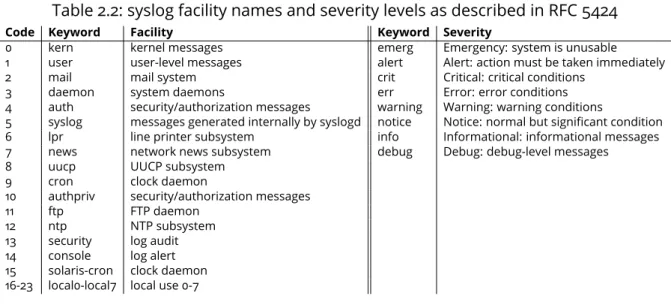
Syslog was developed in the 1980s and since then became the de facto standard for logging systems activities. RFC 3164 [63] first documented the details of the syslog protocol, and later RFC 5424 [64] standardized it. All data fields in syslog entries are structured, except the message field, which contains free-form text. Each syslog entry begins with a
PRIVAL (priority value) that represents the severity and the facility(origin) of the
message. The PRIVAL is calculated by multiplying the facility number by 8 and adding the severity value to it. Table 2.2 provides an overview of syslog de facto facility codes and severity levels used in Unix-like operating systems.
Table 2.2: syslog facility names and severity levels as described in RFC 5424
Code Keyword Facility Keyword Severity
0 kern kernel messages emerg Emergency: system is unusable
1 user user-level messages alert Alert: action must be taken immediately
2 mail mail system crit Critical: critical conditions
3 daemon system daemons err Error: error conditions
4 auth security/authorization messages warning Warning: warning conditions
5 syslog messages generated internally by syslogd notice Notice: normal but significant condition
6 lpr line printer subsystem info Informational: informational messages
7 news network news subsystem debug Debug: debug-level messages
8 uucp UUCP subsystem
9 cron clock daemon
10 authpriv security/authorization messages
11 ftp FTP daemon
12 ntp NTP subsystem
13 security log audit
14 console log alert
15 solaris-cron clock daemon
16-23 local0-local7 local use 0-7
Due to the simplicity of the syslog protocol and its usefulness, wide range of computing systems generate their system logs according to the syslog protocol. The information rich-ness of syslog entries and the availability of syslogs on various computing systems made them a good candidate for systems monitoring. Apart from the operating systems and system-level services, the majority of the commodity applications also report their exe-cution status in detail through log generation. On average, between 1% and 5% of the software source code is dedicated to log generation [65].
Various studies utilize syslog entries for behavioral analysis and anomaly detection. There are available platforms such as Elastic Stack [66], CloudSeer [67], and LogSCAN [68] which provide comprehensive analytics toolkit for administrators in order to have a better accessibility to system logs.
Parsing the syslog entries is a challenging task due to the existence of free-form text within the message part of the syslog entries. Even though that the syslog entries produced by each software are generated via predefined message templates, these templates are not uniform across various software. Furthermore, the large number of variables used in message templates contributes to the complexity of the pattern detection, e.g., theUbuntu
operating system reports 70,506 variables in its log entries andOpensshreports 3,290
vari-ables [65]. Therefore, throughout the years various tools and platforms were developed to collect, digest, and analyze the log messages.
Several research projects attempt to automate the parsing of unstructured log mes-sages. Most of the proposed algorithms where exclusively designed for handling system logs. SLCT [69] and LFA [70] algorithms use frequent item set mining to detect similar pat-terns among syslog entries. AEL [71] and LKE [72] use heuristic methods to detect variables. IPLoM [73] utilizes iterative partitioning based on word count. LogSig [74] generates sys-tem events from textual log messages via detecting the most representative message sig-natures. SHISO [75] proposes a structured tree capable of refining log formats in realtime. LogCluster [69] applies hierarchical clustering to cluster system logs. LenMa [76] detects message patterns using the length of words in each message. LogMine [77] employs a
mul-tiple sequence alignment algorithm to group similar log messages. Spell [78] and Drain [79] provide online parsing methods, Spell utilizes a longest common sub-sequence based ap-proach to detect log patterns, while Drain uses a fixed depth parse tree. MoLFI [80] in other hand uses the domain knowledge and performs a reverse search in the space of solutions for a Pareto optimal set of message templates.
Among these algorithms the source code of Drain and LenMa as online log parsers are available. Some other log parsing algorithms are re-implemented in other studies1.
Com-parison of the parsing accuracy of these 13 algorithms on different log datasets is shown in Table 2.3 [81, 82]. Despite the high parsing accuracy on certain software logs such as Apache web server, all algorithms perform poorly on Linux system log (syslog)s which is the main source of monitoring data in this work [83].
Table 2.3: Accuracy of log parsers on different datasets [82]
Dataset SLCT AEL IPLoM LKE LFA LogSig SHISO LogCluster LenMa LogMine Spell Drain MoLFI
HDFS 0.545 0.998 1 1 0.885 0.850 0.998 0.546 0.998 0.851 1 0.998 0.998 Hadoop 0.423 0.538 0.954 0.670 0.900 0.633 0.867 0.563 0.885 0.870 0.778 0.948 0.957 Spark 0.685 0.905 0.920 0.634 0.994 0.544 0.906 0.799 0.884 0.576 0.905 0.920 0.418 Zookeeper 0.726 0.921 0.962 0.438 0.839 0.738 0.660 0.732 0.841 0.688 0.964 0.967 0.839 OpenStack 0.867 0.758 0.871 0.787 0.200 0.200 0.722 0.696 0.743 0.743 0.764 0.733 0.213 BGL 0.573 0.758 0.939 0.128 0.854 0.227 0.711 0.835 0.69 0.723 0.787 0.963 0.960 HPC 0.839 0.903 0.824 0.574 0.817 0.354 0.325 0.788 0.830 0.784 0.654 0.887 0.824 Thunderb. 0.882 0.941 0.663 0.813 0.649 0.694 0.576 0.599 0.943 0.919 0.844 0.955 0.646 Windows 0.697 0.690 0.567 0.990 0.588 0.689 0.701 0.713 0.566 0.993 0.989 0.997 0.406 Linux 0.297 0.673 0.672 0.519 0.279 0.169 0.701 0.629 0.701 0.612 0.605 0.690 0.284 Mac 0.558 0.764 0.673 0.369 0.599 0.478 0.595 0.604 0.698 0.872 0.757 0.787 0.636 Android 0.882 0.682 0.712 0.909 0.616 0.548 0.585 0.798 0.880 0.504 0.919 0.911 0.788 HealthApp 0.331 0.568 0.822 0.592 0.549 0.235 0.397 0.531 0.174 0.684 0.639 0.780 0.440 Apache 0.731 1 1 1 1 0.582 1 0.709 1 1 1 1 1 OpenSSH 0.521 0.538 0.802 0.426 0.501 0.373 0.619 0.426 0.925 0.431 0.554 0.788 0.500 Proxifier 0.518 0.518 0.515 0.495 0.026 0.967 0.517 0.951 0.508 0.517 0.527 0.527 0.013 Average 0.637 0.754 0.777 0.563 0.652 0.482 0.669 0.665 0.721 0.694 0.751 0.865 0.605
Beside research projects, various industrial tools for parsing and analyzing log mes-sages are available. Table 2.4 provides a list of 31 log management and analyzing tools which are capable of analyzing system logs. Other industrial platforms such as AlienVault, BLËSK, Bugfender, Chart.io, GoAccess, jKool, Knowi, Logary, Looker, ManageEngine, Octo-pussy, PagerDuty, Papertrail, Pentaho, Prometheus, Qlik, Retrace, Rocana, ScoutApp, Sen-tine, Sentry, Seq, Sisense, and Tableau are also able to perform basic syslog analysis with the help of additional plugins.
Identifying the variable terms within system logs is a common practice for log pattern extraction before performing log analysis. The goal is to extract of common patterns from similar log messages. Direct extraction of log patterns from software source code provides the highest accuracy [65]. However, in many cases the software source code is not available or accessible. Furthermore, the efficiency of direct pattern extraction from software source code is significantly low due to the inconsistency of log messages generated using various versions of a software. Therefore, log patterns must be re-extracted after each software
Table 2.4: Names and description of31log management and analyzing tool
Tool Name Description by the producer
Alert Logic [84] Collect, aggregate, and search log data Cloudlytics [85] Orchestration for log analysis and monitoring EventSentry [86] Log Monitoring and beyond
EventTracker [87] Monitor, search, alert and report on any log or any format Fluentd [88] Data collector for unified logging layer
Apache Flume [89] Efficiently collecting, aggregating and moving large amounts of log data Graylog [90] Industry leading log management
InTrust [91] Smart and scalable event log management
IPSwitch [92] An automated tool that collects, stores, archives and backs-up Syslog lnav [93] The Log File Navigator
LOGalyze [94] The best way to collect, analyze, report and alert log data LogDNA [95] Instantly centralize, monitor, and analyze logs in real-time Logentries [96] The Fastest Way to Analyze Your Log Data
Loggly [97] Perform log analysis on text based logs Logmatic [98] Log Centralization, Analytics and Visualization LogRhythm [99] Log Management and Log Analysis
Logsign [100] Real-Time Analysis
Logstash [101] Collect, Parse, Transform Logs
LOGStorm [102] Complete log management with powerful correlation technology Logsurfer [103] Monitoring system logs in real-time
Logz.io [104] AI-Powered Log Analysis Loom [105] Predict and Prevent IT incidents Motadata [106] Find Actionable Context in Log Data
Nagios [107] Centralized Log Management, Monitoring and Analysis Software NXLog [108] Log manarement solutions for everyone
OVIS (Baler) [109, 110] HPC data collection, transport, storage, analysis, visualization, and response Scalyr [111] Log management and visibility for modern applications
Splunk [112] Predict and prevent with an AI-powered monitoring and analytics solution Sumo Logic [113] Proactive and predictive
Swatch [114] Monitoring events on a large number of servers andworkstations XpoLog [115] Fully Automated Log Management
update. Alternative approach is the extraction of log patterns through reverse analyzing of collected log messages. This method is used in this work. More details are provided in Section 3.3.
A common approach proposed by several algorithms such as LogSig [74], IPLoM [73], LogCluster [69], LogMine [77], and MoLFI [80] is to convert the syslog entries into system events via multiple passes of clustering and categorization. In several cases, the times-tamps of log entries are discarded as a side effect of such clustering methods, resulting in the elimination of temporal correlations among system logs [116, 65, 117]. Although few approaches preserve the temporal correlations of log entries [118], most of the existing ap-proaches utilize static sets of rules to differentiate among various classes of system logs which negatively affects the accuracy of these approaches in processing of unseen and sophisticated log entries.
The main challenge in all available parsing methods is the analyzing of the unstructured part of syslog messages. Due to the unreliable nature of the syslog protocol, noises and in-consistencies also exist among the collected system log entries. Majority of the existing log parsers require multiple passes of processing which makes them inadequate for real-time
monitoring and analysis of large HPC systems. Due to the unavailability of the original im-plementation of the existing algorithms, most features of the proposed algorithms cannot be evaluated. None of the existing tools are able to automatically analyze unstructured free-form log messages. User privacy remains a great concern since the industrial plat-forms provide the log analyzing process as a remote service, and the log analysis may take place on the third-party servers. Reliance on static rule sets restricts the flexibility of pat-tern detection. Due to the dynamic nature of HPC systems, manual adjustment of rule sets is also not preferred.
2.2 Users and Systems Privacy
Conducting any form of behavior analysis, for the purpose of failure detection and pre-diction, requires in-depth details about the actual state of the computing system. System logs readily contain such information. The usage of an HPC system is regulated by the privacy guidelines in force, according to its functionality, production environment, and ad-ministration domain. Depending on the applicable privacy regulations, certain information within the system logs may be considered as sensitive information. Examples include user-names and IP addresses. Information deemed sensitive on one HPC system can be consid-ered not sensitive to another HPC system. Analyzing and distributing raw system logs, that may contain sensitive information, endangers the privacy of data subjects such as users, system owners, and system vendors. Therefore, data anonymization is requiredbeforethe
analysis and distribution of (raw) system logs. However, due to the uncertainties about the imperfection of the existing anonymization methods, the owners of HPC systems are reluctant to publish their monitoring data [119]. A list of publicly available HPC monitoring data2is shown in Chapter E.
The data protection and privacy guidelines of each computing system mandate the re-moval of certain sensitive information from system logs. Therefore, a certain amount of information loss cannot be prevented during the anonymization phase. After anonymiza-tion, the system logs may have already lost their usefulness for certain types of analyses. For example, the anonymized system logs of a computing system, with a privacy guideline that mandates complete removal of all usernames from system logs before any analysis, are not useful for user accounting purposes.
In March 2014, European Parliament approved the new privacy legislation. According to these regulations,personal datais defined as "any information relating to an identified or
identifiable natural person (‘data subject.’)" [120]. This information must remain private to ensure a person’s privacy. Based on this definition, syslog entries contain numerous terms which represent personal data and must, therefore, be protected.
Encryption and de-identification are the most common approaches to protect personal data in log entries. Encryption reduces the risk of unauthorized access to personal data. However, encryption is reversible. Any form of encryption is theoretically breakable,
pro-2To the best knowledge of author, at the time of writing, these are the only existing large-scale
vided enough time and computational power. The encryption key having to be securely preserved yet also shared in order to make further analysis possible. Therefore, encryp-tion can only be used within a trusted environment and the encrypted syslog entries can-not be freely used or distributed in the public domain. Therefore, log encryption is can-not a suitable approach for analyzing and distributing system logs. In contrast, de-identification eliminates the sensitive data and only preserves the nonsensitive (cleansed) data. As such, de-identification provides the possibility of distributing de-identified data in the public do-main. However, due to the potential excessive information loss, the de-identified data may turn out to no longer be of real use.
Pseudonymization and anonymization are two different forms of de-identification. In pseudonymization, the sensitive terms are replaced by dummy values to minimize the risk of disclosure of the data subjectidentity. Nevertheless, with pseudonymization the data
subjectcan potentially be re-identified using supplementary information [121].
Anonymiza-tion, in contrast, refers to protecting user privacy via irreversible de-identification of per-sonal data.
Generalization and suppression are two well-known methods for data anonymization. These methods either group or remove data to reduce uniqueness, and thus, the chance of identification of individual data subjects from the records in the dataset. In 2002 k -anonymity [121] was introduced as a model for protecting privacy via generalization. Al-thoughk-anonymity addressed the main challenge of data privacy in anonymized datasets, it had several shortcomings such as attribute disclosure, and complementary data release. To overcome these shortcomings, several models such asl-diversity [122] andt-closeness [123] were introduced. These models reduced the data representation granularity (grouping) be-yond the level used ink-anonymity, which could result in decreased data usefulness. The l-diversity models are also potentially vulnerable to algorithm-based attacks. Some studies considered an integration of both, thel-diversity andt-closeness models [124]. In 2006 the formal principle of differential privacy was introduced [125]. The differential privacy prin-ciple addresses the vulnerability to algorithm-based attacks and provides a strong privacy model. However, identifying a good strategy to implement differential privacy is difficult, it further decreases the data utility, imposes high overhead, and cannot be automated. According to the articles 2, 4(1) and (5) and recitals (14), (15), (26), (27), (29) and (30) of the GDPR3, in order to analyze sensitive information, an irreversible anonymization of personal
data must be guaranteed [126]. To the best knowledge of the author, no existing model can guarantee the data privacy and provide useful data.
Various tools have been developed to address the privacy concerns of using syslog in-formation. Most of these tools provide log encryption as the main feature, while certain tools also provide de-identification as an additional feature. Syslog-ng and Rsyslog are two open-source centralized logging infrastructures that provideout of the boxencryption
and message secrecy for syslogs, as well as de-identification of syslog entries [127, 128]. Both tools provide apattern databasefeature, which can identify and rewrite personal data
based on pre-defined text patterns. Logstash [129] is another open-source and reliable
tool to parse, unify, and interpret syslog entries. Logstash provides a text filtering engine which can search for the text patterns in live streams of syslog entries and replace them with predefined strings [130]. In addition to the off-line tools (local installation), such as syslog-ng and Logstash, there is a growing number of online tools (remote services) such as Loggy [131], Logsign [100], and Scalyr [111], that offer a comprehensive package of syslog analysis services. The existence of sensitive data in the system logs barricades the usage of such remote services.
Alongside these industrial-oriented tools, several research groups have developed scientific-oriented toolkits to address the syslog anonymization challenge. eCPC toolkit [132], sd-cMicro [133], TIAMAT [134], ANON [135], UTD Anonymization Toolbox [136], and Cornell Anonymization Toolkit [137] are selected examples of such toolkits. These tools apply var-ious forms ofk-anonymity [121] andl-diversity [122] to ensure data anonymization.
Achiev-ing an optimal k-anonymity is an NP-hard problem [138]. Heuristic methods, such as
k-Optimize, can provide effective results at the cost of a longer time [139].
The process of data anonymization incurs a certain degree of information loss. With significant information loss comes decreased usefulness of the anonymized data. Vari-ous studies attempted to address the problem of achievingk-anonymity protection with minimal information loss. Gionis and Tassa proved that solving the problem for the two conflicting goals above is NP-hard [140]. Later, it has been shown that dynamic optimiza-tion of the anonymizaoptimiza-tion process considerably reduces the loss of informaoptimiza-tion [141]. In another attempt to address the high information loss during data anonymization,
utility-based anonymizationmethods were proposed. Xu et al. [142] introduced an approach which
first, specifies the utility of each attribute, and second, proposes two heuristiclocal record-ing-based anonymization methods [143] to boost the quality of the analysis later. Adata
re-locationmechanism has also been applied to reduce granularity and populate small groups
of tuples to increase data usefulness [144]. In another similar effort, quasi-identifiers have been divided into two groups of ordered and unordered attributes [145]. To reduce the information loss, more flexible strategies for data generalization have been applied on the unordered attributes. More recently, co-utility [146] has been introduced as a global
dis-tributed mechanism for data anonymization, such that a balance between data utility and data privacy is achieved. Although these efforts decrease the information loss during data anonymization, they still cannot guarantee data privacy. The non-zero probability of pri-vacy breaches through anonymization by the use of approaches such as those mentioned in this section has been experimentally determined [147].
Quantifying data utility4, which is a qualitative property of data, provides a measure to
control the balance between privacy and utility of data. A number of studies proposed such measures to quantify the utility of anonymized data. Data utility is mostly described as the amount of information loss. Information loss, in general, can be quantified according to the uncertain change in attribute values during the anonymization [145], via result-driven approaches to compare the data before and after anonymization [148], or even according to the data entropy in the dataset [149]. These measures are generally divided into two
egories: (1)entropy-basedand (2)distance-based(e.g., the Hellinger distance). Furthermore,
most of the above mentioned usefulness quantification approaches are implemented into data anonymization tools, such as ARX [150].
Existing approaches for quantification of data usefulness aim to increase data privacy, data utility, or both, in anonymized datasets. However, these approaches implicitly make the fundamental assumption of having a structured format for the data entries. In reality, system log entries are of mixedstructuredandunstructured data formats. The structured
part contains the meta-data (e.g., time or location related to the particular syslog entry), and the unstructured part contains the detailed event information. Sensitive information mainly resides within the unstructured part of the data. In the author’s best knowledge, due to the unstructured nature of the detailed event information (no two distinct events generate the same information pattern), none of the existing approaches provide utility-based anonymization of system logs. Moreover, although a few studies addressed the de-identification of unstructured datasets [151], none of these studies, nor the known privacy models guarantee data privacy at an acceptable overhead (time and complexity).
Using the existing anonymization approaches, in general: (1) The quality of the anonymized data dramatically degrades, and (2) The size of the anonymized syslogs remains almost unchanged. The industrial-oriented approaches are unable to attain full anonymization at micro-data level [121]. Even though scientific-oriented approaches can guarantee a high level of anonymization, they are mainly not capable of applying effective anonymization in an online manner. Certain scientific-oriented methods, which can effectively anonymize online streams of syslogs, need to manipulate log entries at their origin [152, 153].
The data application is not considered in existing methods of data usefulness assess-ment. Although data may lose its usefulness for certain analysis, it may remain useful for other applications. Therefore, it is important to assess the data usefulness in respect to the data application. While the anonymization methods try to uniform the data variance in order to protect users privacy, anomaly detection techniques on the other hand require those differences in input data to detect anomalies. Thus,useful datafrom this perspective
must project a balance between variation and uniformity.
2.3 Failure Detection and Prediction
When defects within the system’s components (fault) are triggered (error), they might prevent system’s components to perform their expected functionalities, thus cause failure. Although failures are run-time events, failure prediction can be performed using both on-line and offline approaches. Offline failure prediction approaches employ the knowledge gained during previous executions to predict the probability of future failure occurrences. Due to the static nature of offline prediction approaches and their reliance on historic data, dynamic behaviors cannot be predicted using offline approaches. Online failure predic-tion approaches consider run-time informapredic-tion beside the historic execupredic-tions’ knowledge to predict the probability of future failure occurrences [154]. Given the dynamic nature of general-purpose HPC systems, online approaches are more suitable for failure prediction.
During the past decade, multiple studies investigated the existing failure detection and prediction methods in the context of HPC [155, 156, 157, 158]. This sub-section, along with an overview of existing literature, fills the gap via investigating failure prediction methods that are based on log processing and are not covered in the existing studies.
2.3.1 Failure Correlation
Studies have shown different forms of correlations among failures in large computing systems [159, 68, 160]. In most cases, these correlations proved to be beneficial for syslog analysis. It is expected to observe similarities among the footprints of correlated failures in system logs. These similarities are captured and utilized to detect correlated failures. Two groups of correlations exist: static (i.e., permanent) and dynamic (i.e., temporary) [161, 162, 163, 164].
Majority of correlations are static correlations that are part of the system characteristics and will remain unchanged during the lifetime of the computing system. Simultaneous failure of multiple computing nodes located in a single rack caused by malfunctioning of the rack’s cooling system is an example of static (spatial) correlation among failures. Dynamic correlations are mainly appearing due to the dynamic assignment of shared resources and user interactions. The simultaneous failure of multiple computing nodes that are accessing a certain file on an unstable distributed file system is an example of a dynamic failure correlation.
2.3.2 Anomaly Detection
Anomaly detection is the main building block of failure detection mechanisms. The goal of anomaly detection is detecting irregularities in normal behavior. To achieve this goal, (1) thenormalbehavior and (2) the acceptable deviation threshold from this norm should
be defined. Any deviation more than the acceptable threshold is considered abnormal
behavior. Since the behavior of computing systems is constantly changing in response to their users and environment, static models are not sufficient to describe the dynamic behavior of modern HPC systems. Therefore, the model that describes the normal system’s behavior should be constantly updated according to the new behavior of the computing system.
Various methods are proposed to extract the behavioral patterns of computing sys-tems. Estimating probability of upcoming failures based on system’s load [34, 42], calcu-lating failure frequency via word counting, using time series analysis, generating hidden Markov models [165], anomaly detection via predefined rule-sets [103], automatic pattern mining [166], various forms of clustering [167], and decision trees [168] are examples of ma-jor anomaly detection methods. Furthermore, several studies suggested to form blocks of correlated syslog entries using the semantic correlation among system logs before further analysis [169, 116]. Directed acyclic graphs (DAG) have been also used in anomaly detection methods to preserve the correlation of log entries [170].
However, system logs are not the only monitoring data which are used for detecting anomalies in computing systems. CASPER [171] monitors the network activities, TIRESIAS [172] observes CPU, memory, and context switches, SEAD [173] monitors the hypervisor, and ALERT [174] collects various metrics including CPU load, memory usage, input/output data rate and buffer queue length (more information in Table 2.7). This section briefly introduces the 3 most used methods of anomaly detection that are based on system log analysis.
Time Series Analysis
System logs by default are discrete series of timestamped events. Therefore, they can be best described using time series. Time series analysis are mainly focused on detecting auto-correlations, trends or seasonal variations among the input data.
The first steps in time series analysis is data discretization and assignment of an alpha-bet according to the potential input values. Assuming that the number of syslog entries received during a 5-minute time window is a value between0and1000depending on the
computing system’s condition, the alphabet Σ can be defined as Σ = a, b, c, d such that a={0 : 0},b={1 : 10},c={11 : 100}andd={101 : 1000}. According to the newly defined alphabet, the set of syslog records R = {10,34,0,512,23,12} which is collected during a 30-minute interval (5-minute time window) can be written asR ={b, c, a, d, c, c}, or simply
R= ”bcadcc”.
Using time series, 3 types of periodicity can be defined: (a) symbol periodicity: when one symbol repeats periodically e.g.,ain”abcaeeabeabdacea”, (b) partial periodicity: when a
pat-tern consists of more than one symbol repeats periodically e.g.,abcin”abcaeedabcbeababcd”,
and (3) full periodicity: when the time series is mostly represented by a periodic pattern e.g.,abdcin”abdcabdcabdc”.
The definition of alphabet has a significant impact on the results of time series analysis. Assigning a symbol to a range of values eliminates potential noises in data, and improves the consistency of results. However, the semantic of values must be considered in choosing the value ranges. An uninformed assignment may hide anomalies via an unintentional flattening of the outliers.
Suffix trees and suffix arrays are powerful data structures for analyzing time series [175, 176]. Suffix trees can be generated in linear time [177]. A bottom-up traverse of suffix tree results in generation of theoccurrence vector. Occurrence vectors are common data
structures to store the position of repetitive patterns in time series. The sorted list of all suffixes of a string, forms the suffix array of that string. Suffix arrays proved to be extremely efficient data structures for anomaly detection in very large time series [178].
Pattern and Rule Mining
Pattern mining is a powerful tool to discover sequential and periodic recurring patterns in various sequences (e.g., time series). In Table 2.5a, 5 sequences of events have been
4, since it has been repeated in 4 sequences. Significant changes of the recurring patterns’ support value during fixed-size time windows can be an indication of abnormal behavior.
Main drawback of this approach is the lack of probability assessment. Therefore, it is not known how plausible is the re-occurrence of an upcoming event. For example in Table 2.5a, it is indicated that the <b,c,g> sequence is recurring with a support value of 4. However, it is not known that this sequence has a re-occurrence probability of 80% (4 out of 5 sequences; the order of appearance is not considered).
(a) Pattern mining Name Sequence Sq1 <a,b,c,d,e,e,g,h> Sq2 <f,b,e,g,c,f,g,b> Sq3 <g,b,f,d,h,g,b,a> Sq4 <b,c,a,a,d,f,g,a> Sq5 <b,a,c,e,f,h,c,g> (b) Rule mining Name Sequence Sq1 <a,d,c,d,e,e,g,h> Sq2 <f,b,e,g,c,f,g,a> Sq3 <g,b,f,d,h,g,b,a> Sq4 <b,c,a,a,d,f,g,a> Sq5 <a,b,c,e,f,h,c,g> Table 2.5: Examples of pattern and rule mining in sequences
Various algorithms such as PrefixSpan (2004), LAPIN (2005), CM-SPADE (2014), VMSP (2014), CM-SPAM, FCloSM, FGenSM, Spade, SPAM and GSP have been introduced for pat-tern mining. However, the lack of probability assessment is one of the main limitations to use these algorithms in failure prediction.
To overcome this limitation, therule mininghas been introduced. A (sequential)ruleis
defined asA => B, where bothA and B are itemsets. The A => B rule is interpreted as if items in itemsetA occur, then they will be followed by the items in itemset B. The items withinA andB can occur in any order, but it is required that the items of B occur only after items ofA. Considering Table 2.5b as sets of sequences and{b}=>{a, f}as the sequential rule, it can be concluded that the support of sequential rule{b} =>{a, f}is 3. Since, in 3 sequences the eventsaandf are occurring after eventb.
To calculate the probability of a sequential rule, another measure called confidence will be considered. Confidence of the ruleA => B is the support of the rule divided by the number of sequences containing the items ofA. In the given example, since in 4 out of 5 sequences{b}occurs but only in 3 of them it is followed by{a, f}therefore, the confidence of rule{b}=>{a, f}is75%.
Various algorithms such as CMRules (2010), TopSeqRules (2011), RuleGrowth (2011), TNS (2013), ERMiner (2014), TRuleGrowth, PFP-Tree, HUSRM, MKTPP, ITL-Tree, PF-tree and Max-CPF are proposed for sequential and periodic rule mining. Studies show that rule mining provides higher detection accuracy than pattern mining [179].
Machine Learning
From another perspective, anomaly detection methods are divided into three main cate-gories of rule-based, supervised, and unsupervised [180]. Although many rule-based meth-ods have been proposed, the unstructured nature of syslog messages extremely limits the functionalities and the detection domain of rule-based approaches. Supervised methods
on the other hand require both normal and abnormal patterns to train a functional behav-ioral classifier. Therefore, rule-based approaches as well as supervised approaches are not able to detect anomalies which are not seen before. Furthermore, extraction of rules and patterns for rule-based and supervised approaches are time-consuming and inaccurate, respectively [181].
In contrast, unsupervised approaches are able to automatically extract the system’s behavioral pattern from the monitoring data. However, most of the unsupervised ap-proaches and available tools are domain specific. They are built specifically for a certain class of problems e.g., security threads detection [182], DNS poisoning attacks identifica-tion [183], or performance bottleneck detecidentifica-tion [184]. Furthermore, general approaches such as invariant log mining [185] and principal component analysis (PCA) [186] only con-sider the chronological order of the events, discarding the temporal correlation among log entries.
Unsupervised syslog-based anomaly detection methods were further improved via re-cent advances in machine learning techniques [118, 166, 187, 188]. Despite the rapid im-provements in performance and accuracy of unsupervised anomaly detection approaches using machine learning, certain challenges remained unsolved. As the volume of generated system logs on HPC systems is rapidly increasing, the storage and processing of syslog en-tries becomes challenging. Due to the diversity of HPC systems characteristics, in contrast to many use cases of machine learning, reuse of pre-trained models for anomaly detec-tion in HPC systems is not an effective alternative. Processing system logs that contain various personal data, raises serious concerns regarding users privacy. Due to the compo-nents’ heterogeneity in modern HPC systems, each component projects a different behav-ior which cannot be accurately modeled via a single system-wide general model. Software and hardware updates, various applications and the multi-user environment of HPC sys-tems, continuously change the system’s behavior. Therefore, a static behavioral model of the HPC system is not sufficient to accurately model the dynamic behavior of modern HPC systems. In addition, system logs are generated by individual computing nodes, thus, any failure directly affects syslog entries via introducing noises, interrupting log generation mechanisms, or impeding the log collection procedure. Furthermore, harmless errors that are not causing failures may also introduce noises in syslog entries.
2.3.3 Prediction Methods
Salfner et al. [155] divide the procedure of failure prediction into 5 steps of (1) testing, (2) auditing, (3) monitoring, (4) reporting and (5) tracking. Figure 2.2 shows 3 main steps that are performed by most online failure prediction mechanisms. In a recent study, Jauk et al. classified more than 30 existing prediction methods. Table 2.6 shows the two-dimensional classification of prediction methods as originally proposed in [158].
Online failure prediction Failure tracking Probability distribution estimation Bayesian prediction Non-parametric methods Co-occurrence Symptom monitoring Function approximation Stochastic models Regression Machine learning Classifiers Bayesian classifiers Fuzzy classifiers Other approaches System models Instance models Clustered instance models Stochastic models Graph models Time series analysis Regression Feature analysis Time series prediction Detected error reporting Rule-based approaches Co-occurrence Pattern recognition Statistical tests Classifiers
Figure 2.2: A taxonomy for online failure prediction approaches [155]
Failure tracking
Failure tracking uses the recorded failures of the past to predict potential future failures. The prediction is made either via estimating the probability distribution of failures, or via analyzing the correlation between failures.
Symptom monitoring
Symptoms are side effects of failures which can be directly or indirectly related to the cause of failure. Sudden increase of network traffic or higher CPU consumption are di-rect and indidi-rect side effects of network driver failure, respectively. Constant monitoring of the computing system parameters can reveal the symptoms and help to identify the causing failures. Common methods of symptom detection are: (1) function approximation that compares the actual and the expected output of unknown functions fed with system
Table 2.6: A classification of literature on failure prediction in HPC [158]
Class SW/S Node Disk Mem. Net.
Root Cause unspecified pinpoint-able Log
[189] - / 82 [190] / -[191] 93 / 43 [192] / -[83] 78 / 7569 / 58 88 / 46 [193] 91.2 / 45.8 Correlation Probability [194] 88 / 7577 / 69 81 / 85 [195] / -[196] 80 / 90 [197] 58 / 74 [198] / -[199] 98 / 93 Rule [200] / -[201] 40 / 80 Mathematical, Analytical [202] / -[203] / -[204] * / * [205] 74 / 81 [206] 98 / 91 [207] 94.2 / 85.9 [208] 79.5 / 5095 / 94 [209] 53 / -[210] /
-Decision Trees / Forest
[211] 72 / 87 Regression [212] / -[213] 55* / 80* [214] 66.4 / 59.3 [215] / -[216] * / * * / * Classification [202] / -[217] 93 / 91
Bayesian Network, Markov [218] 82.3 / 85.4
64.8 / 65.2 [215] / -[219] / -Neural Network [206] 89 / -80 / -[220] 90* / 70* Meta-Learning [221] /
-(with precision/recall values in %)
Blue shows ability to predict this type of failure. A : Results for different data sets.
B : Results for different training parameters. C : Results varies greatly with different parameters. D : Paper lists several methods or setups.
* : Many results provided, see reference. - : No numerical result is given.
parameters, (2) classifiers that identify the value of system parameters as normal or ab-normal based on predefined thresholds, (3) system models that build a model according to the normal state of the system and search for significant deviations from this model and (4) time series analysis that detects deviations within the chronological sequence of system parameters.
Detected Error reporting
In contrast to symptom monitoring, that constantly monitors certain system parame-ters to detect potential deviations in their values, this approach only analyzes the detected and reported errors. Undetectable errors are hidden todetected error reporting as an
on-line event-driven approach, thus, certain failures are out of the scope of this prediction method. The reported errors can be compared against a set of predefined rules or pat-terns (rule-based systems and pattern recognition), searched for detecting correlations between reported errors (co-occurrence), statistically compared to previous records (sta-tistical tests) or labeled according to their importance and impact (classifiers).
2.3.4 Prediction Accuracy and Lead Time
Among the available prediction methods, regardless of the chosen failure prediction approach, the final reported assessments are either (1) the location and time of potential future failures (i.e., when a certain node is expected to fail) or (2) continuous reporting of the stability status of computing nodes (i.e., no conclusion is provided). Both formats may include a certainty value that indicates the confidence of assessment. Table 2.7 provides a list of recent failure prediction methods and their respective accuracy and recall values. Each method is evaluated using a different set of input data.
TheP recision,Recall,Accuracy, andF1Scoreare calculated as shown in Figure 2.3. True
positives (TP) indicate failures that are correctly identified. Higher precision value in Ta-ble 2.7 indicates less false positives (FP), that represent normal events that mistakenly identified as failure. Higher recall value indicates less false negatives (FN), that represent failures that remained unidentified5.
FN FP UF TP All events All failures P recision= T P T P +F P Recall= T P T P +F N Accuracy= (T P +T N) (T P +F P +F N+T N) F1Score= 2 P recision.Recall P recision+Recall
Figure 2.3: Calculation of precision and recall values. TP, FP, FN, and TN stand for true posi-tive, false posiposi-tive, false negaposi-tive, and true negative respectively. UF represents the unpredictable failures explained in Section 5.4. Unpredictable failures are subset of false negatives.
5Some studies suggest additional metrics to evaluate the usefulness of prediction methods [15]. However,
in the context of this work, precision, recall, and the F1Score are the most relevant metrics to describe the
Table 2.7 :Failure prediction methods Year Name Method Source of Monitoring Data Based on Syslog Precision Recall F1Score Requires Additional Data Automaticity Privacy 2010 Zheng et al. [201] Genetic Algorithm IBM Blue Gene/P No 10-40% 60-80% 17% -53% RAS, Job No Partial 2011 ELSA/HELO [222] Signal Processing, Offline/Online Clustering IBM Blue Gene/L, Mecury, PNNL, Cray XT4, LANL Yes 90% 50% 64% Event, Outages No Partial 2011 Nakka et al. [205] Decision Tree LANL System 23 No 73% 80% 76% Failure, Usage No Partial 2012 LogMaster [83] Apriori-LIS, Event Correlation Graphs IBM Blue Gene/L, Hadoop Yes 79%-84% 38-70% 51% -76% Event No Partial 2014 Gainaru et al. [223] Signal Processing, Rule Based Blue Waters* Yes 85% 60% 70% Moab, Storage No No 2016 CloudSeer [67] Workflow Graph, DAG, Automaton 5 node test cluster* No 84% + 90% + 86% + OpenStack Events No No 2016 He et al. [157] PCA, Logistic Regression, Decision Tree, and SVM Amazon EC2*, BlueGene/L Yes 50%-98% 61%-67% 54% -79% HDFS No No 2017 DeepLog [118] RNN (LSTM) Cloud-based VM, HDFS, OpenStack, Blue Gene/L Yes 96% + 96% + 96% + Event No No 2017 Hora [224] Bayesian Networks, Architectural Knowledge Netflix* No 41.9% 83.3% 55% System metrics, Event, Fault injection No No 2017 Islam et al. [159] RNN (LSTM) Google cluster No 85% 89% 86% Workload No Partial 2017 Klinkenberg et al. [206] Descriptive Statistics, Supervised ML HPC at RWTH* No 98% 91% 94% System metrics, Power, Fan, Temperatures, Network No No 2018 Desh [225] RNN (LSTM) Cray XC30, XE6, XC40, XC40/XC30 Yes 83% 85% 83% -No No 2018 Zasadzinski [226] Decision Trees, CNN DKRZ Mistral* No 85% 60% 70% Job, Power, Topology, Hardware Yes No 2018 TBP [199] Topic Modeling, Time-Based Phrase Cray systems Yes 98% 83% 89% Job, Console, Power, Topology, Hardware, Network Yes No 2018 Kimura et al. [167] Log Clustering, Text Processing A large production network Yes 68-75% 71-81% 69% -77% -No No 2018 Landauer et al. [227] Log Clustering Web Server, SQL, Reverse proxy* No 61.8% 99.3% 76% Semi-synthetically, Fault injection Yes No 2019 Borghesi et al. [228] Auto-encoders D.A.V.I.D.E. HPC cluster No 88%-96% N/A N/A 166 metrics aggregated each 5-minute Yes No 2019 Frank et al. [15] DNN Mogon I No 99.4% 73% 84% Hardware Sensors (fan RPM and temperature) and Software info No No 2020 Jam-e-Jam Vicinity-based Model, HTM Taurus II Yes 85% 80% 82% -Yes Guaranteed * Data is not publicly available. + Only achievable on structured logs. RNN: Recurrent Neural Network CNN: Convolutional Neural Network DNN: Deep Neural Network LSTM: Long Short-Term Memory HTM: Hierarchical Temporal Memory PCA: Principal Component Analysis DAG: Directed Acyclic Graph
Since each method is evaluated using a different set of input data, it is not possible to directly compare the performance of listed methods solely based on their precision and recall values. For example, DeepLog reports a surprisingly high precision and recall rate of 96% in comparison to Hora with the precision rate of 42%. The main distinction lies in the datasets that were used to evaluate each of these methods. DeepLog uses HDFS, OpenStack and Blue Gene/L logs while Hora analyzes Netflix’s server logs. HDFS dataset contains 11.1 million log messages collected from Amazon EC2 platform, manually labeled by the original domain experts [65]. BGL data contains 4.7 million log messages recorded by the BlueGene/L supercomputer system at Lawrence Livermore National Labs (LLNL), manually labeled by the original domain experts [43]. The HDFS and OpenStack datasets that were used to evaluate DeepLog contain semi-structured log entries. The diversity of log entries is very limited and log entries are directly related to the reported events. On the other hand Netflix’s server logs are more diverse, less structured and the log entries do not directly relate to the reported events, which negatively influence the failure prediction accuracy. Looking at the lower precision of DeepLog in predicting Blue Gene/L failures6
(less structured) reveals the importance of data preparation for failure analysis.
Among the listed methods in Table 2.7 Desh’s input data is the most similar to the data used in this work, unstructured and low level. Although there are similarities between the prediction methods used in this work and Desh, the main difference is the use of a fully unsupervised approach and utilizing fully anonymized monitoring data in this work. The data labeling step (phrase labeling), greatly contributes to the high precision and recall rates of Desh’s predictions.
Useful failure predictors must predict failures as early as possible to provide enough time for protective measures to take place. The current state-of-the-art lead time is be-low 10 minutes [225, 15] (although with the prediction precision of 42%). Recent recov-ery techniques require about 3 minutes lead-time to perform a complete cycle of check-pointing [229].
In summary, detection and analysis of dynamic correlations are more complicated due to constant changes in their characteristics. However, due to their significant influence, it is required to consider the impact of both static and dynamic correlations in failure anal-ysis. The syslogs of real-world production HPC systems contain unstructured, noisy, and erroneous entries. Therefore, a failure predictor should work in the existence of all these imperfections. Modern HPC systems are dynamic and multi-purpose, therefore, any pre-diction model must adapt itself to the dynamic nature of such environments. The large number of syslog entries generated by modern HPC systems as well as the dynamic na-ture of large computing systems, demand automatic analysis approaches. Therefore, su-pervised approaches are not good candidates as long-term solutions.
3 Data Collection and Preparation
Chapter 3 describes the methodology, workflow, and tools which were used and devel-oped in this work to collect and prepare the monitoring data for the next steps. Figure 3.1 illustrates the major building blocks of the proposed approach as well as the workflow of the analysis. To maintain the readability of Figure 3.1, overlapping blocks and flows are not shown. The colored building blocks are covered in this chapter and the white blocks are covered in Chapter 4. Collecting monitoring data Taurus HPC Syslog Job info Admins DB Notifications Marking potential node failures Detecting anomalies in data taurusMETA Extracting significant data features Categorizing node failures Root cause analysis Introducing 3D failure correlations Data
anonymization Automatic log classification Extracting syslog
statistics
Rejecting the null hypothesis Topological analysis Introducing neighborhood homogeneity Majority voting Automatic failure detection Data visualization Statistical analysis Hierarchical temporal memory Machine learning Automatic failure Prediction Providing a prototype to analyze and predict computing systems behavior DNA sequence Time series Clustering Detecting failure chains Noise mitigation
Data Collection and Preparation Blocks Failure Prediction Blocks
Figure 3.1: Major building blocks and the workflow ofȷam–e ȷam. Building blocks shown in
orange are covered in Chapter 3.
This work addresses the system failure, a main challenge of production HPC systems. Due to the nature of HPC systems, as well as their special production environment and conditions, certain assumption and limitation must be considered. Below is a short list of the most important assumptions and limitations which are considered in this work:
• Taurus is used as the main use case in this work (Section 3.1).
• Fault injection tools can be used to evaluate the resilience of HPC systems [119].
How-ever, fault injection tests are intrusive and may interrupt the systems progress [230, 231]. Taurus is a production computing system with a large group of active users. Therefore, this work refrains to use intrusive approaches such as fault injection.
• To propose an approach that is generally applicable to other HPC system, no changes
should be required to be made on the target systems (Section 3.2.1).
• The failure analysis will be conducted at the node-level (Section 3.4).
• To avoid overheads and prevent unwanted side effects on the target system, active
monitoring techniques will be avoided. This limitation becomes vital during nodes instability conditions (Section 3.2.1).
• The source of monitoring data should be available on the majority of HPC systems
(Section 3.2).
• There are only a few publicly available sources of monitoring data (Chapter E). User
privacy is the main challenge to publish such monitoring data. Therefore, data anonymization is required before further analysis (Section 3.3.1).
• The collected monitoring data may have extensive amount of noises. Therefore, data
cleaning is required before further analysis (Section 3.3.4).
• Due to the large size of HPC systems and high volume of monitoring data, a high
degree of automation is required (Section 3.3.3).
• The exact time and count of node failures on Taurus is unknown. Therefore, data
pre-processing for marking the potential failures is required before analysis (Section 3.4).
3.1 Taurus HPC Cluster
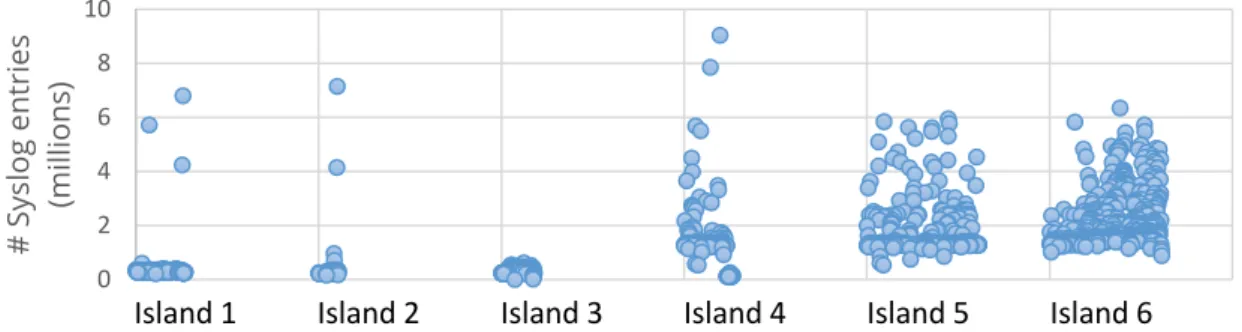
Taurus is a production high performance computing system located in Dresden, Ger-many. Taurus (at the time of writing) consists of2046computing nodes located in6islands.
Taurus monitoring data is the main use case of this work. This section provides detailed information about Taurus’ hardware and software specifications. Additional details, live system status, list of services and future upgrades are accessible via Taurus information page1.
The2046computing nodes on Taurus consist of four different processor architectures:
Intel Haswell, Broadwell, Sandy Bridge, and Westmere. The108nodes with Sandy Bridge
and Haswell processors are also equipped with NVIDIA Tesla GPUs, out of them44nodes
are each equipped with two NVIDIA Tesla K20x, and another64nodes are powered by each
four NVIDIA Tesla K80. 32 additional nodes are equipped with Intel Xeon Phi manycore
processors2 and 14 servers are also equipped with Intel Xeon E5-2603 CPU and NVIDIA
GTX1080 GPU cards.
1https://doc.zih.tu-dresden.de/hpc-wiki/bin/view/Compendium/SystemTaurus
![Table 2.6: A classification of literature on failure prediction in HPC [158]](https://thumb-us.123doks.com/thumbv2/123dok_us/8999552.2797752/25.892.178.721.159.871/table-a-classification-of-literature-failure-prediction-hpc.webp)


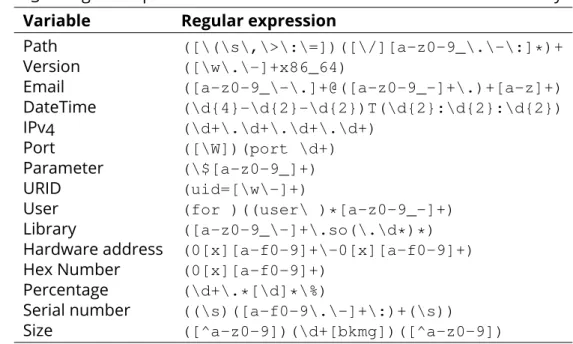
![Figure 3.16: Automatic generation of regular expressions for syslog entries. A variation of Levenshtein similarity metric [249] is used for the classification of log entries.](https://thumb-us.123doks.com/thumbv2/123dok_us/8999552.2797752/51.892.112.791.124.360/figure-automatic-generation-expressions-variation-levenshtein-similarity-classification.webp)