heterogeneous data using Machine Learning
techniques
University of Oulu
Faculty of Information Technology and Electrical Engineering / OASIS
Master’s Thesis Hassan Mehmood 27.03.2019
Abstract
These days, smart cities are focused on improving their services and bringing quality to everyday life, leveraging modern ICT technologies. For this reason, the data from connected IoT devices, environmental sensors, economic platforms, social networking sites, governance systems, and others can be gathered for achieving such goals. The rapid increase in the number of vehicles in major cities of the world has made mobility in urban areas difficult, due to traffic congestion and parking availability issues. Finding a suitable parking space is often influenced by various factors such as weather conditions, traffic flows, and geographical information (markets, hospitals, parks, and others). In this study, a predictive analysis has been performed to estimate the availability of parking spaces using heterogeneous data from Cork County, Ireland. However, accumulating, processing, and analysing the produced data from heterogeneous sources is itself a challenge, due to their diverse nature and different acquisition frequencies. Therefore, a data lake has been proposed in this study to collect, process, analyse, and visualize data from disparate sources. In addition, the proposed platform is used for predicting the available parking spaces using the collected data from heterogeneous sources. The study includes proposed design and implementation details of data lake as well as the developed parking space availability prediction model using machine learning techniques.
Keywords
Big data, Smart cities, machine learning, parking prediction
Supervisors
Piiastiina Tikka Ekaterina Gilman
Foreword
In writing this thesis, I must acknowledge the support and bits of advice I received from my peers and my supervisors. Without constructive criticism and unabated support of D.Sc. (Tech.) Ekaterina Gilman and Dr Piiastiina Tikka, I would not have been able to complete this work in a timely manner. I would also like to thank Mr Lauri Lovén for his continuous guidance. I owe my current and future success to all the people who relentlessly supported my academic and professional development.
I would also like to mention my family members for continuously believing in my abilities, without their support I couldn’t have achieved this milestone.
Hassan Mehmood Oulu, March 27, 2019
Abbreviations
AI Artificial Intelligence
API Application Programming Interface
ARIMA Autoregressive Integrated Moving Average
BRANN Bayesian Regularization Artificial Neural Network
CUTLER Coastal Urban developmenT through the Lenses of Resiliency
CPS Cyber-Physical Systems
CDH Cloudera Distribution including Hadoop
CoAP Constrained Application Protocol
CSV Comma-separated values
DSR Design Science Research
EU European Union
FNN Feedforward Neural Network
GUI Graphical User Interface
GeoJSON Geographic JavaScript Object Notation
HDFS Hadoop Distributed File System
HTML Hypertext Markup Language
IS Information Systems
ICT Information and Communication Technology
IoT Internet of Things
JSON JavaScript Object Notation
LSTM Long Short-term Memory Network
ML Machine Learning
MAE Mean Absolute Error
RMSE Root Mean Square Error
RNN Recurrent Neural Network
SVR Support Vector Regression
SQL Structured Query Language
TSV Tab separated values
URL Uniform Resource Locator
VCS Version Control System
Contents
Abstract ... 2 Foreword ... 3 Abbreviations ... 4 Contents ... 6 Figures ... 8 Tables ... 9 1. Introduction ... 102. Research Problem & Methodology ... 13
2.1 Research Problem ... 13
2.2 Research Method ... 14
2.2.1 Design Science Research Framework ... 14
2.3 Development Cycles ... 16
2.4 Validation & Evaluation Method ... 17
3. Prior Research ... 19
3.1 Big Data and Smart City Platforms ... 19
3.1.1 Smart City Platforms ... 20
3.2 Data Lakes ... 21
3.2.1 Data ingestion ... 22
3.2.2 Data Storage ... 22
3.2.3 Data Processing and Analysis... 23
3.2.4 Data Visualization ... 24 3.3 Machine Learning ... 25 3.3.1 Supervised Learning ... 26 3.3.2 Unsupervised Learning ... 27 3.3.3 Semi-Supervised Learning ... 27 3.4 Parking Prediction ... 28
3.5 The current state of Data Lakes and Parking prediction ... 29
4. The Artefact ... 31
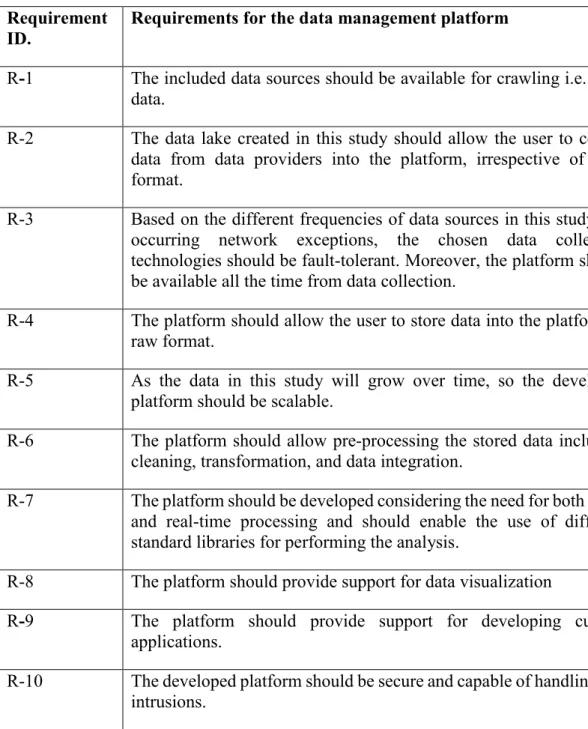
4.1 Requirements of Data Management Platform... 31
4.1.1 Data Characteristics ... 31
4.1.2 Technical Requirements ... 32
5. Architecture ... 34
5.1 Custom Data Collection ... 35
5.2 Data Ingestion ... 35
5.3 Data Storage ... 35
5.4 Data Exploration and Analysis ... 35
5.5 Data Visualization ... 36
6. Implementation ... 37
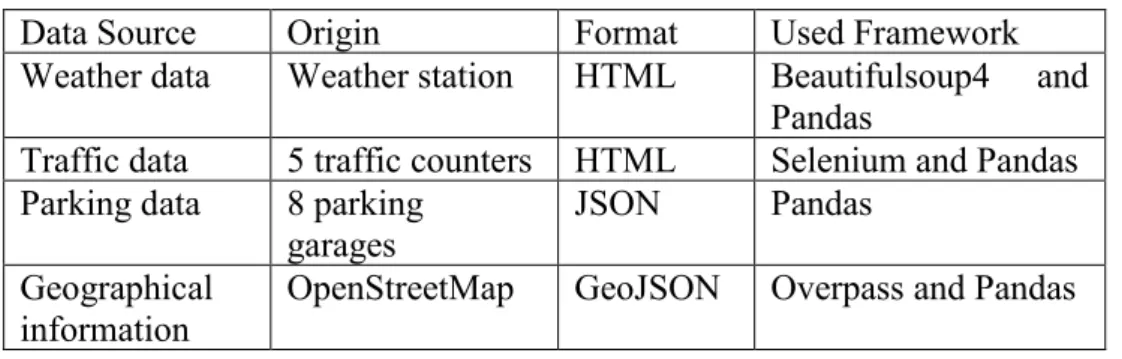
6.1 Data Accumulation ... 37
6.1.1 Manual Data ingestion ... 39
6.1.2 Automated Data ingestion ... 39
6.2 Data pre-processing ... 40
6.2.1 Data Cleaning ... 40
6.2.2 Data Integration ... 41
6.2.3 Dealing with missing values ... 42
6.3 Integrated data set for predicting available parking spaces ... 43
6.4 Predictive Analysis ... 44
6.4.1 Identification of key traffic counter ... 45
6.4.2 Parking prediction using Linear Regression ... 46
6.4.3 Parking prediction using Decision Trees ... 47
6.4.4 Parking prediction using Random Forests ... 48
6.4.5 Parking prediction using Gradient-boosted Trees ... 49
7. Evaluation ... 51
7.1 Validation against the Requirements ... 51
7.2 Evaluation of Predictive Analysis ... 53
7.3 Evaluation activities in DSR ... 54
7.3.1 Evaluation activity 1 ... 55
7.3.2 Evaluation activity 2 ... 55
7.3.3 Evaluation activity 3 ... 55
8. Discussion ... 57
8.1 Discussion on research questions ... 57
8.2 Design Guidelines ... 59 8.2.1 Design as an artefact ... 59 8.2.2 Problem Relevance ... 60 8.2.3 Design Evaluation ... 60 8.2.4 Research Contributions ... 60 8.2.5 Research Rigor ... 60
8.2.6 Design as a Search Process ... 61
8.2.7 Communication of Research ... 61
9. Limitations and Future work ... 62
10. Conclusion ... 63
Figures
Figure 1. Information Systems Research Framework ... 14
Figure 2. Evaluation activities in DSR... 18
Figure 3. The architecture of Apache Flume ... 22
Figure 4. The architecture of Apache Spark ... 24
Figure 5. High Level Flow of supervised learning ... 27
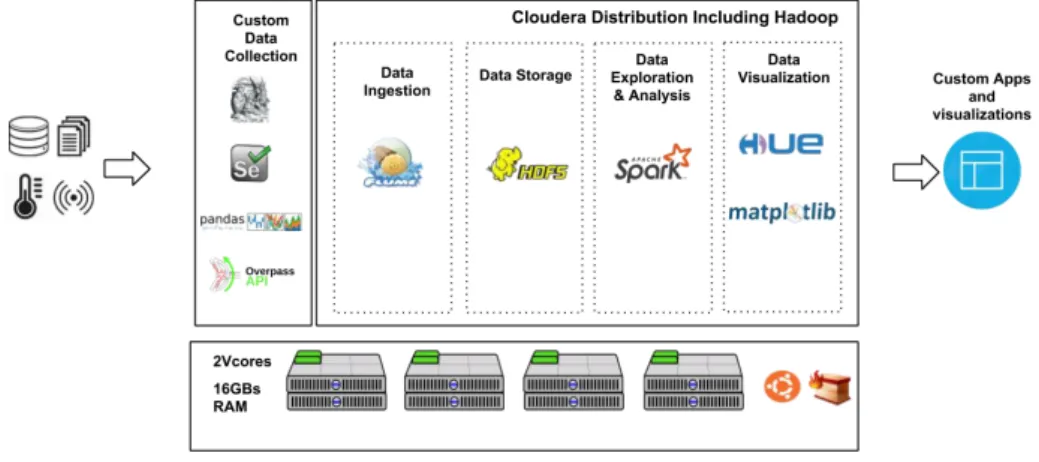
Figure 6. Architecture for data collection, data storage, and data analysis... 34
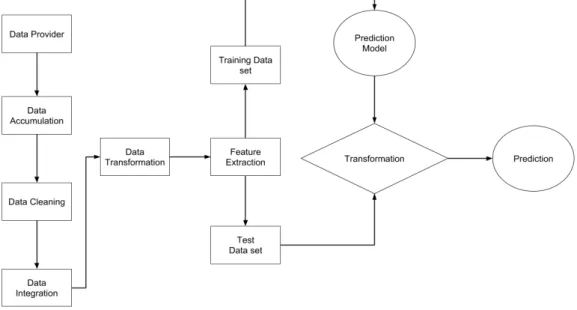
Figure 7. The flow of predictive analysis for parking prediction ... 37
Figure 8. Data accumulation approach using Apache Flume ... 40
Figure 9. Visualization of cleaned traffic data ... 41
Figure 10. Data from temperature and parking spaces ... 44
Figure 11. Principle component analysis on traffic counters ... 45
Figure 12. Prediction results from the Linear Regression Model ... 47
Figure 13. Prediction results from Decision Tree Regression ... 48
Figure 14. Prediction results from Random Forests Regression Tree ... 49
Figure 15. Prediction results from Gradient-boosted Regression Tree ... 50
Figure 16. Scatter plots for evaluation of predicted values (left) Linear Regression Model (Right) Decision Tree Regression Model ... 54
Figure 17. Scatter plots for evaluation of predicted values (left) Random Forests (Right) Gradient-boosted Regression Tree ... 54
Tables
Table 1. The requirements for predictive analysis... 33
Table 2. Information on identified data sources from Cork County ... 38
Table 3. Overview of integrated data set for predictive analysis ... 43
Table 4. Evaluation against requirements ... 51
1.
Introduction
The exponential growth in the number of vehicles in large cities has given rise to high traffic flows and traffic congestion issues. The traffic congestion issues have several side effects including increased air pollution, noise pollution, as well as parking issues. Parking one’s vehicle has always been problematic especially in cities with high population density. It has been estimated that about 30% of traffic is caused by vehicles searching for empty parking spaces (Ionita, Pomp, Cochez, Meisen, & Decker, 2018). Usually, drivers in densely populated areas spend around 3.5 to 14 minutes searching for empty parking spaces (Badii, Nesi, & Paoli, 2018). The spent time in searching for empty parking spaces depends on various factors: the purpose of travel, the proximity of parking garage, the difference in prices among parking spaces, and familiarity with the geographical landscape of the area (Badii et al., 2018). During the search for available parking slots, drivers usually circle around the locations they would like to park, which could lead to environmental and economic impacts (Ionita et al., 2018). The effort of finding available parking spaces can be reduced by notifying drivers about empty slots beforehand and can help in improving existing traffic management policies.
The search for parking has brought great demand for parking information and services. Many cities in the world have adopted the concept of “smart cities” for bringing reforms to unaddressed issues, which directly affect an individual’s life (Lim, Kim, & Maglio, 2018). However, several smart cities have overcome this issue by providing smartphone-based applications, which provide real-time statistics on the availability of parking spaces in user-specified areas. Recent research has shown that with the support of big data, artificial intelligence (AI), and heterogeneous data sources like weather conditions, traffic data, and points of attraction can help in providing more accurate and reliable predictions (Badii et al., 2018). Big data and AI have collectively been used to provide various decision-making options in the everyday lives of people. AI-based intelligent systems are being developed for solving day-to-day problems, but designing an accurate intelligent system is itself a complicated task especially in real-time scenarios.
The data management platforms with attributes of predictive analysis require efficient techniques for handling large-scale data. In cases where data streams are heterogeneous in nature, more advanced techniques and procedures are required to collect, process, and transform the data into useful information for decision-making (Zheng, Rajasegarar, & Leckie, 2015). Current estimations show that approximately 2.5 quintillion bytes of heterogeneous data is produced globally and the percentile of unstructured data is about 90% (Sivarajah, Kamal, Irani, & Weerakkody, 2017). The availability of such an amount of data has given birth to various challenges for data management, data ingestion, data storage, and data analysis.
These days, the concept of “Data Lake” has gained prominence for accumulating data from disparate sources. Data lakes are considered useful for storing a large amount of data in raw format as a single physical data repository, providing different functionalities of data ingestion, data analysis, and data management (Madera & Laurent, 2016). The concept of data lakes emerged from the Big Data wave and Apache incubated Hadoop projects (Madera & Laurent, 2016). In this regard, data lakes are usually closely related to the Apache Hadoop ecosystem (O’Leary, 2014). Data lakes are mostly batch
processing oriented due to their design for making data available first (Madera & Laurent, 2016). Therefore, in some cases, data lakes may provide limited support for real-time processing, which has been addressed in this study.
The main issue in processing real-time data stream is its high velocity. Processing time should, therefore, be considered when performing real-time predictive analysis, as in various applications, the value of data decreases over time (Maarala, Rautiainen, Salmi, Pirttikangas, & Riekki, 2015). For example, in urban traffic flows and congestion scenarios, where quick decision making is required for re-routing of traffic, not being able to process data the moment it arrives is considered a significant delay even if it is just by a single minute (Maarala et al., 2015; Shin, Jun, & Kim, 2018).
The purpose of this Master’s thesis is to predict available parking spaces enabled by a data lake (data management platform) for data collection, processing, and analysis from heterogeneous sources. The data management platform will not only provide support for predicting available parking spaces but will also enable the user to perform different kinds of analysis for different other urban problems. One publication regarding the data management platform has been accepted for publication in a workshop – DASC 2019 being held within 35th IEEE International conference on data engineering, 2019 (ICDE-2019) under the title “Implementing data lake for heterogeneous data sources” (Mehmood et al., 2019).
Parking a vehicle is usually dependent on various factors, such as the motive for travelling, weather situation, and the flow of traffic, therefore proper assessment criteria are required for predicting available parking spaces. Predictive analysis can be performed using traffic density data, real-time parking data from multiple garages, weather condition and geographical information (e.g. a list of amenities from maps), to predict information pertaining to parking spaces. The adopted approach for implementing prediction model for available parking spaces also addresses the existing limitations in previous studies. In this research, supervised machine learning (ML) techniques will be used on a feature set derived from accumulated data i.e. hourly traffic counters located near parking garages, real-time parking occupancy, hourly weather conditions in the area, geographical information like names of landmarks (e.g. markets, parks, hospitals etc.) to predict and analyse parking spaces availability. To address the objective of this thesis, the Design Science Research (DSR) method by Hevner, March, Park, and Ram (2004) will be used to answer the following research questions:
RQ1: In what ways can data analytics be used in the prediction of available parking spaces using machine learning techniques?
RQ2: What kind of technological solutions can be used for designing a data management platform enabling parking spaces prediction?
This thesis is being done as part of EU Horizon 2020 project CUTLER: Coastal Urban developmenT through the LEnses of Resiliency, which includes four pilot cities: Cork, Antalya, Thessaloniki, and Antwerp. The purpose of this project is to use big data analytics methods to make sense of data for developing urban policies, which could help cities in resolving various problems.
In this study, a general use case from Cork County has experimented. The city of Cork is the second largest city in the Republic of Ireland and has been going through infrastructural modifications, which has resulted in the elimination of many parking
places (Roche, 2018). Hence, to address the parking problems of the city of Cork, a predictive analysis for parking availability will be performed using heterogeneous data sources.
The structure of this thesis has been organized in the following way: The research problem and chosen research methodology are explained in Chapter 2. Chapter 3 provides a theoretical background on the topic from identified scientific studies. The next chapter (Chapter 4) provides details on the elicited requirements for the artefact from the conducted literature review and identified problem of predicting parking available parking spaces. In Chapter 5, the architecture of the artefact is explained. The implementation of the artefact including data lake and predictive analysis is described in Chapter 6. In Chapter 7, details on the artefact evaluation are provided. The results of the study have been discussed along with its main limitations in Chapter 8. The future work and limitations of this thesis are explained in Chapter 9. Lastly, Chapter 10 concludes the whole study.
2.
Research Problem & Methodology
This chapter consists of two main sections, in the first section research problem & questions are explained. The next section will describe the used research methodology, to design and implement a data management platform for heterogeneous data sources and to address the identified research problem. In this study, the DSR method by Hevner et al. (2004) will be used, which is the commonly adopted method in information systems disciplines these days.
2.1 Research Problem
The objective of this thesis is to design a data management platform for heterogeneous data sources and for predicting available parking spaces from the accumulated data. This can be further explained to answer the identified research questions for the said objective. As described in the introduction chapter, predicting available parking spaces could be an extensive task because of multiple parking garages available in the city, and varying traffic and weather conditions. The parking places are either located on streets or specified parking garages by city municipality or private vendors and these parking places can be sometimes monitored and un-monitored (Badii et al., 2018; Ionita et al., 2018).
The parking prediction is not only dependent on the occupancy of parking spaces but also on the motive of driver, weather conditions and traffic density (J. Li, Li, & Zhang, 2018). Especially, during the peak hours and special occasions finding parking becomes difficult due to congestion on the main routes of the city (J. Li et al., 2018). Besides, there are other factors which influence the parking availability like parking charges, opening hours and accessibility to the parking place. The following research questions are formed to find the best answers to the research problem.
RQ 1: In what ways can big data analytics be used in predicting available parking spaces using machine learning techniques?
The first research question is aimed at identifying the available machine learning methods and techniques for performing predictive analysis. The answer to this research question will provide the needed knowledge to understand different machine learning mechanisms that can be used for performing predictive analysis using heterogeneous data sources. Also, what kind of data integration and transformations methods can be used for building an accurate learning model for predicting parking spaces from disparate data sources. As well as how data sources (traffic counts, weather conditions, parking count, and geographical information) in the scope are correlated with each other. Furthermore, the analysis will be made on the basis of what are the limitations of the chosen methods, and how can they be improved.
RQ2: What kind of technological solutions can be used for designing a data management platform enabling parking spaces prediction?
The second research question comes from RQ1, as predicting parking spaces relies on various data sources, and requires proper data management platform. Therefore, this
research question is focused on providing an in-depth understanding of different big data technology solutions, which can be used for data collection, data processing, data analysis, and creating visually-aided results. Furthermore, how can the chosen technologies be used for collecting and processing data with varying frequencies i.e. per minute, hourly, daily, and so on. The answer to this question will provide the needed knowledge base for discussion and required necessary steps for building a data management platform infrastructure and what techniques and tools can be used for accumulating heterogeneous data sources to the storage repository. Secondly, it will also help to understand and discuss the various issues of data management, such as data monitoring, data integration, and data processing.
2.2 Research Method
The DSR method by Hevner et al. (2004) these days is a commonly used method in the field of information systems because of its support for developing new and innovative solutions. According to Hevner et al. (2004), the focus of the DSR framework is to allow new technology-based designs in the field of information system driven by innovative ideas. The main idea behind DSR method is to first understand the problem, gather relevant knowledge, build the artefact using different techniques and methods, and evaluate it by strictly following the guidelines presented by Hevner et al. (2004). The artefact in the DSR method can be either a construct, model, or an instantiation depending upon the problem space (Hevner et al., 2004).
2.2.1 Design Science Research Framework
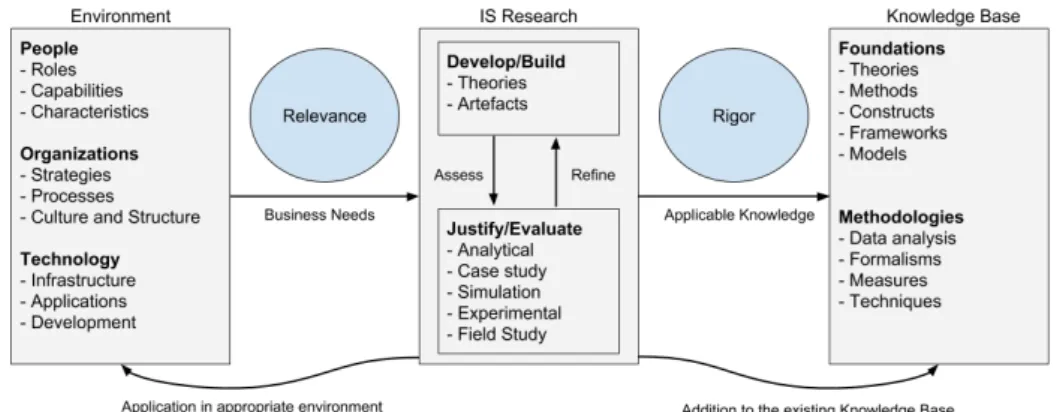
There are various design science frameworks available, but they differ in their own way i.e. during the research process what should be in focus and how the whole process should be executed depending upon the domain. The main research question for this study is to predict parking spaces, and develop a data management platform to collect, process and provide support for predictive analysis, as described in Chapter 1. A new artefact will be built and evaluated for the identified problem space using DSR method by Hevner et al. (2004), the complete process of DSR method is presented in Figure 1. In addition, the seven design guidelines by Hevner et al. (2004) will also be followed for constructing the artefact. The detailed reflection and assessment of DSR method in context to the identified research problem are explained in Chapter 8.
The framework presented by Hevner et al. (2004) in Figure 1 is influenced by three main components i.e. environment, IS research and Knowledge base. The environment describes the settings of the research to be conducted, people, organization and technologies to be used. The IS research portion describes the development and evaluation stages of the research process. Whereas the knowledge base deals with the used theoretical foundations, methodologies and techniques. The environment, IS research and knowledge base for this thesis are described in detail below:
Environment
According to Hevner et al. (2004), as mentioned in Figure 1, the environment in DSR determines the problem, which contains the object of interest. The environment is mainly comprised of people, organization, and technology which are going to benefit from the conducted research. It holds all the relevant items for the study, mainly the objective, opportunities, problems, required tasks which are identified by assessing the context, culture, and business processes of the organization. The relevance, which exists between environments and IS research provides the requirements for performing the research. In the context of this thesis, it provides requirements for predicting available parking spaces from diverse sources, supported by the artefact (data management platform).
People: The data management platform will be designed for accumulating, processing, analysing heterogeneous data sources, also to perform predictive analysis on different types of data for this thesis: parking data, traffic flow counters, weather conditions, and geographical information. The geographical information contains data about the main places of the city, such as markets, hospitals, recreational parks, and educational institutes etc. The artefact being developed for this thesis can be used upon request by anyone who is interested especially, people from the University of Oulu, interested researchers, and partners from CUTLER project.
Organization: The artefact will be developed and evaluated at the University of Oulu. As this thesis is a contribution to a bigger project called CUTLER project. Therefore, partners from CUTLER project can use the created dataset and algorithms for predicting parking spaces availability. Besides, one of the partners from CUTLER (Thessaloniki) is also looking for making reforms towards parking infrastructures, the followed approach can be subsequently used by them as well based on their needs.
Technology: The artefact in this research study is a data lake developed using suitable big data technology solutions. The data management platform will be built using the data pipeline approach, a sandbox-cluster will be installed and configured using Linux OS. To collect and analyse data from disparate sources, Cloudera Distribution including Hadoop (CDH) will be distributed over the cluster containing parcels like Apache Spark, Zookeeper, Hue, Apache Flume, and others. The configuration files and the implemented scripts for data collection, transformation, and analysis will be maintained through Jupyter Notebook and GitHub as a version control system (VCS).
IS Research
The design science research in IS mainly includes two phases: the development phase and validation phase (Hevner et al., 2004). The development phase in the present research will involve the implementation of a predictive model for available parking spaces through machine learning techniques. As well as, the implementation of a data
management platform based on the identified needs for predictive analysis to collect data through custom wrote scripts and big data tools, data processing, and data analysis from heterogeneous data sources.
The constructed platform is designed to support the process of data collection and ingestion from data sources which are static and dynamic in nature – data sources with different acquisition frequencies i.e. every minute, hourly or daily. After the data collection stage, gathered data will be injected into a central repository – a data lake for analysis. The analysed information will then be evaluated based on the identified assessment criteria e.g. accuracy of the prediction, does the used machine learning model fulfils the needs, and does parking data correlated with other data sources based on the assumption.
Knowledge Base
The knowledge base is a key component in DSR, knowledge base allows the researcher to build intended artefact for research problem by using already built knowledge in variously related research. The knowledge base in this study is the existing literature (related work) on the topics of big data analytics pipeline, data collection from heterogeneous data sources, smart city platforms, and machine learning techniques. The knowledge base of this study is elaborated in Chapter 3.
2.3 Development Cycles
The core of this IS research is to develop an artefact for data collection, data ingestion, data analysis, and data visualization and to predict parking availability based on heterogeneous data sources. The development process of the artefact is iterative in nature, where implementation is done in multiple cycles. The artefact is considered as completed after all requirements are met, which are described in Chapter 4. Each cycle in the development process has certain objectives and the evaluation of artefact will be done accordingly. As the system is developed as a prediction framework, all chosen methods and techniques will be tested through specified assessment criteria. In this section, C represents the cycle, each cycle is defined using prefix as C and suffix a numerical value followed by cycle description.
C1: Identifying Data sources
The objective of the first cycle is to identify data sources for predictive analysis for available parking spaces. The data sources for this study are gathered from Cork County. The selected data sources should be able to support the prediction process in the developed platform. The created data catalogue should reflect available data types, access points and access methods. This cycle will be evaluated by analysing whether the data is accessible and there are no restrictions in terms of licensing and privacy.
C2: Designing the infrastructure
The requirement of this cycle is to design and implement the infrastructure for the artefact. The chosen architecture must allow all the activities to be executed for accumulating, processing and analysing the data in the context of the identified research problem. This cycle will be evaluated by reviewing the chosen architecture, packages and operating system i.e. whether selected components provide support for performing predictive analysis. This section is also evaluated from prior research in Chapter 3.
C3: Data collection
The third cycle is about implementing data collection pipeline, which will stream data from identified sources in C1 based on their acquisition frequencies. The collection process is scheduled for data ingestion to a central repository. In this context, it will be a Hadoop Distributed File System (HDFS). This cycle will be evaluated by keeping track of inserted data into HDFS, relevant log files will be reviewed for failures and missing data.
C4: Pre-Processing of data
The aim of this cycle is to pre-process collected data in HDFS and create an integrated data set containing features like time, parking occupancy details, weather conditions, traffic density counters, and geographical information. The pre-processing will include cleaning of data (removing special characters, time conversion, and harmonizing the accumulated data). This cycle will be validated through by closely analysing whether data is understandable and meaningful for analysis.
C5: Analysis & Prediction
The objective of this cycle is to analyse the gathered data as part of predictive analysis using machine learning models. The cycle will be evaluated by measuring the performance and accuracy of chosen machine learning models, and further, it will be compared with models used in existing literature.
C6: Testing the data management platform
The testing process will be executed throughout all the cycles, but in this cycle, specified testing will be performed based on assessment criteria. The assessment criteria will mainly constitute the performance of infrastructure, the performance of data analytics pipeline and measuring the accuracy of the final machine learning model.
2.4 Validation & Evaluation Method
This study is developed using DSR method by Hevner et al. (2004). The evaluation of the artefact being developed in this study will be evaluated using evaluation activities by Sonnenberg and vom Brocke (2012). In IS research the outcome of DSR method is knowledge generated in the form of an artefact and proposition. Usually, DSR is mainly comprised of two activities i.e. build and evaluate. However, validating a design process and built artefact has always found to be crucial (Sonnenberg & vom Brocke, 2012). According to Sonnenberg and vom Brocke (2012), the generated knowledge from DSR method can have a truth value, if its guidelines are followed properly along with a continuous assessment of the artefact being built.
The developed artefact can be validated by formulating a suitable criterion, if the artefact is going to be used in practice, the artefact can be evaluated against the criteria: a) its importance, b) suitability and c) its accessibility (Sonnenberg & vom Brocke, 2012). However, there are other criteria, which can be used as well, such as completeness, efficiency, elegance, robustness, consistency and others, depending upon the type of artefact. Moreover, the mentioned criteria can be used while performing evaluations. In this regard, evaluation patterns (design-evaluate-construct-evaluate) by Sonnenberg and vom Brocke (2012) can be used for validating the artefact in an incremental manner.
The evaluation pattern has been distributed into two main stages i.e. ex-ante evaluation
and ex-post evaluation, where within each stage, there are sub stages consisting of DSR activities, such as identification of problem, design, develop and use. The ex-ante evaluation is about validating the design of the artefact and ex-post evaluations are about validating the designed artefact instances and their use. In this way, each activity can be evaluated using the suggested criteria by Sonnenberg and vom Brocke (2012). As can be seen from Figure 2, the proposed process by Sonnenberg and vom Brocke (2012), suggests that each activity is to be evaluated upon its completion and the same cycle can be repeated. The artefact in this thesis was developed iteratively, as described in Section 2.3. Thus, the evaluation activities proposed by Sonnenberg and vom Brocke (2012) are well-suited for this thesis. The flow of evaluation patterns is shown in Figure 2.
3.
Prior Research
The present chapter draws together and describes existing knowledge as regards to existing the research topic of this thesis. The heterogeneity of data in context with big data applications is described with the commonly faced challenges in collecting, storing and creating conformity for such data. The chapter also explains the ways to implement the architecture as complete data pipeline for heterogeneous data sources. The available studies on similar subject i.e. heterogeneous data sources, big data, smart city platforms, data lakes, big data technologies, and machine learning techniques for building the aimed artefact are reviewed to create a sound knowledge base for this study. Furthermore, different studies on parking prediction frameworks are reviewed to comprehend the research problem, identify the different approaches and machine learning techniques which can be used to address the said problem, as described in Chapter 2.
3.1 Big Data and Smart City Platforms
The advances in technology and digitalization trends have aided in producing great volumes of data. Within this flow, the demand for data analysis is becoming more and more common, people who are interested in analysis data coming from heterogeneous sources are hearing the phrase Big Data more frequently these days (Marron, 2017). The term Big Data is described in different ways but the commonly accepted definition is defined by five Vs: Volume, Value, Variety, Veracity and Velocity (Iqbal, Doctor, More, Mahmud, & Yousuf, 2017). According to Iqbal et al. (2017), the volume is described by the amount of data created and stored every second globally. The value is described as the provision of insights from the created data, for example, finding and analysing anomalies from such data (Iqbal et al., 2017). The variety depicts the types of data which are being created every second globally and veracity is referred to trustworthiness and the amount of noise does the data contains (Iqbal et al., 2017). The fifth V (velocity) of big data is defined by the frequency of data creation i.e. the speed of data creation in seconds, minutes or hours (Iqbal et al., 2017).
The demand for analysing the produced heterogeneous data from sources like social media, sensors, logs, stock exchanges etc. is now becoming more widespread for decision-making by researchers, industrialists and especially organizations who are involved in business intelligence systems (Ishizuka, Chen, & Paik, 2016). The types of data produced from heterogeneous sources can be textual, structured and unstructured formats, media-based data containing videos, images, sensor readings for traffic flow and weather conditions etc., communication data and data created from the internet of things (IoT) (Maarala et al., 2015; Sivarajah et al., 2017). The increasing volumes of generated data require specified workflow-based systems for processing heterogeneous data for minimizing failure risks, developing new applications and decision making (Ishizuka et al., 2016).
3.1.1 Smart City Platforms
The concept of smart cities first appeared in the 1990s (Lim et al., 2018). Since then the concept of smart has been attracting researchers, policy makers and urban planners. The researchers have been involved in investigating the information and communication technology (ICT) based approaches for constructing smart cities e.g. smart city application development such as IoT interfaces, sensors, smart cards, security management platforms, and big data analytics (Lim et al., 2018). Despite the progress, which has been made in smart cities, evaluating its applications in a real-world environment is still difficult (Santana, Chaves, Gerosa, Kon, & Milojicic, 2017). In the past decade, an excessive amount of test-beds have been deployed, which are still experimental due to various challenges such as scalability, heterogeneity, and less involvement of end user in experimenting IoT applications (Santana et al., 2017). However, along with its challenges the number functional requirements have also amplified. These days, one can find the concept of smart cities aiming to improve the urban needs such as in transportation, hospitals, health care, energy and waste management, governance, safe cities, and others (Brohi, Bamiah, & Brohi, 2018). With its progression, various IoT and sensor-based applications have been deployed for bringing reforms in living standards and governance systems. The data produced from the employed smart systems and application is diverse in nature. Alongside its benefits, there are some challenges such as maintaining the quality of data, dealing with security and privacy matters, data integration, mapping user’s needs, and developing feasible smart systems.
With the emerging trend of smart cities, one can find examples of technical maturity among the technologies and tools which are being utilized for designing smart cities. According to a study conducted by Santana et al. (2017), there are four main technologies which are leading smart city projects i.e. IoT, Big data, cloud computing, and cyber-physical systems (CPS). Most of the smart city platforms are not designed with a focus on one technology rather a combination of these technologies is used. A three-tiered IoT-based architecture was designed for SmartSantader to sense air quality, noise, and energy emission (Sanchez et al., 2014). The applications of the project were not limited to environment sensing but also to parking management and providing support for irrigation in parks and gardens such as water requirements and weather conditions (Sanchez et al., 2014).
Another smart city project called Padova was developed using IoT devices to address environmental and transportation issues (traffic flows, parking management, and others) (Cenedese, Zanella, Vangelista, & Zorzi, 2014). The architecture of the developed platform consisted of multiple IoT sensors, where constrained application protocol (CoAP) was used for communication purposes (Cenedese et al., 2014). Despite, the advancements in this field, making data reusable is still difficult due to its diverse nature. The data from these smart city projects is produced from disparate sources, which makes data integration, and standardization a major challenge towards big data analytics (Lim et al., 2018). However, some of these challenges have been addressed with the support of cloud computing and big data technology solutions. (Cheng, Longo, Cirillo, Bauer, & Kovacs, 2015).
3.2 Data Lakes
The statistics presented in research by Sivarajah et al. (2017) depicts that by the year 2020 the size of data generated and consumed globally will reach 40 zettabytes (40 trillion gigabytes). According to Zhao, Garg, Queiroz and Buyya (2017), about 90% of today’s global data was created only in the last two years. The observations show that the created data is not only large as well as its velocity of creation has also become enormously fast (Zhao et al., 2017). Such volume and velocity of data pose the challenges of collecting, storing and processing such large-scale data.
Nowadays, the concept of data lake is becoming popular due to its support for accumulating large-scale data as a single big data repository (Fang, 2015). Additionally, data lakes are aimed to provide a new alternate environment for decision support systems. The data lakes are more agile in nature than traditional decision support systems (e.g. data warehouses) (Madera & Laurent, 2016).
Data lakes in comparison with data warehouses are storage repositories containing data from disparate sources in raw formats. The data can be either in structured, semi-structured and unsemi-structured formats (Madera & Laurent, 2016). Data in data lakes is stored in a single physical repository, built on Hadoop technology. Unlike data warehouses, no change is performed while injecting data to the repository (Madera & Laurent, 2016). On the other hand, data warehouses are developed with extract, transfer, and load (ETL) approach, that can be further be captured for analysis from alternative databases (often require costly add-ons) (O’Leary, 2014). According to O’Leary (2014), data warehouses are generally focused on a particular data source with the objective to facilitate a particular community.
Unlike data warehouses, data lakes are not focused on facilitating specific community, rather they are an open domain, where data from heterogeneous sources is stored and can be queried, processed, and analysed using the same data repository (O’Leary, 2014). Data lakes provide various capabilities (Fang, 2015; O’Leary, 2014), some of them are as follows:
• No additional add-ons are needed to integrate with external databases, access is provided through custom written programs by data lake developers
• Data can be ingested in both batch and real-time
• Data lakes are highly scalable in cases, where the growth of data is continuous • Data lakes are cost-effective for storing large-scale data
• Data stored in data lakes can be reused and re-purposed
• Multiple users can access the storage repository for processing and analysis Along with many advantages of data lakes, there are some limitations as well. Despite, the availability of different frameworks to address general requirements of a data lake, implementing a data lake still requires additional technical effort (Hai, Geisler, & Quix, 2016). Moreover, integrating disparate sources demands advanced metadata management approaches. The unavailability of metadata can make the process of querying and integration challenging (Hai et al., 2016). To address such challenges, a data lake solution
(Constance) by Hai et al. (2016) was developed for metadata management of heterogeneous data, to make the integration process easier within data lakes. Furthermore, AI-based schema evolution approaches can also be utilized for harmonizing the data from disparate sources (O’Leary, 2014). Likewise, a system named CLAMS was developed to meet the challenges of data management in data lakes e.g. maintaining the integrity of data (Farid, Roatis, Ilyas, Hoffmann, & Chu, 2016).
3.2.1 Data ingestion
The data ingestion is described as a process of inserting data to HDFS from different external sources in the form of real-time data streams (Kamala & Marygladence, 2015). The external sources from where the data is fetched can be web services, log files and a relational database. There are various big data solutions available for ingesting data from sources to HDFS. One of the solutions is the Apache Foundation incubated project
Apache Sqoop. Apache Sqoop mainly used for ingesting data to HDFS from relational databases, it consists of standard drivers and connectors enabling ingestion of data in a de-normalized format with the reduced overall load.
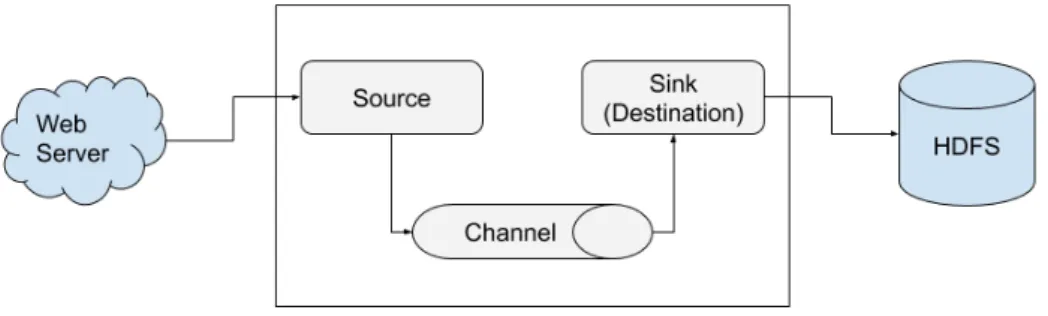
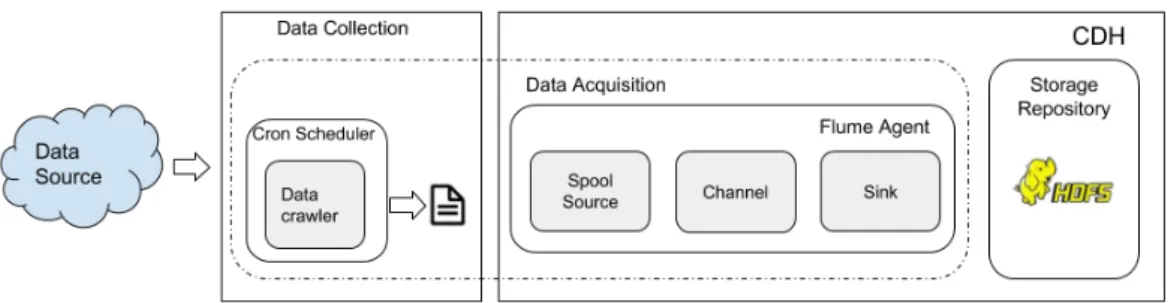
The other solution is Apache Flume, which is one of the reliable HDFS ingestion solutions for writing data in the form of logs to HDFS. Its distributed architecture allows maintaining the load on all nodes unlike traditional architectures (Maarala et al., 2015). Apache Flume is designed to run a separate Java Virtual Machine (JVM). Its architecture consists of a source, sink and channel allowing reliable and fault tolerant data ingestion to HDFS (Liu et al., 2014; Maarala et al., 2015). The HDFS has been designed for storing large files as raw data, that can be incomplete, duplicate, in different formats (Kamala & Marygladence, 2015). The source in Flume fetches the data from end source and passes it to the channel, where a channel could be of two types, memory and file. Failures are possible if the channel type is a memory, whereas the file channel allows recovering the lost data exhibiting the quality of fault-tolerance. After the data is passed to channel it is transferred to sink (destination) for writing into HDFS (Kamala & Marygladence, 2015). The architecture of Apache Flume is mentioned in Figure 2, where the stream is coming from web-server, which is then passed to the source, channel and sink respectively for writing data to HDFS.
Figure 3. The architecture of Apache Flume, redrawn from (Kamala & Marygladence, 2015)
3.2.2 Data Storage
In big data context, data can be stored in HDFS. It allows storing files which are very large in size, providing sequential access for processing and analysis (Katal, Wazid, & Goudar, 2013; K. Li, Deolalikar, & Pradhan, 2015). It runs on commodity hardware,
specially designed for clustered environments. The default block size of HDFS is 128 MB, enabling the reduce the number of disks seeks (Katal et al., 2013). However, the block size can be modified based on the requirement of the user. The main components of HDFS are block, name node, and data nodes. The files are partitioned in blocks, which are then stored on data nodes. The namespace, location of blocks, and file trees are managed by name node (Katal et al., 2013).
3.2.3 Data Processing and Analysis
The results from a survey conducted in Europe by Liu et al. (2014) showed, out of 271 information technology organizations, 70% of organizations emphasized the need for real-time processing. The available big data solutions were designed with a focus to achieve high throughput but processing data sources with low latency is still a challenge. The results from the survey also showed that only 9% of organizations were successful in resolving low latency issues (Liu et al., 2014). The traditional methods and solutions are suitable for processing raw in batches. However, recent advancements in the field of big data have enabled to process and analyse real-time data for decision making.
Analysing large-scale heterogeneous data requires integrating data in a meaningful way for analysis. The data integration is itself a crucial task, which requires implementing different approaches, restructuring, cleaning, and synchronizing received data streams based on their frequencies beforehand (Li & Wang, 2007; Price & Flach, 2013). Many authors have proposed the workflow-based architecture for dealing heterogeneous data, where challenges of speed, parallelism, interoperability, storage costs and operational costs are common especially when dealing with varying latencies of data (Liu, Iftikhar, & Xie, 2014; Maarala et al., 2015; Price & Flach, 2013).
The solutions like Apache Spark and Apache Storm are well-suited for analysing real-time data streams (Liu et al., 2014; Salloum et al., 2016). The following sections describe the available big data technologies for analysing heterogeneous data sources.
Apache Storm is developed for processing real-time data streams especially which are updated frequently (Maarala et al., 2015). The abstraction of Apache Storm provides user to process real-time data streams with low latency in an efficient manner. It follows a data flow like architecture, where data streamed from networks is consumed by the stream as un-sequenced tuples (Liu et al., 2014).
The other frequently used big data solution is Apache Spark. It gained much popularity in the last few years with the demand for processing real-time data streams (Salloum et al., 2016; THEIN, 2014). The Spark project was first started by Matei Zaharia at Berkeley’s AMPLAB in 2009, the further improvements in Spark were done right after it came under incubation of Apache Foundation. The major improvements were done in upper libraries and core of spark (Salloum et al., 2016). It has been found to be optimal for processing real-time data streams from heterogeneous sources (structured or un-structured) (Ranjan, 2014). The processing model of Apache Spark is called as Resilient Distributed Dataset (RDD), which well-suited for processing heterogeneous data sources without storing them for quick decision-making (Liu et al., 2014; Salloum et al., 2016). Apache Spark consists of two main components i.e. main upper libraries and Spark core. The abstraction levels allow developers to take advantage of its specific libraries for producing different kinds of analysis. It includes MLlib, spark ML and GraphX libraries which are used for producing different results based on machine learning techniques
(Ranjan, 2014; Salloum et al., 2016). The Spark SQL allows developers to analyse and process data just like normal SQL without the need for writing complex programs. In case of complex computing problems, it multiplies the memory of deployed cluster to minimize reliance of primary distributed files system, resulting in considerable performance gains comparatively to Map Reduce (Salloum et al., 2016). It is still evolving daily along with support for various general programming language support.
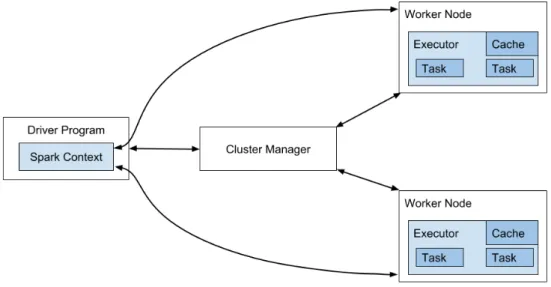
The master-worker based, distributed architecture of the Apache Spark allows dividing available tasks over the worker nodes, where each worker node is managed by a cluster manager – master node. It has support for diverse cluster managers such as Hadoop Yarn, Apache Mesos, Amazon EC2 and its default cluster manager, allows it to run in a distributed and standalone environment (Salloum et al., 2016). The cluster manager is responsible for handling and distributing the resources between multiple Spark applications, running over different worker nodes. Besides it provides huge support for accessing data from various kinds of sources like HDFS, Cassandra, HBase, Hive and others (Salloum et al., 2016). The architecture of Apache Spark is described in Figure 3.
Figure 4. The architecture of Apache Spark, redrawn from (Salloum et al., 2016)
3.2.4 Data Visualization
Every day new data sources are created, and these data sources have become an important part of human life. To understand and create significant results from these data sources, researchers and practitioners are using data analytics techniques to solve day to day problems (Hajirahimova & Ismayilova, 2018). Generating results from large-scale data not only require advanced processing techniques and methods but also graphical and image-based representation approaches to understand the data and streamline the process of decision-making (Yur ’evich Gorodov & Vasil ’evich Gubarev, 2013). Using traditional data representation approach in the context of big data is found to be less effective in practice, causing issues of visual noise, extensive image perception, and loss of information (Yur ’evich Gorodov & Vasil ’evich Gubarev, 2013).
Visual noise in large-scale data representation is defined as upon visualization due to the large size of data, the created visual image may not be effective due to a large number of objects in the data. Hence, the user may only see a large cluster of points overlapped with each other (Yur ’evich Gorodov & Vasil ’evich Gubarev, 2013). Visual noise can be
reduced by distributing data over multiple visuals. It will, however, organize the data objects visually but the user may lose track and may not be able to extract useful information (Yur ’evich Gorodov & Vasil ’evich Gubarev, 2013). These issues can be resolved by using data reduction techniques such as performing sampling and filtering, followed by standard visualization techniques. However, this will require high computational power depending upon the size of data and it can even overlap important parameters from data in some cases (Z. Liu, Jiang, & Heer, 2013; Yur ’evich Gorodov & Vasil ’evich Gubarev, 2013).
Parallel data querying and parallelism-based optimization approaches can help in reducing the computational loads especially when the data is large-scale (Philip Chen & Zhang, 2014; Zhang et al., 2016). Additionally, using parallelism can allow the user to provide results in a more optimized manner in cases, where sequential and real-time analysis is required. The current developments in the field of big data have produced various parallel architecture-based visualization tools, one of them is Hue (Sirisha & Kiran, 2018). Hue is an open-source web interface, which allows the user to interact with different tools (e.g. Apache Spark, Hive, Pig, HBase and others) within the Hadoop ecosystem in a more user-friendly manner. It also provides support for developing different kinds of visualization from data analysis. Additionally, for user non-technical users, there different built-in data analysis plugins, which can be used for analysing large-scale without writing complex programs (Sirisha & Kiran, 2018). Besides, standard data visualization libraries like Matplotlib (Hunter, 2007), if configured over distributed architectures, can also reduce the load time and help data scientists to produce user-friendly results. Matplotlib can be configured with IPython, which allows the user to run it in pylab mode that detects the setting of Matplotlib to draw interactive visuals and figures (Hunter, 2007).
3.3 Machine Learning
Machine learning is considered as a branch of artificial intelligence that is used for synthesizing and elucidating the existing relationships between multiple data points using different algorithms systematically (Awad & Khanna, 2015). For example, ML methods can be trained over a dataset for solving classification problems like identifying the sentiment of the given text document (whether it has positive, negative or neutral sentiment value). These days, applications of ML are becoming more widespread than ever, one can find its application in search engines, digital marketing, stock market prediction, forecasting weather conditions, big data and many others (Awad & Khanna, 2015). The purpose of ML is to predict events or scenarios which are yet to occur and not known to the computer. Awad and Khanna (2015) have to define ML as an area which makes a computer capable of learning without being explicitly programmed. However, the learning process is decisive, where the problem is generalized based on historical experience. The historical experience is provided to the computer in the form of training data set, which helps in generating accurate results based on previously available occurrences (Awad & Khanna, 2015).
Nowadays, many big data applications are leveraging different ML methods to provide effecient results. Though, data in big data context is of huge volume, diverse in nature, and the velocity of data flow has made it difficult to analyse and produce results in real-time (Awad & Khanna, 2015). Not only this, but the attribute of heterogeneity in big data has also made it difficult to create conformity between of data, and make it interoperable (Kadadi, Agrawal, Nyamful, & Atiq, 2014). In this regard, to analyse diverse kinds of data, data integration is necessary. This may involve a restructuring of data, using
semantic matching to harmonize, and data model development (Kadadi et al., 2014). However, with all the present challenges, big data streams still provide numerous opportunities to stimulate the learning methods, which can help in solving various problems. According to Awad and Khanna (2015), a complete process of ML can involve these stages: a) Data collection, b) Data pre-processing, c) Data transformation, d) Training of algorithm, e) Testing the algorithm, and g) Execution.
There are various types of ML methods, such as supervised learning, unsupervised learning, semi-supervised learning, and others (Awad & Khanna, 2015). These methods can be used in different cases depending upon the requirements. However, the results produced from these methods may not relate to the way a human learns but one can get clear insights about data (Awad & Khanna, 2015). The types of ML methods are described in the following sections.
3.3.1 Supervised Learning
Supervised learning is a learning procedure, which is commonly used for solving classification and regression problems. Supervised learning works by inferring the existing relationship between the observational data – input data and the dependent variable for which prediction is to be performed (Awad & Khanna, 2015). The learning of ML models in supervised learning is performed by labelled training data (in classification problems) and known dependent variable (in regression problems) to synthesize the main model function, that attempts to understand and create a sense of the underlying relationship between input and output (Awad & Khanna, 2015). The main purpose of using machine learning algorithms is to minimize the errors for a given subject – training data set. In cases, where the quality of data is poor, the model may face overfitting, which means that the generated output is poorly generalized and erroneous (Awad & Khanna, 2015).
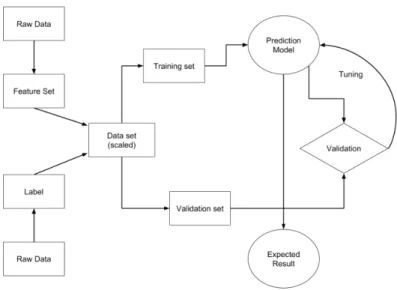
The classification problems by nature discriminate the provided examples for attaining reliable prediction i.e. once the model is finalized that fits the provided data, the future predictions can be compared with provided past data, if they are similar then accurate prediction can be made for other new instances (García, Luengo, & Herrera, 2015). In regression problems, when the target variable is infinite e.g. to predict a certain number between x and y interval, supervised-learning model learns output from input variable after fitting with data. In comparison with classification problems, regression problems are more difficult and require high computational resources (García et al., 2015). The general idea of a supervised learning mechanism is described in Figure 5.
Figure 5. High Level Flow of supervised learning, redrawn from (Awad & Khanna, 2015)
Some types of the supervised learning which deals with classification and regression problems are, Naїve Bayes, Support Vector Machines, Decision Trees, Random Forest, Gradient-boosted trees, Adaboost, different neural networks, and others (Dey, 2016; Praveena & Jaiganesh, 2017).
3.3.2 Unsupervised Learning
Unsupervised learning comparative to supervised learning is much difficult where the goal of the ML model is to make a computer learn how to perform a specific task without any supervisor, only data is provided without labels (García et al., 2015). Furthermore, the aim of unsupervised learning is to find, existing relationships, irregularities, similarities, and regularities in provided input data (García et al., 2015). The unsupervised learning mechanism is utilized for forecasting of data, clustering of data, filtering, and for decision-making, where input data is hypothesized from which phase-based models can be developed as result of its training (Awad & Khanna, 2015).
According to García et al. (2015), apart from clustering, and association problems in unsupervised learning, there two other problems which can fall into its umbrella i.e. pattern mining and outlier detection. Clustering in unsupervised learning is performed, when the aim is to divide the input data to set of groups and clusters rather perform prediction (García et al., 2015). The created clusters reflect the shared properties within the input data, the working is performed by measuring the multivariate distance/gap between the set of observations (García et al., 2015). Whereas association rules are particularly aimed to find the association within the data. For example, if we are to determine the likelihood of customer buying an item: customer bought X item, he/she would also buy Y item. Moreover, association rules can also be utilized for possible sequential patterns in a set of data (García et al., 2015).
3.3.3 Semi-Supervised Learning
Semi-supervised learning is a hybrid learning paradigm for classification tasks (prediction) and descriptive analysis (clustering). Using this, different models can be designed for both labelled and unlabelled datasets (García et al., 2015). The
semi-supervised learning paradigm operates across the guidelines of unsemi-supervised and supervised learning. Due to the large quantity of unlabelled data from various origins like stock market data, biological data, message logs, and others, it has gained prominence in the field of data science (Awad & Khanna, 2015). Similarly, another mechanism called Active learning has the same objective as semi-supervised learning, attempts to select examples of most relevance from an unlabeled dataset, though the selected examples require human expertise for querying (García et al., 2015).
3.4 Parking Prediction
The main purpose of estimating available parking spaces has been known for decades (Ionita et al., 2018). There are some existing research on this topic, where researchers have collected data from smartphones to estimate parking availability through statistical and machine learning algorithms (Ionita et al., 2018). Apart from smartphone-based data, data from traffic and parking sensors have also been used for predicting the parking spaces (Xiao, Lou, & Frisby, 2018). The parking spaces can be located in different places. For example, a parking space can be on a road or in a monitored parking garage. The parking prediction research has two themes, one dealing with the prediction of parking spaces on streets and the second one with parking spaces available in garages (Badii et al., 2018). According to Badii et al. (2018), performing prediction on parking spaces from garages is a lot easier than the one on the streets, because parking spaces in garages are properly monitored through sensors or tickets. However, parking on the street requires the installation of distributed sensors. However, the availability of data for parking prediction is not easily available especially in the case of parking garages (Badii et al., 2018).
To address the issue of predicting parking spaces, researchers have used different types of probabilistic and machine learning algorithms. The street parking problem was addressed in San Francisco by measuring occupancy rate i.e. occupied parking spaces over total spaces (Chen, 2014). The work was implemented for the specific geo-located region using the autoregressive integrated moving average (ARIMA), linear regression, support vector regression, and feedforward neural network (FNN). Among all the experimented model, FNN produced the most accurate results. A study by Ionita et al. (2018), used data from parking sensors, traffic data containing information about traffic flows, weather data, fuel prices, revenues, and events which can impact the parking occupancy. The parking data was collected from a project called SFPark, which contained data for more than two years from on-street parking meters. They used clustering techniques along with machine learning models, such as support vector machines, multilayer perceptron, decision trees, and gradient boosting algorithm to approximate parking situation in the streets (Ionita et al., 2018).
Another study by Xiao et al., (2018), built a prediction framework using Markov M/M/C/C queueing model. The data used to predict the parking occupancy change was historical data from one parking garage located in San Francisco (Xiao et al., 2018). Similarly, to address the issue of predicting available parking spaces different models were used by (Badii et al., 2018). The data used for performing the predictive analysis was from 12 parking garages for a period of approximately three months. The prediction of available parking spaces was performed using Bayesian regularization artificial neural network (BRANN), support vector regression (SVR), recurrent neural network (RNN) and ARIMA model (Badii et al., 2018). The developed models were found to be reliable and capable of providing predictions for different time periods, such as 24 hours, 1 hour,
30 minutes. Moreover, the implemented solution was deployed to smart city applications in Tuscany and Florence, Italy to encourage vehicle drivers for efficient mobility.
3.5 The current state of Data Lakes and Parking prediction
Along with the many advantages of data lakes, they still have some challenges as well. Despite the technological advancements and availability of various frameworks for constructing a general data lake, it still requires a lot of technical effort to implement a data lake (Hai et al., 2016). The other main challenge of data lakes is to provide continuous support for both batch real-time data processing. The data lakes are associated with Apache Hadoop with the aim to make data available first for processing based on MapReduce, which is useful for batch processing (Madera & Laurent, 2016). In this regard, in some cases, the support of real-time processing in data lakes may be limited, which brings the need to implement data lake with hybrid functionality of batch and real-time processing (Madera & Laurent, 2016).
These days, smart cities are producing a large amount of data due to the integrated IoT devices, environmental sensors, traffic sensors, parking sensors, economic platforms, social networking platforms, and others. The data generated from these sources are diverse in nature, with different file formats, different structure, and varying frequencies (Lim et al., 2018). Therefore, maintaining the quality of data, integrating data from such sources, dealing with security, and meeting the end user’s need is challenging (Lim et al., 2018). In addition, the data from these sources makes data integration a major challenge towards big data analytics due to their heterogeneous nature. In this regard, a data management platform with support data integration is needed to make the generated data from smart cities reusable form decision-making.
The concept of parking prediction has been there for decades, many researchers have tried to address this problem using different statistical and machine learning techniques (Ionita et al., 2018). In this thesis, different existing studies were reviewed on the topic of parking prediction for street parking and parking garages. The study by (Chen, 2014) was focused on-street parking occupancy rate i.e. occupied parking spaces over total spaces using different machine learning techniques, where FNN produced the best results. Another, similar study to address the street parking situation was conducted by Ionita et al (2018). They used the historical parking data along with fuel prices, weather condition, traffic counters, and revenues to estimate future parking situations.
On the other hand, a study by Xiao et al (2018) was focused on predicting parking spaces in parking garages. However, the used parking data was only from one parking garage and it was historical, no other data sources were taken into account. Similarly, Badi et al (2018) developed a parking prediction model using different data sources i.e. traffic flows, parking data from garages, and weather conditions. The results from this study were plausible and developed model was integrated into a smart city application providing the estimation for the next 24 hours, 1 hour, and 30 minutes. However, the geographical information was not taken in to account, which can impact the parking availability.
The purpose of this study is to address existing challenges and gaps in parking prediction and data lakes. The parking prediction model in this study will provide estimation for next quarter (15 minutes) using heterogeneous data sources to provide better results. The parking prediction will be performed using a data lake, which will provide the functionality of both batch and real-time analysis. Moreover, the reported challenges of
reusability and data integration will also be addressed by integrated suitable technology solutions. The main challenge in parking prediction reported by J. Li et al (2018) is lower accuracy and required computational cost. The proposed data lake with a data pipeline approach for predicting available parking spaces is highly scalable, cost-effective i.e. do not require additional add-ons, the configured solutions with the support of custom scripts can be used for disseminating results. Furthermore, to provide better accuracy in terms of parking prediction, different data sources are used which are described in Section 6.1, Table 2. In addition, the developed prediction model for available parking spaces and data lake can be used for providing prediction every 15 minutes through an end-user application. The detailed requirements drawn from literature and identified the problem for Cork County are described in the next chapter.