S.O. Omer et al. (2015) Int J Appl Sci Biotechnol, Vol 3(2): 210-217 DOI: 10.3126/ijasbt.v3i2.11908
This paper can be downloaded online at http://ijasbt.org & http://nepjol.info/index.php/IJASBT
Vol-3(2) June, 2015
ISSN 2091-2609
Impact factor*:
1.422
Scientific Journal Impact factor
#:
3.419
Index Copernicus Value:
6.02
Available online at:
http://www.ijasbt.org
&
http://www.nepjol.info/index.php/IJASBT/index
A Rapid Publishing Journal
Indexing and Abstracting
CrossRef, Google Scholar, Global Impact Factor, Genamics, Index Copernicus, Directory of Open Access
Journals, WorldCat, Electronic Journals Library (EZB), Universitätsbibliothek Leipzig, Hamburg
University, UTS (University of Technology, Sydney): Library, International Society of Universal Research in
Sciences (EyeSource), Journal Seeker, WZB, Socolar, BioRes, Indian Science, Jadoun Science,
Jour-Informatics, Journal Directory, JournalTOCs, Academic Journals Database, Journal Quality Evaluation
Report, PDOAJ, Science Central, Journal Impact Factor, NewJour, Open Science Directory, Directory of
Research Journals Indexing, Open Access Library, International Impact Factor Services, SciSeek, Cabell’s
Directories, Scientific Indexing Services, CiteFactor, UniSA Library, InfoBase Index, Infomine, Getinfo, Open
Academic Journals Index, HINARI, etc.
CODEN (Chemical Abstract Services, USA): IJASKD
For any type of query and/or feedback don’t hesitate to email us at: [email protected]
*Impact factor is issued by Universal Impact Factor. Kindly note that this is not the IF of Journal Citation Report (JCR).
DOI: 10.3126/ijasbt.v3i2.11908
BAYESIAN ANALYSIS FOR GENOTYPE X ENVIRONMENT INTERACTIONS
AND THE GGE-BIPLOT ASSESSMENT: EVALUATION OF BALANCED
CLASSIFICATIONS WITH MISSING VALUES
Siraj Osman Omer1*, Eltayeb Hassan Slafab2 and Abhishek Rathore3
1Experimental Design and Analysis Unit, Agricultural Research Corporation (ARC), P.O. Box 126, Wad Medani, Sudan 2Gezira Research Station, Agricultural Research Corporation (ARC)
3Biometrics Unit, International Crops Research Institute for Semi-Arid Tropics (ICRISAT), Patancheru 502 324, AP, India
*Corresponding author’s email: [email protected]
Abstract
In multiple environmental trials (METs) most of the data, balanced or unbalanced, are normally tested over a wide range of environments (locations, years, growing seasons, etc.) and the basic statistical method used to obtain reliable statistical information. A case study is presented here to demonstrate the usefulness of Bayesian approach in genotype-by environment data analysis, in comparison with frequentist approach and GGE biplot assessment classification with missing value. Particular emphasis was given to Bayesian application that exploits pedigree information and to the analysis of GEI data for estimation of heritability, genetic gain and means prediction.
A Markov Chain Monte Carlo (MCMC) method has been considered to perform Bayesian inference using R2WinBUGS. The study recently done in sorghum variety trials show investigation can be applied for multi environmental trial data. Results shows that the Bayesian estimation of variance components was accurate compared to the frequentist. The two principal components in GGEbiplot analysis were significant, explaining 95.13% (85.17% PC1 and 9.9.% PC2) for frequentist approach and explaining 97.36% (84.06% PC1 and 13.3% PC2) for Bayesian approach of interaction variation. Bayesian analysis indicates GGE-biplot gave the best results in contributing to the GEI. Bayesian approach for analysis GEI data is highly suitable with missing values.
Keywords: Bayesian approach; data analysis; GxE interaction; sorghum grain yield
Introduction
There are many statistical procedures are available to analyze the multi-environment trials data. One of the most common methods in a genotype by environment interaction (GEI) study is to compute the simple averages across replication for a genotype in an environment and then analyzing the means (Crossa et al., 2011). Breeders face the GEI challenge by evaluating genotypes in several environments to ensure that they select accessions with high and stable performance over a wide range of environments (Ssemakula et al., 2007). The GEI model in plant breeding has been interested in studying the GEI for a long time (Burdon, 1978; Hill, 1975; Kang, 1998; Ramburan et al.
2011). Recently, Yan (2014) studied a mega-environment trial analysis and test location evaluation based on unbalanced multiyear data using GGE biplot. Bayesian framework has been documented since the early nineties in animal breeding by Sorensen and Waagepetersen (2003) and Viele and Srinivasan (2000) using Gibbs sampling
(Geman and German, 1984; Gelfan and Smith, 1990). Edwards and Jannink (2006) has observed the comparison to the abundant Bayesian literature available for many statistical problems, and for AMMI models. Also Smidl and Quinn (2007) and Hoff (2009) suggested a Bayesian treatment of principal components analysis models with imposing the use of prior distribution such as uniform prior. More recently, in the Bayesian framework of the analysis of GE data, the use of proper priors for parameters of interest provides several advantages over frequentist estimation methods (Josse et al., 2014). Bayesian inference has been evaluated for incomplete data sets that considered genotype by location by year interaction using a hierarchical model (Theobald at al., 2002). Bayesian approach should give more accurate inferences than frequentist significance testing approaches because it does not requires distribution of assumptions (Enders et al., 2013). Bayesian approach offers the possibility to incorporate in the prior information on the parameter of interest under study and also, distributions of any quantity of interest are available
S.O. Omer et al. (2015) Int J Appl Sci Biotechnol, Vol 3(2): 210-217 through the posterior distributions (Browne and Draper,
2006). Recently, Bayesian application has been provided for routinely used crop variety trials in an individual environment (Singh et al., 2014). The most recent authors introduced the theory of missing-data patterns by Verbeke and Mohlenberghs (2000) and Piepho et al. (2014).
Rationale and Objectives of the study
The work will focus on balanced data classification with missing value in randomized complete block design (RCBD) that will serve as a starting point for Bayesian challenges in deeper study of this topic. Frequentist approach will be used based on best linear unbiased prediction (BLUP) as a standard method for estimating random effects of a mixed model. According to Yan (2011) the estimation will be useful only when the proportion of missing data was less than 40%; for a larger dataset (Piepho, 1995). Yan (2013) outpoint the missing values are estimated based on existing relation among the environment in the data. The motivating of research work, Bayesian framework can produce to an estimate for missing data using additive model (rows and columns) and then use the model to impute a value for missing cell. In Bayesian analysis of incomplete data, need integrated prior information with likelihood function to obtain posterior information. Because of missing value, this requires integration information for evaluating (Yao, 2012). This research article applied Bayesian approach compared to frequentist in terms of predictive accuracy. Particular emphasis is given to Bayesian application that exploit pedigree information and to the analysis of GEI data for estimation of heritability, genetic gain, means prediction and GGE biplot analysis Presentation of a comprehensive Bayesian data analysis on grain yield (kg/ha) to provide an updated look at the Bayesian statistical summarizing from a current perspective its formulation, interpretation, and implementation and new developments.
Martials and methods
Experimental Data
The dataset obtained from a two-year field trial carried out from 2007/2008 to 2008/2009 in Sudan on a randomized block design with three replicates. For the present analysis, 20 sorghum (sorghum bicolor) genotypes were tested at two locations. Grain yield (kg/ha) was used in data analysis. The design may be balanced in the sense that not all response variables were measured on each individual. However missing responses will be considered or special care must be taken in analyzing data having. The statistical analysis will be performed using Genstat software.
Statistical Model for Linear Mixed Model
The linear mixed model comprise four factors assuming that environmental effect is random, genotype effect, the environment by genotype interaction (GEI), and all other
factor effects are random. The yield response Yijtk is
according to the linear model is given by Yijk= μ + Ej+Bk(Ej) + Gi+ GEij+ eijk
where Yijk is the yield response of the genotype i in the
environment j, and block k; μ = grand mean, Gi is the effect
of the genotype i, Ej is the effect of the environment j.
and Bk(Ej) is the effect of block k within environment (j).
This model is useful for multiple experiments trials. eijtkis
the residual error from the plot for Yijk, and assumed to be
normally distributed with homogeneous variance σe2 . It is
assumed that Ej, Gi and GEij are normally and
independently distributed, with means zero and variances σE2, σG2 and σGE2 , respectively. The value of vectors index are
j=1,…, NP, i=1,…,NG and r=1,…,NB, where NP,NG,NB are number of environment, genotypes and blocks respectively.
Bayesian Approach of Model
In Bayesian application, the observations are assumed to be exchangeable samples (modeled as independent samples from some probability distribution) (Jaya, 2013). Thus, from a normal distribution as follows:
𝑌𝑖𝑗𝑘|𝐵𝑘𝑗, 𝐸𝑗, 𝐺𝑖, 𝐺𝐸𝑖𝑗 ~ 𝑁(𝜇𝑌, 𝜎𝑒2)
Where
𝜇𝑌= 𝜇 + 𝐸𝑗+𝐵𝑘(𝐸𝑗) + 𝐺𝑖+ 𝐺𝐸𝑖𝑗+ 𝑒𝑖𝑗𝑘 (7.2)
The next level of the Bayesian hierarchy includes prior distributions of variance components for blocks, environments, genotypes effects and interactions 𝐵𝑘𝑗, 𝐸𝑗, 𝐺𝑖, 𝐺𝐸𝑖𝑗and their variances. In Bayesian approach
model all the priors distribution were assumed as normal distribution with means zero and variances defined to condition the desired level of information sharing among levels of the factor (Edwards et al., 2006). Independent prior distributions were assigned for the parameters used. These are specified as follows. For block effect, 𝐵𝑘𝑗|𝜎𝐵2~𝑁(0, 𝜎𝐵2)
; effect of location, 𝐸𝑗|𝜎𝐸2~𝑁(0, 𝜎𝐸2); effect of genotypes,
𝐺𝑖|𝜎𝐺2~𝑁(0, 𝜎𝐺2); effect of genotypes and environment
interaction, 𝐺𝐸𝑖𝑗|𝜎𝐺𝐸2 ~𝑁(0, 𝜎𝐺𝑅2 ). In the above, σB2 is the
variance of block effects, 𝜎𝐸2 is the variance of environment
effects, 𝜎𝐺2 is the variance of genotypes effects, 𝜎𝐺𝐸2 is the
variance effect of the interaction of genotype with environment (Murari et al., 2014).
Prior distribution
The chosen priors on the parameters will depend inspecting the induced prior distribution on the data. In the absence of use past data available, non-informative prior can be effectively contributes to Bayesian estimation. In Bayesian estimation, a non-informative prior is useful because it provides. In the Bayesian framework, the prior and the data combine to produce an updated distribution (a posterior) that describes the relative probability of different parameter
values (Gelman, 2002). In this study, the half-normal, uniform and half-t prior distributions on the parameters of interest of variances can be used.
Posterior distributions
The idea of posterior distribution is to incorporate the likelihood defined by the distribution of the data and the priors (Gelman, 2006). The posterior distribution can be drawn from some second stage prior using empirical Bayes approach (Carlin and Louis, 2009). The posterior distribution can be obtained using a Gibbs sampler. However, one of the strongest points of the suggested approach is that it is not necessary to build and implement a specific Gibbs sampler as in Viele and Srinivasan (2000) and in Crossa et al. (2011). The posterior distribution can be obtained analytical in view or in simple cases, when its number of parameters increases using Markov Chain Monte Carlo (MCMC) (King et al., 2009). MCMC method is a general simulation method for sampling from posterior distributions and computing posterior quantities of interest (Richey, 2010). In this study R2WinBUGS will be used to specify Bayesian models of the posterior values.
Results
Both frequentist and Bayesian approaches, the statistical analysis can be made by using REML method and in the Bayesian approach the investigation can be by choosing one of several combinations of diffuse priors and posterior point summaries with the discrepancy statistics.
Selection of priors distribution
The select of priors for Bayesian analysis has made using discrepancy statistics were given in Table1. The values of DIC = Deviance information criterion and
p
D= effective number of parameters are different for each distributions. Three different priors set has presented in Table 1, however,the prior set P2 seems to have numerically lowest value of DIC (2172.47). Estimation of parameters and providing a better understanding on how the three priors affect the resulting Bayesian posterior parameters. Results of heritability, genetic advance and variance components of all factors will be presented , which provides a general picture of the relative magnitudes of effects of environment (E), genotype (G) and the interaction (G × E).
Table 1. Deviance information Criteria values for selection of the priors for grain yield (kg/ha) on sorghum genotypes at different environments.
Priors set
D
D
ˆ
p
D DICP1 3048.15 2990.24 57.903 3106.05
P2 3165.36 4158.24 -992.886 2172.47
P3 3039.22 2969.95 69.272 3108.49
Where
D
=posterior mean of (- 2 × log-likelihood),D
ˆ
= - 2 × log-likelihood at posterior means of parameters.p
D= effective number of parameters,DIC= Deviance information criterion. Priors set are:P1:
𝜎𝐵, 𝜎𝑝 𝜎𝑔 and 𝜎𝑎 Independently ~ uniform(10, 1000).
P2: 𝜎𝐵, 𝜎𝑝 𝜎𝑔 and 𝜎𝑎 Independently ~ half − t(0, 4, 3).
P3: 𝜎𝐵, 𝜎𝑝 𝜎𝑔 and 𝜎𝑎 Independently ~ half −
normal (500, 0.0005).
Frequentist and Bayesian Estimation of Posterior Means, genotypes variance, heritability and genetic gain
Table 2: Frequentist estimates and Bayesian posterior means of error variances, genotypic variance, heritability and genetic gain for grain yield (kg/ha) using uniform, Half-t and half-normal priors seHalf-ts.
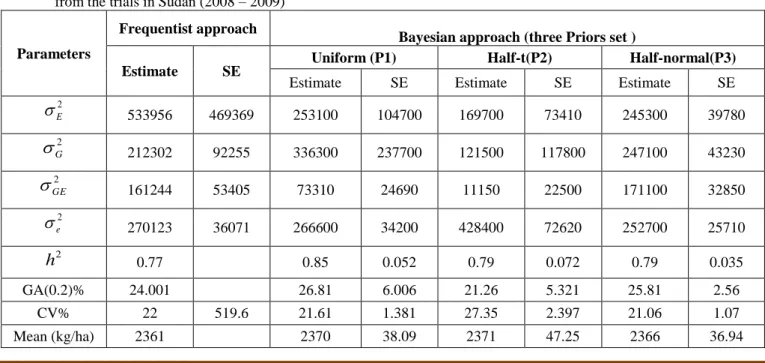
Table 2. A comparison of frequentist and Bayesian approach in GEI model applied to grain yield (kg/ha) on sorghum genotypes from the trials in Sudan (2008 – 2009)
Parameters
Frequentist approach
Bayesian approach (three Priors set )
Estimate SE Uniform (P1) Half-t(P2) Half-normal(P3)
Estimate SE Estimate SE Estimate SE
2 E
533956 469369 253100 104700 169700 73410 245300 39780 2 G
212302 92255 336300 237700 121500 117800 247100 43230 2 GE
161244 53405 73310 24690 11150 22500 171100 32850 2 e
270123 36071 266600 34200 428400 72620 252700 25710 2h
0.77 0.85 0.052 0.79 0.072 0.79 0.035 GA(0.2)% 24.001 26.81 6.006 21.26 5.321 25.81 2.56 CV% 22 519.6 21.61 1.381 27.35 2.397 21.06 1.07 Mean (kg/ha) 2361 2370 38.09 2371 47.25 2366 36.94S.O. Omer et al. (2015) Int J Appl Sci Biotechnol, Vol 3(2): 210-217
Table 2 shows heritability and genetic advance both in broad sense, coefficient of variation, estimation of variance under frequentists and Bayesian approach. The Bayesian estimate of environment variance based on mean value of uniform, half-t and half-normal priors were lower than that under the frequentist approach were (0.21, 0.14 and 0.20 vs. 0.44) respectively. The Bayesian estimate of genotype variance based on mean value of uniform and half-normal prior are slightly higher than that under the frequentist approach were (0.37 vs. 0.23) and (0.27 vs. 0.23) respectively. Bayesian half-t distribution was small compared to frequentist approach was (0.13 vs. 0.23). The Bayesian estimate of genotype and environment interaction variance based on mean value of uniform and half-t are small than that under the frequentist approach were ( 0.18 vs. 0.39) and ( 0.03 vs. 0.39) respectively. Bayesian half-normal distribution was slightly higher compared to frequentist approach was (0.41 vs. 0.39). The performance of Bayesian estimate of experimental error variance,
e2 of uniform and half- normal priors distributions (0.219 and 0.208) were very close in comparing with frequentist estimate (0.222), while halt-t prior distribution (0.352) gave highly error variance estimate in comparing with frequnetist approach (0.222). In other words, Bayesian estimate of error is very smallest in comparing to the frequentist estimates. The half-normal and uniform prior demonstrates assurance results based standard and Monte Carlo error gives reliable information revealed highly significant differences for both approaches. Generally, Bayesian estimation for heritability and genetic advance gave high values compared to the frequentists approach. Also coefficient of variation of half-normal and uniform prior are did differ to freqentist approach, while half-t prior was higher value compared to frequentist approach. Bayesian estimate of the heritability using three priors were (0.85, 0.79 and 0.79) of uniform, half-t and half-normal distributions is higher compared to frequentist (0.77).Bayesian genetic advance for uniform and half-normal prior distributions were (26.8 and 25.8) are slightly higher than the frequentist approach (24). While Bayesian heritability of half-t distribution was (21.3) is small compared to frequentist approach. Bayesian standard error estimates have been found to be useful in indicating the precision of selection of different prior sets.
From Table 3, under both approaches the environmental means values were slightly different. And mean ranks were not differing to each other. Bayesian analysis of the posterior means and average standard error for all priors indicates a considerable improvement of the precision (i.e the average SE is between 73.7- 92.5) comparing to the frequentist approach (127.9). It can be seen that the MC error of uniform and half normal priors of predict means are very small compared to haft-t prior. Bayesian estimates of SEs or posterior SDs for the environment effect were smaller compared to frequentist approach.
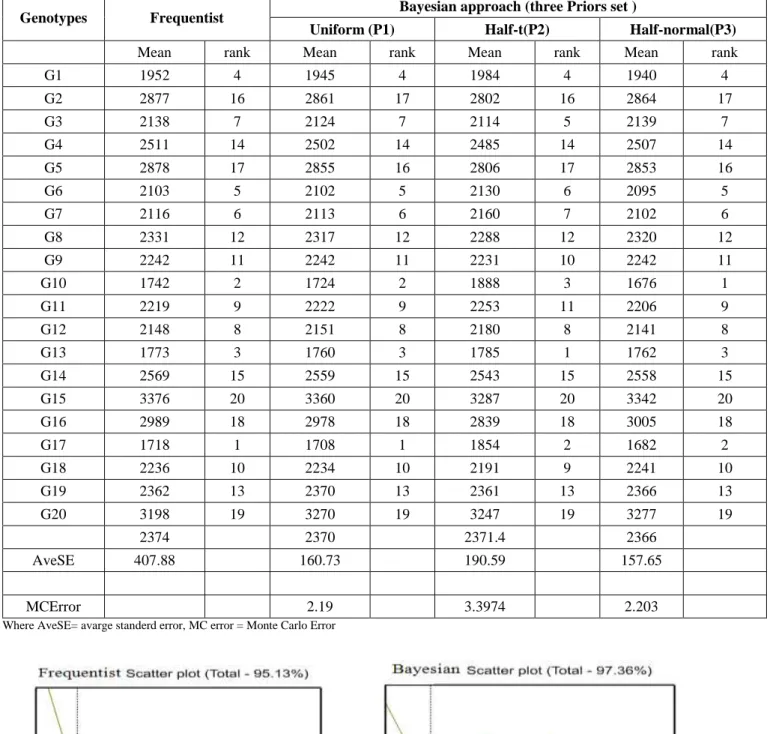
Table 4 shows that ranks of predicted means under both approaches were found differ for genotypes means. The Bayesian posterior results using three different priors sets show slightly different with proper prior, the choice of prior will great impact on the prior has been used. However Bayesian approach gives high precision based on standard error and Monte Carole error. Two more accurate approximations are available that the MC errors in all the parameters in table 4 and table 5, which were very small indicating reliable numerical approximation through the number of simulation runs used. Bayesian analysis of the posterior means and average standard error for all priors indicates a considerable improvement of the precision ( i.e the average SE is between 157.65- 190.5) comparing to the frequentist approach (407.9). Bayesian uniform and half normal distributions are more suitable to be considered. Bayesian analysis of the posterior means and average standard error for all priors indicates a considerable improvement of the precision.
Table 3. Mean estimate and their rank of frequentist and Bayesian approach with standard error for grain yield (kg/ha) of the environment effect (Different two locations and two years (2008-2009)) in Sudan.
Environment Frequentist approach
Bayesian approach (Posterior Distribution ) Uniform Half-t Half-normal Mean rank Mean rank Mean rank Mean rank
E1 2241 3 2232 3 2216 3 2230 3 E2 1847 1 1848 1 1852 1 1849 1 E3 1937 2 1938 2 1956 2 1930 2 E4 3471 4 3462 4 3461 4 3454 4 2374 2370 2371 2366 AveSE 127.97 74.37 92.46 73.71 MCError 1.04 1.58 1.05
Table 4: Mean estimate and their rank of frequentist and Bayesian approach with standard error for grain yield (kg/ha) on sorghum genotypes over all environment (Different two locations and two years (2008-2009)) in Sudan
Genotypes Frequentist Bayesian approach (three Priors set )
Uniform (P1) Half-t(P2) Half-normal(P3)
Mean rank Mean rank Mean rank Mean rank
G1 1952 4 1945 4 1984 4 1940 4 G2 2877 16 2861 17 2802 16 2864 17 G3 2138 7 2124 7 2114 5 2139 7 G4 2511 14 2502 14 2485 14 2507 14 G5 2878 17 2855 16 2806 17 2853 16 G6 2103 5 2102 5 2130 6 2095 5 G7 2116 6 2113 6 2160 7 2102 6 G8 2331 12 2317 12 2288 12 2320 12 G9 2242 11 2242 11 2231 10 2242 11 G10 1742 2 1724 2 1888 3 1676 1 G11 2219 9 2222 9 2253 11 2206 9 G12 2148 8 2151 8 2180 8 2141 8 G13 1773 3 1760 3 1785 1 1762 3 G14 2569 15 2559 15 2543 15 2558 15 G15 3376 20 3360 20 3287 20 3342 20 G16 2989 18 2978 18 2839 18 3005 18 G17 1718 1 1708 1 1854 2 1682 2 G18 2236 10 2234 10 2191 9 2241 10 G19 2362 13 2370 13 2361 13 2366 13 G20 3198 19 3270 19 3247 19 3277 19 2374 2370 2371.4 2366 AveSE 407.88 160.73 190.59 157.65 MCError 2.19 3.3974 2.203
Where AveSE= avarge standerd error, MC error = Monte Carlo Error
Fig. 1: Polygon views of the GGE-biplot based on symmetrical scaling for the which-won where pattern for genotypes and environments.
S.O. Omer et al. (2015) Int J Appl Sci Biotechnol, Vol 3(2): 210-217
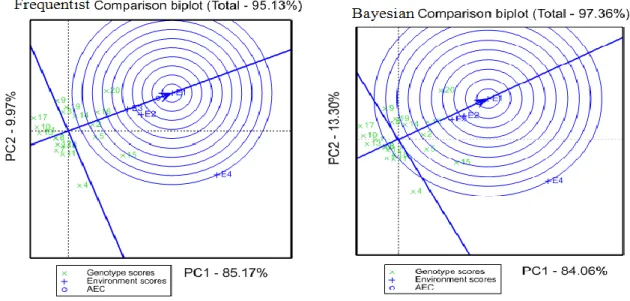
Fig. 2: Frequentist and Bayesian approaches for polygon views of the GGE-biplot based on symmetrical scaling for the which-won where pattern for genotypes and environments
.
GGE-biplot
Recently, biplot analysis of genotype × environment data has received attention using a GGE biplot (Yan et al., 2000). GGE Biplot is use for analyzing genotype × environment data (Yan et al., 2001). In this study, predicted means a complete two-way table has produced form missing values in MET for frequentist approach using Genstat software and WinBugs for Bayesian approach.
Fig. 1 and Fig. 2 comparing the frequentist and Bayesian approach for GGE biplot of first and second principal components (PC1 and PC2, respectively) based on 20 of sorghum genotypes in 4 environments (combination season–location) in Sudan. We observed that the frequentist method of the first two principal components obtained by singular value decomposition of the GGE model explained 95.13% (85.17% PC1 and 9.9% PC2) for frequentist approach and explaining 97.36% (84.06% PC1 and 13.3% PC2) of total variation.
Discussion
This study focus in comparing frequentist and Bayesian methods for fitting variance components of genotypes, environment and their interaction, heritability, genetic advance using REML models analysis in GENSTAT statistical package (version 16.0) .In this research work, three different sets of priors were considered using uniform, half-t and half-normal prior distributions. The three priors provide a considerable efficiency gain while selecting the best prior is more likely to be implemented in agricultural experimental studies for posterior information. Celeux et al. (2006) observed that in missing data setting, multiple deviance information criteria (DIC) can be defined depending on whether one integrates out the missing data or treats it as something setting. In Bayesian analysis, the select of proper prior information or distribution is very
essential, because prior distribution is a key part of Bayesian inference and represents the information about an uncertain parameter that is combined with the probability distribution of new data to yield the posterior distribution Gelamn (2002). In this study, empirical prior has been considered in a Bayesian framework, which incorporates prior information based on data in second stage about the parameters or specifies prior distributions, because of lack of knowledge or previses trails. The half-normal distribution has been select as best prior candidate. For Bayesian analysis 50000 iterations have been used with using 5000 simulation samples in MCMC algorithm. The estimate of heritability, genetic advance are did differ from each other. Average standard error of three different Bayesian posterior estimates as the expected value of the estimator under frequentist approach. According to the results of this study, it was highlighted that the two approaches were differ. Bayesian estimation is reliable gives similar outcomes compare to frequenters approach. However, the analysis of unbalanced data with missing value using Bayesian approach has many advantages that to handle modeling is missing value completely at random. In case of unbalanced data sets, Bayesian approach has shown more precision based on average standard error and MC error, because of number of simulation has been run in MCMC. However, the furfure application should be conducted in same direction for in big missing values. R and WinBUGS for Bayesian statistical analysis are available for similar situation. The Bayesian analysis for GEI codes can be obtained from the first author.
Conclusions
In this paper, Bayesian approach and the non-Bayesian approach (frequentist) has been considered with balanced data classification missing values. We highlight the benefits of using a Bayesian point of view to answer
practical questions raised when analyzing GE data. Two methods for heritability and genetic advance estimation were differing of both and among the three prior Bayesian approach in compared to frequentist showed that modeling GE using GGE biplot analysis. Application of Bayesian approach in agricultural experiment data, especially in plant breeding program, offer an analytical strategies based MCMC methods by WinBUGS.
Acknowledgements
This work was supported by CV Raman fellowship for Africa researchers grant in the India and by host institute International Crops Research Institute for the Semi-Arid Tropics (ICRISAT). The authors thank Biometrics staff, ICRISAT for their help obtaining in statistical analysis.
References
Browne WJ and Draper D (2006) A comparison of Bayesian and likelihood-based methods for fitting multilevel models.
Bayesian Analysis1: 473–514. DOI: 10.1214/06-BA117 Burdon RD (1978) Genetic correlation as a concept for studying
genotype- environment interaction in forest tree breeding.
Silvae Genetica26: 168- 175.
Carlin BP and Louis TA (2009) Bayesian methods for data analysis (3rd ed.). Boca Raton, FL: CRC Press.
Crossa J, Perez-Elizalde S, Jarquin D, Cotes JM, Viele K, Liu G and Cornelius PL (2011). Bayesian Estimation of the Additive Main Effects and Multiplicative Interaction Model. Crop Sci. 51: 1458–1469. DOI: 10.2135/cropsci2010.06.0343
Edwards JW and Jannink JL (2006) Bayesian Modeling of Heterogeneous Error and Genotype and Environment Interaction Variances. Crop Sc. 46(2): 820–833. DOI: 10.2135/cropsci2005.0164
Enders CK, Fairchild AJ and MacKinnon DP. A Bayesian approach for estimating mediation effects with missing data. Multivariate Behavioral Research (unpublished). Gelfand AE and Smith AFM (1990). Sampling based approaches
to calculating marginal densities. Journal of the American Statistical Association 85: 398–409. DOI: 10.1080/01621459.1990.10476213
Gelman A (2002) Prior distribution. Encyclopedia of Environmetricsm3: 1634–1637.
Gelman A (2006) Prior Distributions for Variance Parameters in Hierarchical Models. Bayesian Analysis3: 515–533. Gelman A, Carlin JB, Stern HS and DB Rubin. 2004. Bayesian
data analysis. Second edition. Boca Raton: Chapman & Hall.
Geman S. and Geman D (1984) Stochastic relaxation, Gibbs distributions, and the Bayesian restoration of images. Institute of Electrical and Electronic Engineer Transactions in Pattern Analysis and Machine Intelligence 6:721–741. DOI: 10.1109/tpami.1984.4767596
Hil J (1975) Genotype-environment interaction – a challenge for plant breeding. The Journal of Agricultural Science 85: 477-493. DOI: 10.1017/S0021859600062365
Hoff PD (2007) Model Averaging and Dimension Selection for the Singular Value Decomposition, Journal of the American Statistical Association 102(478): 674–685. 10.1198/016214506000001310
Josse J, Eeuwijk F, Piepho HP and Denis JB (2014) Another Look at Bayesian Analysis of AMMI Models for Genotype-Environment Data. Journal of Agricultural, Biological, and Environmental Statistics19(2): 240–257 DOI: 10.1007/s13253-014-0168
Josse J, van Eeuwijk F, Piepho HP and Denis JB (2014) Another Look at Bayesian Analysis of AMMI Models for Genotype-Environment Data. Journal of Agricultural, Biological, and Environmental Statistics19(2): 240–257. DOI: 10.1007/s13253-014-0168-z
Kang MS (1998) Using genotype-by-environment interaction for crop cultivar development. In: Sparks DL (ed.) Advances in Agronomy62: 199-252.
King R, Morgan BJT and Gimenez O and Brooks SP (2009) Bayesian Analysis for Population Ecology. CRC Press - 456. 10.1201/9781439811887
Piepho HP (1995) Methods for estimating missing genotype-location combinations in multigenotype-location trials - an empirical comparison. Informatik, Biometrie und Epidemiologie in Medizin und Biologie 26, 335–349.
Piepho HP, Müller BU, Jansen C (2014) Analysis of a complex trait with missing data on the component traits,
Communications in Biometry and Crop Science9(1): 26– 40.
Ramburan S, Zhou M and Labuschagne M (2011) Interpretation of genotype by environment interactions of sugarcane: Identifying significant environmental factors. Field Crops Research 124: 392-399. 10.1016/j.fcr.2011.07.008 Richey M (2010) The Evolution of Markov Chain Monte Carlo
Methods, The American Mathematical Monthly
117(5):383-413. 10.4169/000298910X485923
Singh M, Al-Yassin , and Omer SO (2014) Bayesian Estimation of Genotypes Means, Precision and Genetic Gain due to Selection From Routinely Used Barley Trials, Crop science-Crop Breeding & Genetics (C-1). DOI: 10.2135/cropsci2014.02.0111
Smidl V and Quinn A (2007) On Bayesian Principal Component Analysis. Computational Statistics & Data Analysis 51: 4101–4123. 10.1016/j.csda.2007.01.011
Sorensen D and Waagepetersen R (2003) Normal linear models with genetically structured residual variance heterogeneity: a case study. Genetics Research 82:207– 222. 10.1017/S0016672303006426
Ssemakula G, Dixon AGO and Maziya-Dixon B (2007) Stability of total carotenoid concentration and fresh yield of selected yellow-fleshed cassava (Manihot esculenta
S.O. Omer et al. (2015) Int J Appl Sci Biotechnol, Vol 3(2): 210-217 Theobald CM, Talbot M and Nabugoomu F (2002) A Bayesian
approach to regional and local-area prediction from crop variety trials. Journal of Agricultural, Biological, and Environmental Statistics 7(3): 403-419. DOI: 10.1198/108571102230
Verbeke G and Mohlenberghs G (2000) Linear mixed models for longitudinal data. Springer, Berlin
Viele K, and Srinivasan C (2000) Parsimonious estimation of multiplicative interaction in analysis of variance using Kullback-Leibler information. J. Stat. Plan. Infer. 84:201– 219. 10.1016/S0378-3758(99)00151-2
Yan W (2014) Mega-environment Analysis and Test Location Evaluation Based on Unbalanced Multiyear Data,
55 (1): 113-122. DOI: 10.2135/cropsci2014.03.0203
Yan W (2011) GGE Biplot vs. AMMI Graphs for Genotype-by-Environment Data Analysis. Journal of the Indian Society of Agricultural Statistics65(2): 181-193.
Yan W (2001) GGE Biplot-A Windows application for graphical analysis of multi-environment trial data and other types of two-way data. Agron. J. 93:1111-1118. 10.2134/agronj2001.9351111x
Yan W (2013) Biplot analysis of incomplete two-way data. Crop Science 53(1): 48-57. DOI: 10.2135/cropsci2012.05.0301 Yan W, Hunt LA, Sheng Q and Szlavnics Z (2000) Cultivar evaluation and mega-environment investigation based on the GGE biplot. Crop Sci. 40: 597–605. 10.2135/cropsci2000.403597x
Yao Y (2012) Bayesian and Non-parametric Approaches to Missing Data Analysis. Electronic Theses and Dissertations UC Riversid.