MALAWI NATIONAL AIDS COMMISSION
Annual
National Malawi HIV/AIDS Monitoring and Evaluation
Report
Foreword
The Malawi National AIDS Commission (NAC) is proud to present to you its first annual HIV/AIDS Monitoring and Evaluation report on Malawi’s multi-sectoral
HIV/AIDS response. This report, which covers the period January to December 2003,
is one of the major outputs of Malawi’s national HIV/AIDS Monitoring and Evaluation (M&E) system.
The publication of this report is a defining moment for Malawi’s National AIDS Commission (NAC), as it (a) celebrates the fact that Malawi is one of the first countries in sub-Saharan Africa that has produced such an annual HIV/AIDS M&E report, (b)
cements the progress that Malawi has made to quantify and monitor HIV service coverage, and (c) underlines the NAC’s ongoing commitment and dedication in ensuring that HIV/AIDS M&E remains a priority on the national HIV agenda.
Insert photo here
The national HIV/AIDS M&E system is built around 20 formal data sources, submitted at different intervals by a number of NAC’s partners, including the Malawi Government, NGOs, faith-based society and the private sector. The majority of these partners are required to submit the data sources, covering one calendar year of operations, to
NAC’s Department of Planning Monitoring and Evaluation by the 31st of January of the following year.
One of the major data sources is programme monitoring data that is gathered on a monthly basis through the NAC Activity Reporting System (NACARS). The NAC ARS requires that all organisations that implement HIV interventions (prevention, treatment, care and support interventions) send monthly activity reports to NAC on the coverage of HIV/AIDS services at district level.
It is important to track the HIV/AIDS response over time through periodic monitoring and evaluation efforts. However, it is paramount that the information on HIV/AIDS that the NAC collects, captures and summarises in
this annual publication, is used effectively and appropriately by the NAC and its partners to improve HIV policies
and to improve the planning and implementation of future HIV programmes.
I would like to sincerely thank all those organizations that contributed to the monitoring and evaluation process by reporting on activities implemented from July to December 2003 on monthly basis, attending national HIV M&E system orientation workshops and sending annual reports to NAC. I am also very grateful to organizations that have not yet started reporting to NAC but are in the process of making arrangements to do so.
I am confident that in the near future all HIV/AIDS implementers will be active participants in the national HIV M&E system. Although the NAC is the custodians of the national HIV/AIDS M&E system, this system and the information it contains, belongs to the nation. It is our collective privilege to responsibly manage this system and to use it to protect our nation and improve the plight of those affected and infected by this epidemic.
Dr B M Mwale
Executive Director: Malawi National AIDS Commission
Table of Contents
GLOSSARY OF TERMS... 3
1
SUMMARY OF INDICATOR SCORES ... 1
1.1 IMPACT ASSESSMENT... 1
1.2 OUTCOMES ASSESSMENT ... 1
2
INTRODUCTION... 9
3
NATIONAL HIV/AIDS MONITORING AND EVALUATION FINDINGS... 11
3.1 MONITORING NATIONAL MANAGEMENT AND COMMITMENT
... 29
4 RESEARCH
... 30
5
STATUS OF NATIONAL M&E SYSTEM... 32
5.1
R
EPORTING ONM&E
SYSTEM INDICATORS INN
ATIONALM&E
PLAN... 32
5.1.1
Monthly Activity Reporting ... 32
5.1.2
Annual Reports From Data Source Institutions... 32
5.1.3
Shortcomings... 32
5.2
Q
UALITY OF DATA SOURCES... 33
5.3
Q
UALITY AND FREQUENCY OF AD HOC INFORMATION REQUESTS... 34
5.4
S
TATUS OFNAC
DATABASE AND WEBSITE... 34
6
NAC PARTNERS ...
ERROR! BOOKMARK NOT DEFINED.
7
CONCLUSIONS ... 34
8
RECOMMENDATIONS... 36
9
POLICY IMPLICATIONS OF M&E FINDINGS AND RECOMMENDATIONS ... 39
10
NAC’S M&E WORK PLAN... 39
10.1
A
CHIEVEMENTS... 39
10.2
G
APS IN THE2003-2004
PLAN... 40
10.3
A
CTIVITIES FOR2004-2005 (
INCLUDING MAJOR SURVEYS) ... 40
10.4
R
ESEARCH TO BE PUBLISHED IN2004 ... 40
G
LOSSARY OF
T
ERMS
AIDS Acquired Immune Deficiency Syndrome
ARV Anti-retroviral (treatment)
BCI Behavioural Change Intervention
BLM Banja La Mtsogolo
BSS Behavioural Surveillance Survey
CBO Community Based Organization
CHAM Christian Hospital Association of Malawi
CHS Unit Community Health Sciences Unit
CMS Central Medical Stores
CWIQ Core Welfare Indicator Questionnaire
DAC District AIDS Coordinator
DACC District AIDS Coordinating Committee
DHS Demographic and Health Survey
EMAS Education Methods Advisory Services
FBO Faith Based Organisation
FMA Financial Management Agent
GFATM Global Fund to fight AIDS, Tuberculosis, and Malaria
HIV Human Immunodeficiency Virus
HMIS Health Management Information System
HPME Head of Planning, Monitoring and Evaluation at National AIDS Commission
HTS Health Technical Services
IT Information Technology
LMIS Logistics Management Information System
M&E Monitoring and Evaluation
MEIS Monitoring, Evaluation and Information Systems
MOEST Ministry of Education Science and Technology
MOGCS Ministry of Gender and Community Services
MOHP Ministry of Health and Population
MOLVT Ministry of Labour and Vocational Training
NAC Malawi National AIDS Commission
NCPI National Composite Policy Index
NGO Non-governmental Organization
NSO National Statistics Office
NTBS National Blood Transfusion Service
OI Opportunistic Infection
PLWHA Persons Living With HIV/AIDS
PMTCT Prevention of Mother-to-Child Transmission
PSI Population Services International
QSCR Quarterly Service Coverage Report
STD Sexually Transmitted Disease
STI Sexually Transmitted Infection
TWG Malawi Technical Working Group on HIV/AIDS
UNAIDS Joint United Nations Programme on HIV/AIDS
UNGASS United Nations General Assembly Special Session on HIV/AIDS USAID United States Agency for International Development
VCT Voluntary Counselling and Testing
EX EC U TIV E S U M M A R Y
1 S
UMMARY OF
I
NDICATOR
S
CORES
1.1 IMPACT ASSESSMENT
The goal of the NSF is (a) reduced HIV incidence and (b) improved quality of life of those infected and affected. This is measured through these indicators:
Table 1: Impact-level indicator scores for 2003
INDICATOR/S 2003 INDICATOR SCORE
% of people who are HIV-infected (by age group (15 – 19, 20 – 24 and 25 – 49), gender and residence) (GFATM)
14.4% of adults (15 to 49 years), of which 58% are women 760,000 (15 to 49 years) infected
900 000 (all age groups) infected
In rural areas: 12.4% In urban areas: 23.0% Syphilis prevalence among pregnant women (by age
group (15-19, 20 – 24 and 25 – 49), and residence) (GFATM) Overall prevalence (2003): 2.7% Overall prevalence (2001): 3.9% 15 to 19 years: 2.1% 20 to 24 years: 2.5% 25 to 49 years: 3.1%
% of HIV-infected infants born to HIV-infected mothers 26.9%1
% of orphans and vulnerable children2 to whom
community support is provided (by gender and residence)
Data not available for 2003 (only to be included in 2004 DHS survey)
Ratio of current school attendance among orphans to that among non-orphans, among 10-14 year-olds (by gender and residence)
Ratio of 0.94
1.2 OUTCOMES ASSESSMENT
In order for the NSF’s goal in terms of HIV/AIDS in Malawi to be achieved, it is necessary for there to be (a) reduced high-risk sexual behaviours, (b) increased knowledge of HIV/AIDS prevention and (c) decreased stigma and discrimination among general population towards PLWHAs. These are referred to as outcomes, as they represent the result, or outcome, of a number of HIV prevention, care and support interventions. This is measured through the following indicators:
1 Formula-based estimate, using 2002 data
EX EC U TIV E S U M M A R Y
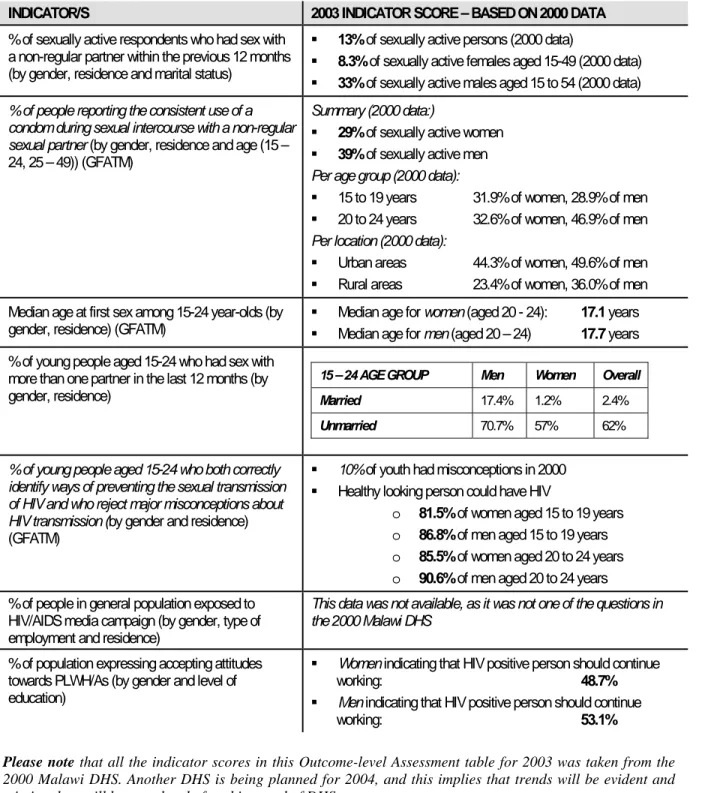
Table 2: Outcome-level indicator scores for 2003
INDICATOR/S 2003 INDICATOR SCORE – BASED ON 2000 DATA
% of sexually active respondents who had sex with a non-regular partner within the previous 12 months (by gender, residence and marital status)
13% of sexually active persons (2000 data)
8.3% of sexually active females aged 15-49 (2000 data) 33% of sexually active males aged 15 to 54 (2000 data)
% of people reporting the consistent use of a condom during sexual intercourse with a non-regular sexual partner (by gender, residence and age (15 – 24, 25 – 49)) (GFATM)
Summary (2000 data:)
29% of sexually active women 39% of sexually active men
Per age group (2000 data):
15 to 19 years 31.9% of women, 28.9% of men 20 to 24 years 32.6% of women, 46.9% of men Per location (2000 data):
Urban areas 44.3% of women, 49.6% of men Rural areas 23.4% of women, 36.0% of men Median age at first sex among 15-24 year-olds (by
gender, residence) (GFATM) Median age for women (aged 20 - 24): Median age for men (aged 20 – 24) 17.1 years 17.7 years % of young people aged 15-24 who had sex with
more than one partner in the last 12 months (by gender, residence)
15 – 24 AGE GROUP Men Women Overall
Married 17.4% 1.2% 2.4%
Unmarried 70.7% 57% 62%
% of young people aged 15-24 who both correctly identify ways of preventing the sexual transmission of HIV and who reject major misconceptions about HIV transmission (by gender and residence) (GFATM)
10% of youth had misconceptions in 2000 Healthy looking person could have HIV
o 81.5% of women aged 15 to 19 years o 86.8% of men aged 15 to 19 years o 85.5% of women aged 20 to 24 years o 90.6% of men aged 20 to 24 years % of people in general population exposed to
HIV/AIDS media campaign (by gender, type of employment and residence)
This data was not available, as it was not one of the questions in the 2000 Malawi DHS
% of population expressing accepting attitudes towards PLWH/As (by gender and level of education)
Women indicating that HIV positive person should continue
working: 48.7%
Men indicating that HIV positive person should continue
working: 53.1%
Please note that all the indicator scores in this Outcome-level Assessment table for 2003 was taken from the
2000 Malawi DHS. Another DHS is being planned for 2004, and this implies that trends will be evident and missing data will be completed after this round of DHS surveys.
EX EC U TIV E S U M M A R Y
1.3 MONITORING PROGRAMME OUTPUTS
Outcomes in terms of HIV prevention, care and support cannot be achieved unless HIV interventions in the areas of HIV prevention, care, support and treatment are being implemented as part of a nationally coordinated effort are carried out by skilled and experienced organisations. Thus, it is necessary to monitor the extent and coverage of HIV interventions and capacity building efforts. This has been done in the national HIV/AIDS M&E system by focusing on the following aspects of the national HIV response:
A
REA1: HIV P
REVENTION(
FOR REDUCEDHIV
INCIDENCE)
A. Information, Education, and Communication (IEC), in order to have an improved,
standardized, comprehensive, and effective IEC strategy
INDICATOR/S 2003 INDICATOR SCORE
# of HIV/AIDS radio/television programs produced and number of hours aired in the past 12 months (by type of media (radio/television))
1 055 HIV/AIDS radio and television
programmes, with 46 hours for radio and 36 hours for TV programmes (July – Dec 2003) # of HIV/AIDS brochures/booklets produced and number
of copies distributed in last 12 months (by district) (July – Dec 2003) 12 060 HIV/AIDS brochures/booklets produced
27 538 HIV/AIDS brochures/booklets distributed
(July – Dec 2003)
B. Promotion of Safer Sex Practices (ABCs), in order to have reduced high-risk sexual
behaviour, especially among priority groups such as youth
INDICATOR/S 2003 INDICATOR SCORE
% of schools with teachers who have been trained in life-skills-based HIV/AIDS education and taught it during the last curriculum year (GFATM)
6.2% of primary and secondary schools – as per 2002
UNGASS report
Later information from Ministry of Education – teachers from 1577 out of 1808 primary schools were trained, but no data on whether the subject has been taught. # of young people aged 15 – 24 exposed to
life-skills-based HIV/AIDS education in past 12 months (by gender, district and whether they are in-school or out-of-school youth)
21,114 young people aged 15 to 24
8,039 (38%)out of school youth 13,075 (62%) in-school youth # of condoms distributed by social marketing
agencies in last 12 months (by type of outlet, district and type of condom)
24,991,484 condoms distributed (Nov 2002 – Oct 2003)
10,764, 316 were sold through social marketing agencies
# of condoms distributed to end user1 in last 12
months (by type of condom and district) CHAM, private institutions and NGOs For 2003, 1,421,272 condoms per month by MOHP,
1 These are condoms distributed by MOHP, CHAM, NGOs and private institutions, and NOT through a social marketing programme. Distribution is tracked in
EX EC U TIV E S U M M A R Y
C. Prevention of Mother-to-Child Transmission (PMTCT), to have reduced mother-to-child
(vertical) transmission of HIV
INDICATOR/S 2003 INDICATOR SCORE
% of HIV+ pregnant women receiving a complete course of ARV prophylaxis to reduce the risk of MTCT (by type of provider, district and age (0 – 24, older than 24) (GFATM)
2.0% in 2003
0.9% in 2002 (UNGASS indicator
% of health facilities providing at least the minimum package of PMTCT services in the past 12 months (by location and district)
3.6% of health facilities provide PMTCT
services % of pregnant women who have been counselled in
PMTCT, tested and received their serostatus results in the past 12 months (by age group (0 – 24, older than 24), type of institution (private/public) and district)
26 791 were tested for HIV (according to HMIS,
% tested not known)
% of pregnant women that have been tested, who are HIV positive in the past 12 months (by age group (0 – 24, older than 24) and district)
According to HMIS: 13%
According to NAC ARS data: 18%
% of HIV positive mothers who have been provided with 3 month supply of alternative infant feeding in the past 12 months (by age group (0 – 24, older than 24) and district)
456 women (% not known, only partial reporting
by one organisation) % of HIV positive pregnant women offered PMTCT who
are referred for care and support services in the past 12 months (by age group (0 – 24, older than 24) and district)
62% of those who tested positive were referred
for care and support services (partial reporting from one organisation only)
D. STI Treatment, in order to have improved management and reduced incidence of STIs other
than HIV
INDICATOR/S 2003 INDICATOR SCORE
% of patients with STIs at health facilities who have been diagnosed, treated, and counselled according to national management
guidelines (by gender and age (> 20, and 20 years and older) (GFATM)
Data not available, as the MOHP Health Facility Survey was not undertaken in 2003
% of health facilities with STI drugs in stock and no STI drug stock outs of greater than one week within last 12 months (by district) – list of drugs selected for survey are available from NAC
Frequent drug stock outs are experienced in every site # of STI cases seen at health facilities in the past 12 months (by type
of case (new case or referred partner), district and by gender) Jan - Sept 2003 138 874 new STIs diagnosed from
E. Blood Safety, Injection Safety, and Health Care Waste Management, in order to have
improved blood safety, injection safety, and health care waste management
INDICATOR/S 2003 INDICATOR SCORE
% of health facilities that apply national guidelines for blood
screening, storage, distribution & transfusions (by district) No information available, as MOHP Health Facility Survey was not undertaken in 2003 % of health care facilities that apply national standards for
infection prevention and health care waste storage and disposal (by district)
No information available, as MOHP Health Facility Survey was not undertaken in 2003
% transfused blood units in last 12 months that have been screened for HIV according to national guidelines (by district)
No information available, as NTBS has not been set up
EX EC U TIV E S U M M A R Y
F. Voluntary Counselling and Testing (VCT), in order to have improved access to ethically sound
VCT services
INDICATOR/S 2003 INDICATOR SCORE
% of districts where VCT sites (integrated or stand alone) are located as per national guidelines (every 8 kms in rural areas, and 1 site for every 10 000 people in urban areas)
0% of districts in Malawi
# of VCT clients tested for HIV at VCT sites and receiving their serostatus results in the past 12 months (by age (0 – 12, 12+ to 24 , older than 24), district and gender)
86,631 persons (excluding PMTCT) provided with VCT by the
public/NGO sectors in 2002
22 647 persons from July – Dec 2003, of which:
61% men 39% women
10,347 were aged 15 to 24 12 300 were aged 25 to 49 % of clients who have been tested for HIV, who are
HIV positive in the past 12 months (by age (0 – 12, 12+ to 24 , older than 24), district and gender)
22.0 % tested positive (Jul – Dec 2003), of which:
58% men 42% women % of HIV positive VCT clients who are referred to care
and support services in the past 12 months (by age (0 – 12, 12+ to 24 , older than 24), district and gender)
81.7% (4095) referred to support services – of these:
23% younger than 24 77% older than 24 61% females 39% males
A
REA2: HIV/AIDS T
REATMENT, C
ARE,
ANDS
UPPORT(
TOI
MPROVE THEQ
UALITY OFL
IFEOF INDIVIDUALS AND FAMILIES INFECTED AND AFFECTED BY
HIV/AIDS)
A. Clinical Care (including OI Treatment and ARV Therapy), to ensure increased access to
improved and comprehensive health treatment for persons infected with HIV
INDICATOR/S 2003 INDICATOR SCORE
% of persons with advanced HIV infection receiving ARV therapy (By age group (0-12, 12+ to 20, older
than 20), gender and by type of health facility (public/private)) (GFATM)
At least 1,534 persons with advanced HIV (Jul - December 2003):
676 (44%) younger than 20 858 (56%) older than 20 % of AIDS cases managed for OIs in the past 12
months (by gender and district) (GFATM)
cotrimoxazole prophylaxis to 5 053 HIV-positive adults and 584 HIV positive children
isoniazid prophylaxis to no one
cotrimoxazole to 87% of the 2,734 TB patients who tested positive for HIV
% of health facilities with drugs for Opportunistic Infections in stock and no stock outs of greater than 1 week in last 12 months (by district)
No information available, as MOHP Drug Stock Supply
Survey for 2003 was not undertaken % of health facilities where ARV services are being
offered with no ARV drug stock outs of greater than 1 week in last 12 months (by district)
No information available, as MOHP Drug Stock Supply
Survey for 2003 was not undertaken, and ARV drugs are not yet on the list of drugs to be surveyed
% of detected TB cases who have successfully completed the treatment (by gender, district and by type of TB)
EX EC U TIV E S U M M A R Y
B. Community and Home-based Care and Support, to provide improved quality of life for
PLWAs and affected communities:
INDICATOR/S 2003 INDICATOR SCORE
# of households receiving external assistance in the past 12 months to care for adults who have been chronically ill for 3 or more months during the past 12 months (by residence, district and type of help)
19 706 households (partial information,
from July to December 2003) # of persons enrolled at PLWA organisations in the part 12 months
(by gender, district and age group (0 – 15, 15+ to 24, older than 24))
1,038 persons (July - Dec 2003)
94% aged 25 years and older 61 PLWAs were 15 to 24 # of community home based care visits in the past 12 months (by
residence (rural / urban), district and by type of visit (health care worker / volunteer))
54,070 visits (July – Dec 2003), of which
33,086 in rural areas 20,984 in urban areas 13% by health care workers 87% by volunteers
A
REA3: HIV/AIDS I
MPACTM
ITIGATIONTo ensure increased social, financial and legal support for orphans and vulnerable children:
INDICATOR/S 2003 INDICATOR SCORE
# of orphans and other vulnerable children receiving care/support in past 12 months (by type of support (psychosocial, nutrition, financial), district and gender)
24,767 OVCs (July – Dec 2003)
# of community initiatives or community organizations receiving
support to care for orphans in the past 12 months (by district) No data available, as the grants mechanism was not yet in place
A
REA4: S
ECTORALM
AINSTREAMINGTo provide an increased level of resources, effort, and coordination to respond to the HIV/AIDS epidemic in all sectors:
INDICATOR/S 2003 INDICATOR SCORE
% of large private companies and public institutions that have HIV/AIDS workplace policies and mainstreaming programmes (by type of institution (public/private) and by type of expenditure) (GFATM)
No data available, as the workplace survey was not undertaken by the Ministry of Labour
# and % of employees and their spouses in all sectors that have been reached by interventions defined in their employers’ workplace policy in the past 12 months (by sector (public/private/civil society), gender and type of support (prevention / care & support))
473 employees, of which 63% women,
EX EC U TIV E S U M M A R Y
A
REA5: C
APACITY BUILDING AND PARTNERSHIPSTo provide increased capacity and participation in decision-making and action among all organizations engaged in the national HIV response:
INDICATOR/S 2003 INDICATOR SCORE
Amount and % of overall funding received by the NAC that is granted to CBOs, local NGOs, international NGOs, FBOs, government, private sector, educational institutions and international organisations in the last 12 months (by type of organisation) (GFATM)
# of CBO alliances created by the NAC or in which the NAC participates in order to increase demand for and supply services to target population (GFATM)
Average # of days for grant proposals received by NAC in the past 12 months to be processed (from when the grant proposal is received to when funding is provided)
# of project staff and volunteers trained in HIV/AIDS related issues for the purposes of HIV interventions in the past 12 months (by gender and district)
1.4 MONITORING NATIONAL EFFORT
1.4.1 N
ATIONALM
ANAGEMENT ANDC
OMMITMENTTo monitor the goal of this area, i.e. to ensure improved national commitment, leadership, and management of the national response to the HIV/AIDS epidemic, the following indicators have been agreed upon:
INDICATOR/S 2003 INDICATOR SCORE
Amount of funds spent on HIV/AIDS (by category of expenditure and funding
source (government, civil society and donor agencies))
National Composite Policy Index (by questionnaire component)
# of times in which the NAC decision-making structures operate to review progress data or to decide program management issues in the past 12 months (# of meetings, agenda, list of participants, decisions made) (GFATM)
1.4.2 M
ONITORING ANDE
VALUATIONTo generate empirical data and information through biological and behavioural surveillance, research, programme monitoring, and financial monitoring that will direct HIV/AIDS prevention, care and support, and impact mitigation efforts:
INDICATOR/S 2003 INDICATOR SCORE
Dissemination of annual publication, the National HIV/AIDS M&E Report, by NAC at the annual NAC M&E dissemination seminar (by sector)
% of organisations that have submitted the required number of completed NAC Activity Report Forms on time to NAC in the past 12 months (by type of organisation and whether the organisation is funded by NAC or not)
Annual sentinel surveillance at antenatal clinics has been completed on time by MOHP
EX EC U TIV E S U M M A R Y
Development of functioning, accessible research inventory database that registers HIV/AIDS-related research implemented in Malawi
% of HIV/AIDS-related research studies in Malawi that are in line with national research strategy, and tracked annually in the national HIV/AIDS research database (by HIV programme area)
% of new research studies submitted to the NAC research inventory database in the past 12 months that have been approved for submission at the annual HIV/AIDS Research conference (by HIV programme area)
EX EC U TIV E S U M M A R Y
2 I
NTRODUCTION
T
O
M
ALAWI
HIV/AIDS M&E
SYSTEM
Malawi’s response to HIV
Upon diagnosis of the first AIDS case in Malawi, the Government responded primarily with a health sector-driven response from 1985 - 1998. In October 1999, the National HIV/AIDS Strategic Framework (NSF) was adopted. This changed the focus for the Malawi Government and led, amongst other developments, to the formation of the Malawi National AIDS Commission (NAC).
The Malawi National AIDS Commission (NAC)
The NAC1, established in July 2001, was mandated to coordinate Malawi’s national HIV/AIDS response, within the
auspices of the goal of the NSF (to reduce incidence of HIV and other sexually transmitted infections and improve the quality of life of those infected and affected by HIV/AIDS). Further, the NAC was also mandated to provide technical and financial support to implementing agencies and to mobilize resources to support the various initiatives underway against HIV/AIDS. Finally, the Commission was mandated to monitor and evaluate progress and impact of HIV/AIDS prevention, care and impact mitigation interventions.
Following 2 years of successful discussions and negotiations to source funding for Malawi’s national HIV response, the NAC underwent a further metamorphosis in 2003 when the NAC also assumed the role of a grants disbursement agency. This new role implied that the NAC was responsible to disburse funds to HIV implementers on a grants-basis and in a manner that would be transparent and accountable to the NAC’s various donors. One of the requirements of the donors that provided the funding for the NAC’s HIV/AIDS grants mechanism, is that the NAC had to develop a system with which to monitor and evaluate the country’s response to HIV/AIDS.
The National HIV/AIDS M&E System
The purpose of Malawi’s National HIV/AIDS M&E system is to allow the country to track its progress towards the goals and objectives as stated in the National HIV/AIDS Strategic Framework (NSF). Considering the steady spread of HIV/AIDS, it is important to develop appropriate monitoring and evaluation tools to enable Malawi to assess whether programmes are meeting goals and producing the desired impact on the lives of individuals, families, and communities. The national HIV/AIDS M&E system is documented in the national HIV/AIDS M&E plan. The National HIV/AIDS M&E Plan
This Plan is documented in two parts - Part A, the Conceptual Framework and Part B, the M&E operations plan.
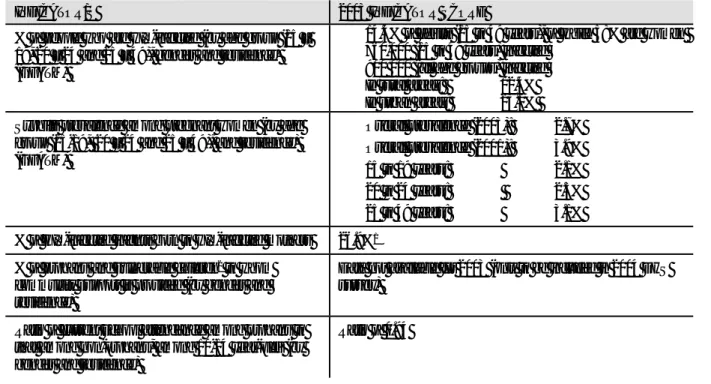
Whilst Part A is theoretical and conceptual in nature, Part B focuses on all operational aspects associated with the operationalisation of Malawi’s national HIV/AIDS M&E system. To this extent, Part B has been conceptually organised into the following sections: (a) definition of 59 national HIV indicators at impact, outcome, and output levels, (b) nomination of a set of 20 data sources through which information for the 59 national HIV indicators would be gathered, (c) description of information products, or reports, which would be produced by the NAC on a periodic basis and used by the NAC to communicate M&E findings to its partners in the fight against HIV and, finally (d) distribution to stakeholders, which included a description of the mechanisms and stakeholders to whom the information products would be disseminated. This is illustrated below:
It is essential to note that whilst the Malawi NAC is the custodians of the national HIV/AIDS M&E system and
carries the responsibility for the operationalisation of the HIV/AIDS M&E plan, that this is a national HIV/AIDS
M&E system and as such, the results, conclusions and recommendations contained in this report, is one of the
1 The NAC is composed of a Board of Commissioners and a Secretariat (NAS). The Board's 19 commissioners are drawn from civil society (including faith communities) and the public and private sectors.
EX EC U TIV E S U M M A R Y
The M&E Plan emphasizes Malawi's commitment to fighting the epidemic both on the local scene and at international level. Malawi is signatory to multiple international declarations, such as the United National Special Session on HIV/AIDS Declaration (UNGASS) and the Millennium Development Goals.
3 D
ETAILED
F
INDINGS
3.1 I
MPACTA
SSESSMENT% OF PEOPLE WHO ARE HIV-INFECTED (GFATM)
The estimated HIV/AIDS prevalence in adults (15 to 49 years) in 2003 in Malawi was 14.4%, with a range from 12 to 17%. Prevalence is the percent of the population that is infected with HIV. This level of HIV infection in the adult population has remained constant for the last seven years. This means that there are currently about 760,000 adults aged 15 to 49 years infected with HIV, 58% of those infected are women. About 440 000 women were infected compared to 320 000 men. The new 2003 prevalence estimates also indicate that HIV infection among adults in urban (23%) areas is almost twice as high as in rural areas (12.4%), and about twice as high in the South as in the North and Central regions.
About 70 000 children aged less than 15 years were infected. In total about 900 000 Malawians of all ages were infected with the HIV virus in 2003.
SYPHILIS PREVALENCE AMONG PREGNANT WOMEN
Syphilis prevalence among antenatal clinic attendees was 2.7%. Prevalence was not significantly different among women coming from different residences as follows: rural areas (2.8%), semi-urban (2.2%) and urban (2.5%). Syphilis prevalence by age was as follows 15 to 19 years (2.1%), 20 to 24 years (2.5%) and 25 to 49 (3.1%). In 2001, prevalence was 3.9%.
% OF HIV-INFECTED INFANTS BORN TO HIV-INFECTED MOTHERS
About 26.9% of infants born to HIV-infected mothers were infected with HIV. This data is based on 2002 data, using the UNGASS formula for calculating this indicator score.???? Insert formula
% OF ORPHANS AND OTHER VULNERABLE CHILDREN TO WHOM COMMUNITY SUPPORT IS PROVIDED
Information was not available for this indicator at outcome level. This is due to the fact that this question was not part of the 2000 Malawi Demographic and Health Survey (DHS). However, (a) this data will be collected during the 2004 DHS and (b) some information was collected at output/process level; it has been included in section ??? of this report.
RATIO OF CURRENT SCHOOL ATTENDANCE AMONG ORPHANS TO THAT AMONG NON-ORPHANS,
AMONG 10-14 YEAR-OLDS
The ratio of school attendance among orphans to that among non-orphans among 10-14 year olds was 0.941.
3.2 O
UTCOMESA
SSESSMENT% OF SEXUALLY ACTIVE RESPONDENTS WHO HAD SEX WITH A NON-REGULAR PARTNER
Overall, 13% of sexually active females and males reported to have had sex with a non-regular partner in
20001. Amongst sexually active females aged 15-49, 8.3% respondents reported to have had sex with
B IB LIO G R A PH Y
regular partners, in the previous 12 months in the year 2000, while 33% of sexually active males aged 15 to
54 reported likewise1.
% OF PEOPLE REPORTING THE CONSISTENT USE OF A CONDOM DURING SEXUAL INTERCOURSE
WITH A NON-REGULAR SEXUAL PARTNER (GFATM)1
Condom use during last sexual intercourse with a non-cohabiting partner was 29% and 39% respectively among sexually active women and men.
Condom use by age among young females was as follows; 31.9% among women aged 15 to 19 years and 32.6% among women aged 20 to 24 years. More females in urban areas (44.3%) compared to rural areas (23.4%) reported using condoms during last sexual intercourse with non-cohabiting partners.
Similarly, condom use by age among young males was as follows; 28.9% among men aged 15 to 19 years and 46.9% among men aged 20 to 24 years. More males in urban areas (49.6%) compared to rural areas (36.0%) reported using condoms during last sexual intercourse with non-cohabiting partners.
MEDIAN AGE AT FIRST SEX AMONG 15-24 YEAR-OLDS (GFATM)
Median age at first sexual intercourse for females aged 20 to 24 years was 17.1 years while that for males of the same age group was 17.7 years. Median age at first sexual intercourse for persons aged 20 to 24 years was 17.8 and 17.0 years in urban and rural areas respectively.
% of young people aged 15-24 who had sex with more than one partner in the last 12 months
Amongst married youth aged 15-24 years, 2.4% had sex with more than one partner; 1.2% among females and a higher proportion (17.4%) among males. The proportion was very high for unmarried youth aged 15 to 24 years (62%); 57% among unmarried females and 70.7% among unmarried males.
High percentages of unmarried youth aged 15 to 19 years had sex with more than one partner in the previous 12 months as follows; boys (70.6%) and girls (67.5%). Among persons aged 20 to 24 years, more unmarried men (70.7%) had sex with more than one partner compared to unmarried women (42.5%).
Married young men (29.4%) and women (2.2%) aged 15 to 19 had sex with more than one partner in the previous 12 months. Among persons aged 20 to 24 years, more married men (26.4%) had sex with more than one partner compared to women (0.8%).
% of young people aged 15-24 who both correctly identify ways of preventing the sexual transmission of HIV and who reject major misconceptions about HIV transmission (UNGASS)
At least eighty-one percent (81.5%) of women aged 15 to 19 years and 85.5% of women aged 20 to 24 years reported that a health looking person could have HIV. Comparatively a higher percentage of men aged 15 to 19 years (86.8%) and those aged 20 to 24 years (90.6%) reported that a health looking person could have HIV. At least 10% of the youth had misconceptions about a healthy looking person in 2000.
% of people in general population exposed to HIV/AIDS media campaign data not available
% of population expressing accepting attitudes towards PLWAs
High percentages of women (93.6%) and men (95.9%) expressed willingness to care for AIDS affected relatives. However lower percentages of women (48.7%) and men (53.1%) believed an HIV positive co-worker should be allowed to keep working. The latter would reflect the true attitude towards PLWAs.
B IB LIO G R A PH Y
3.3 P
ROGRAMMEM
ONITORINGO
UTPUTA
SSESSMENT3.3.1 HIV PREVENTION AND ADVOCACY
a) ABCs of Safe Sex
% of schools with teachers who have been trained in life-skills-based HIV/AIDS education and taught it during the last curriculum year (GFATM)
Information was only available for schools in Southern Malawi. According to reports from MOEST at least 1,577 schools in the southern region of Malawi had primary school teachers trained in standard 4 life skills
based education1 out of 1,808. But there is no evidence that the trained teachers taught the subject.
In 2003, about 4,385 primary school teachers were trained in life-skills based HIV education in the southern region of Malawi. About 840 secondary school teachers and 104 tutors from teachers training colleges were trained in throughout Malawi.
In 2002 6.2% of schools had teachers trained in life-skills-based education who taught the subject during
the last academic year in the country2.
# of young people aged 15 - 24 exposed to life-skills-based HIV/AIDS education
From July to December 2003 at least 21,114 young people aged 15 to 24 were exposed to life-skills-based
HIV/AIDS education. Out of the total 8039 (38%)were out of school youth while 13,075 (62%) were
in-school youth. Life skills based education was reported for 8 districts only. These are Dedza, Lilongwe, Mchinji, Mzimba, Nkhotakota, Nsanje, Salima and Thyolo. More male in-school-youths 9315 (71%) were exposed to HIV/AIDS education than females 3,760 (29%). Similarly, more male out of school youths 4373 (54%) were exposed to HIV/AIDS education than females 3,666 (46%).
Life-skills-based HIV/AIDS education was only reported in 8 districts; 1 in Northern Region, 5 in the Central Region and 2 districts in the Southern Region of the country.
Number of young people aged 15 - 24 exposed to life-skills-based HIV/AIDS education, July to December 2003
In school youth
Out of school youth
District
Male Female Subtotal Male Female Subtotal Total Dedza 900 - 900 - - - 900 Lilongwe 208 458 666 76 92 168 834 Mchinji 176 135 311 244 206 450 761 Mzimba 122 211 333 123 133 256 589
1 MOEST Division Reports on training of standard 4 teachers and head teachers in life skills education 2 Follow-up to the declaration of commitment on HIV/AIDS (UNGASS):Country report for Malawi 2002.
B IB LIO G R A PH Y Nkhotakota 69 56 125 40 22 62 187 Nsanje 5 5 10 5 - 5 15 Salima 69 23 92 69 44 113 205 Thyolo 7,766 2,872 10,638 3,816 3,169 6,985 17,623 Total 9,315 3,760 13,075 4,373 3,666 8,039 21,114
# of condoms distributed by social marketing agencies in 2003
A total of 24,991,484 condoms were distributed free or sold to consumers by public/NGO sectors from
November 2002 to October 20031.
Seventy eight percent of socially marketed condoms were sold by PSI. BLM sold 2, 350, 000 condoms. Therefore approximately 10,764,316 socially marketed condoms were sold in 2003. PSI condoms are widely sold in the country throughout the country. However, lower sales were reported for Nsanje, Chitipa and Likoma districts.
PSI condom sales by district, 20032
Region District Condoms
(number) Condoms (percent) South Balaka Blantyre Chikwawa Chiradzulu Machinga Mangochi Mulanje Mwanza Nsanje Phalombe Thyolo Zomba 110,700 2,769,840 229,824 6,480 216,864 351,684 87,480 66,852 26,784 88,128 127,008 228,996 1.32 33.00 2.73 0.00 3.00 4.00 1.00 1.00 0.32 1.00 2.00 3.00 South Total 4,310,640 51.00
1 Coverage of essential HIV/AIDS services in Malawi 2 PSI annual report
B IB LIO G R A PH Y Centre Dedza Dowa Kasungu Lilongwe Mchinji Nkhotakota Ntcheu Ntchisi Salima 109,980 165,636 320,760 1,850,580 100,296 155,808 184,680 41,472 154,476 1.00 2.00 4.00 22.00 1.00 1.85 2.00 0.49 1.84 Centre Total 3,083,688 37.00 North Chitipa Karonga Likoma Mzimba Mzuzu Nkhatabay Rumphi 12,852 204,012 193,176 327,780 129,168 153,000 0.00 2.00 2.30 4.00 1.54 2.00 North Total 1,019,988 12.00
PSI condom sales by outlet, 2003
Out let Number of Condoms
Chain W/S 981,072 Government 75,168 Independent retailers 605,052 Independent W/S 3,258,036 Institutions 332,640 NGOs 2,340,720 Private hospitals 21,600 Retain Chain 338,904 High Risk 325,476 Other 135,648 Total 8,414,316 # of MOHP condoms dispensed to end user in 2003
B IB LIO G R A PH Y
Consumption of condoms for the year 2003 was 1,421,272 pieces per month. The data was collected from the LMIS-07 and LMIS-06, which were part of Logistics Management Information Systems forms for the
Reproductive health Logistics Management Information System (RHLMIS)1. The condom figure represents
condoms distributed by MOH, CHAM, Private institutions and NGOs.
b) Information Education and Communication
# of media HIV/AIDS radio/television programs produced and number of hours aired
At least 1055 HIV/AIDS radio and television programmes were produced from July to December 2003. These programmes comprised about 46 hours for radio and 36 hours for TV programmes.
Media HIV/AIDS radio/television programs produced and number of hours aired, July to December 2003
Process Radio Television Total
# Programs produced 762 293 1,055
# Hours Aired 46 36 82
# of HIV/AIDS brochures/booklets produced and number of copies distributed
From July to December 2003 at least12 060 HIV/AIDS brochures/booklets were produced and 27 538
were distributed for public consumption. Brochures book lets were distributed at least in 12 districts from
July to December 2003.
# of HIV/AIDS brochures/booklets produced and number of copies distributed
District Number of Brochures/Booklets Produced Number of Brochures/Booklets distributed Balaka - 150 Blantyre 200 8,352 Dowa 7,375 7,485 Kasungu - 12 Machinga 888 3,770 Mangochi - 247 Mzimba 39 378 Mzuzu 50 10 Nkhatabay - 10 Nsanje 4 4 Phalombe 3,000 3,000 Thyolo 504 4,120
B IB LIO G R A PH Y Total 12,060 27,538
c) Infection Prevention and Health Care Waste Management
% of health facilities that apply national guidelines for blood screening, storage, distribution & transfusions.
Information not available
% of health care facilities that apply national guidelines for infection prevention and safe health care waste storage and disposal
In 2002, 75% of health facility departments did not have more than 2 health care waste containers in the
country. As many as 47% of health facility departments did not have safety boxes for sharps1.
% transfused blood units in last 12 months that have been screened for HIV according to national guidelines
Information not available
d) Prevention Of Mother to Child Transmission
% of HIV positive pregnant women receiving a complete course of ARV prophylaxis to reduce the risk of MTCT (GFATM)
According to the 2003 sentinel surveillance, 19.8% of pregnant women were HIV positive. 553 267 births were expected in 2003. Therefore about 109 547 pregnant women were HIV positive. About 2198 women
received ARV to prevent mother-to-child transmission2. Therefore, only 2% of HIV positive pregnant
women received a complete course of ARV prophylaxis to reduce the risk of MTCT.
There is evidence of provision of nevirapine for PMTCT in 10 districts only, 3 in the Northern Region, 3 in the Central Region and 4 in the Southern Region.
PMTCT prophylaxis 20032
Hospital District Number of women
given nevirapine
Chitipa District Chitipa 0
Karonga (KPS) Karonga 18
Livingstonia Mission Rumphi 10
Ekwendeni 33 Embangweni
Mzimba
52
Kasungu District Kasungu 11
1 Injection safety and health care waste management policy and action plan assessment report 2 Report of a Country-Wide Survey of HIV/AIDS Services in Malawi: for the year 2003. MOH, NAC
B IB LIO G R A PH Y
St Annes Mission Nkhotakota 11
LLW Central Hosp 1600 LLW Mlale Mission 0 Likuni Mission 24 St Gabriels Mission Lilongwe 53
Mangochi District Mangochi 0
Thyolo District 255
Malamulo Mission Thyolo 2
Mwanza District Mwanza 87
Chiradzulu District 23
St Josephs Mission Chiradzulu 19
% of health facilities providing at least the minimum package of PMTCT services in 2003
About 473 hospitals, rural hospitals and health centres provide ANC services in the country1. Seventeen
health facilities2 (3.6%) provided PMTCT services in 2003.
% of pregnant women who have been counselled, tested and receiving their serostatus results in 2003
Number of women tested for HIV 20031
Hospital Number of women
tested for HIV Number of women HIV
positive Chitipa District 37 3 Karonga (KPS) 867 83 Livingstonia Mission 894 76 Ekwendeni 328 42 Embangweni 3396 123 Kasungu District 131 29 St Annes Mission 12 12 LLW Central Hosp 11823 1916 LLW Mlale Mission 111 6 Likuni Mission 297 52 St Gabriels Mission 3828 158 Mangochi District 1 0 Thyolo District 2650 513 Malamulo Mission 19 2 Mwanza District 1565 205 Chiradzulu District 731 144 St Josephs Mission 101 21
1 HMIS Bulletin: Annual report, July 2002-June 2003
B IB LIO G R A PH Y
At least 26 791 pregnant women were tested for PMTCT as shown in table ##.
From July to December 2003 at least 1850 pregnant women were counselled tested and received their results from the following districts: Mwanza, Mzimba, Mzuzu and Thyolo. Of these 1040 (56.2%) were aged 15 to 24 while 810 (43.8%) were aged 25 to 49 years.
% of pregnant women that have been tested in 2003, who are HIV positive
At least 3,383 (13%) pregnant women who were tested were HIV positive1. See table ##.
According to NACARS 337 out of the 1,850 who were tested between July and December 2003 were HIV positive (18%).
% of HIV positive pregnant women who have been provided with 3 month supply of alternative infant feeding in 2003
From July to December 2003 at least 456 women were provided with supplies of alternative infant feeding. These were only reported for Thyolo by MSF Luxemborg..
% of HIV positive pregnant women offered PMTCT who are referred for care and support services
Out of 337 who tested positive at least 209 (62%) pregnant women were referred for care and support services from July to December 2003.
PMTCT clients referred for care and support services, July to December 2003
District Younger than 24 Older than 24
Kasungu - 6 Mwanza 79 67 Mzuzu 1 5 Thyolo 25 26 Total 105 104 e) Treatment of STIs
#% of patients with STIs at health facilities who have been diagnosed, treated and counselled according to national management guidelines (GFATM)
Data for this indicator is not available due to the fact that the data source required to provide this indicator score, an MOHP-coordinated health facility survey, did not take place in time.
#% of health facilities with no STI drug stock outs of >1 week within last 12 months
data not available
B IB LIO G R A PH Y
Health centres received 2 tins of STI drugs per month1. This could not take them to the end of the month
before getting another supply. As such there were frequent stock outs not because the country has no drugs but because the district did not supply enough quantity.
# of STI cases seen at health facilities in 2003
At least 138 874 new sexually transmitted infections were diagnosed from January to September 2003.
f) Voluntary Counselling and Testing
% of districts where VCT sites (integrated or stand alone) are located as per national guidelines (every 8 kms in rural areas, and 1 site for every 10 000 people in urban areas)
Zero districts had VCT sites, integrated or stand alone, located every 8 kms in rural areas and one site for every 10,000 people in urban areas.
# of clients tested for HIV at VCT sites and receiving their serostatus results
86,631 persons (excluding PMTCT) were provided with HIV counselling and testing by the public/NGO sectors in 2002. Seventy sites (public/NGO) offered VCT services in the country. From July to December 2003 at least 22 647 persons were offered VCT. Out of these, 13,752 (61%) were males, 8,895 (39%) were females, 10,347 (46%) were aged 15 to 24 and 12,300 (54%) were aged 25 to 49 years.
VCT was reported only in 13 districts (46% of districts), 1 in the Northern Region, 6 in the Central Region, and 5 districts in the Southern Region.
Clients tested for HIV at VCT sites and receiving their serostatus results, July to December 2003.
Male Female District 15-24 25-49 15-24 25-49 Total Blantyre 571 496 266 263 1,596 Dedza 1 16 1 11 29 Dowa 60 102 44 54 260 Lilongwe 3,375 3,355 1,430 1,253 9,413 Mangochi 5 20 10 13 48 Mchinji - - - 6 6 Mwanza 1 10 4 7 22 Mzimba 412 419 184 392 1,407 Mzuzu 17 59 38 74 188 Nkhotakota - 5 3 - 8 Nsanje 7 39 13 37 96 Salima - 2 - 6 8 Thyolo 2,109 2,671 1,796 2,990 9,566 Total 6,558 7,194 3,789 5,106 22,647
B IB LIO G R A PH Y
% of VCT clients who have been tested for HIV, who are HIV positive
At least 5 013 (22%) were positive amongst those accessing VCT from July to December 2003. More females 2 916 (58%) were HIV positive than males 2097 (42%) though more males attended VCT sites. More clients tested HIV positive among people aged more than 24 years, 3 886 out of 12 300 (31.6%), compared to youth aged 15 to 24. Amongst the youth, 1127 out of 10 347 (10.9%) tested positive.
VCT clients who have been tested for HIV, who are HIV positive, July to December 2003
Male Female Total
District 15-24 25-49 15-24 25-49 Blantyre 23 132 58 117 330 Dedza 1 1 - - 2 Dowa - 16 6 8 30 Lilongwe 85 491 189 460 1,225 Mangochi - 5 - 1 6 Mchinji 4 7 2 6 19 Mwanza 1 7 2 5 15 Mzimba 4 50 24 57 135 Mzuzu 6 15 8 17 46 Nsanje 1 29 5 25 60 Salima 2 10 - 35 47 Thyolo 207 1,000 499 1,392 3,098 Total 334 1,763 793 2,123 5,013
% of HIV positive VCT clients who are referred to care and support services in the past 12 months
Out of those who tested positive, 4,095 (82%) were referred to support services; 937 (23%) were aged 24 and below while 3,158 (77%) were aged above 24 years. More females (61%) were referred compared to men (39%).
HIV positive VCT clients who are referred to care and support services, July to December 2003
24 years and below Above 24 TOTAL
District
Male Female Male Female
Blantyre 18 126 44 100 288
Kasungu - - - 8 8
B IB LIO G R A PH Y Mchinji 6 13 7 33 59 Mzimba 2 13 41 43 99 Mzuzu 11 11 38 24 84 Nsanje 1 4 26 18 49 Salima 2 - 10 35 47 Thyolo 117 415 864 1,104 2,500 Total 225 712 1,378 1,780 4,095 3.3.2 TREATMENT CARE AND SUPPORT a) Clinical Care % of persons with advanced HIV infection receiving ARV therapy (GFATM) Ever since ART programmes started in the country, 6, 414 patients had been started on ARV drugs1 by the end of 2003. At least 3,703 patients started ART in 20031. At least 1534 persons with advanced HIV were on ARV from July to December 2003; 676 (44%) were aged 20 and below whereas 858 (56%) were aged over 20 years. Persons with advanced HIV infection receiving ARV therapy, July to December 2003 Gender <= 20 years > 20 years Grand Total Male 191 103 294 Female
485 755 1,240
Total 676 858 1,534
Nine sites were offering ARV by the end of 2003. Six were paying sites while 3 were for free (these are Chiradzulu Hospital, St Joseph Hospital and Thyolo Hospital supported by MSF Luxemborg). Three of the health facilities providing ARV therapy are public institutions.
Health facilities providing ARVs in 2003
Health facility No. months
providing the service No. patients started on ART in 2003 Type of health facility Ekwendeni MH 6 59 CHAM
B IB LIO G R A PH Y Lighthouse LLW 26 1068 Private Mtengwathenga MH 12 37 CHAM
ABC Hospital – LLW 12 100 Private
Mikoke Hosp Ntcheu 12 20
CHAM
Chiradzulu DH 30 1472 Public
St Josephs
MH Nguludi 11 88 CHAM
Thyolo DH 8 425 Public
QECH Blantyre 40 434 Public
Total 157 3703 2456
% of AIDS cases managed for OIs in the past 12 months (GFATM)
At least 5 053 HIV-positive adults and 584 HIV positive children were receiving cotrimoxazole prophylaxis. No persons were reported to be prescribed isoniazid prophylaxis. Eighty seven percent of HIV positive TB patients were prescribed cotrimoxazole out of the 2734 TB patients who tested positive
for HIV1.
% of health facilities with drugs for OIs in stock and no stock outs in last 12 months of > 1 week
By district
Data not available
% of health facilities where ARV services are being offered with no ARV drug stock outs of > 1 week in last 12 months
By district
Data not available
% of detected TB cases who have successfully completed the treatment in the past 12 months
By gender, district and type of TB (smear negative and extra pulmonary, smear positive)
In 2003 a total of 26, 836 TB cases were registered in the country in 44 health facilities2.
This data is for new smear positive TB cases registerd the whole year of 2002.Total cases were 7,686
and those that were cured were 5,365,representing 70%,Failures were 100, representing 1%,those that
completed treatment were 207, representing 3%, those that died 1500 representing 19%. defaulters
were 331 representing 4% and Transfer out cases were 198,representing 3%.
But you will see that cases notified are less than cases evaluated .This is due to delays by
certain microscpy centres that are doing sputum smears to send smear positives cases
diagnosed in those centres hence by the time the data is collected they are left out but when it
comes to RX outcomes they are evaluated.
1 Report of a Country-Wide Survey of HIV/AIDS Services in Malawi: for the year 2003. MOH, NAC 2 Report of a Country-Wide Survey of HIV/AIDS Services in Malawi: for the year 2003. MOH, NAC
B IB LIO G R A PH Y
b) Community Home-Based Care
# of households receiving external assistance in the past 12 months to care for adults who have been chronically ill for 3 or more months during the past 12 months
At least 19,706 households received external assistance from July to December 2003 to care for chronically ill adults. The majority of households, 19 706 (55%) received psychosocial support. Nutritional (19%), medical (13%), domestic (11%) and financial (2%) support services were also provided.
Households receiving external assistance to care for adults who have been chronically ill for 3 or more months, July to December 2003
Type of support District
Psychosocial Nutritional
Financial and
resources Medical Domestic Total
Blantyre 530 653 350 61 105 1,699 Dowa 140 20 - 60 110 330 Kasungu 189 343 - 657 116 1,305 Lilongwe 7,987 1,804 49 2,340 2,026 14,206 Machinga - - - - 36 36 Mangochi 11 - - - - 11 Mchinji 548 221 - 358 815 1,942 Mzimba 250 250 - 250 250 1,000 Mzuzu 485 140 21 178 - 824 Nkhatabay - 1 2 2 - 5 Nsanje 122 49 1 10 31 213 Ntchisi 128 - - 57 140 325 Phalombe 85 1,626 - 306 22 2,039 Salima 216 152 4 81 131 584 Thyolo 9,015 1,521 453 323 15 11,327 Total 19,706 6,780 880 4,683 3,797 35,846
# of persons enrolled at PLWA organisations
At least 1,038 persons were enrolled at PLWA organisations from July to December 2003. Ninety four percent of these (977) were aged 25 years and above. Only 61 (6%) registered PLWAs were 15 to 24 years old; 545 were females whereas 493 were male.
Persons enrolled at PLWA organisations Age 15 to 24 years
Age above 24 years DISTRICT
Male Female Sub total Male Female Sub total
TOTAL
B IB LIO G R A PH Y Blantyre 5 8 13 15 27 42 55 Chikwawa - - - 1 - 1 1 Kasungu - 7 7 6 36 42 49 Lilongwe 4 3 7 40 69 109 116 Mangochi - - - 2 3 5 5 Mchinji - - - 1 2 3 3 Mwanza - - - 3 5 8 8 Mzimba - - - 2 10 12 12 Mzuzu - 19 19 55 87 142 161 Salima - - - 7 18 25 25 Thyolo 2 13 15 350 238 588 603 Total 11 50 61 482 495 977 1,038 # of community home based care visits A total of 54,070 CHBC visits were made: 33,086 (61%) in rural areas and 20,984 in urban areas (39%), from July to December 2003. In both rural and urban areas more volunteer visits than health worker visits were made. In total health workers made 7,205 (13%) visits while volunteers made 46, 865 (87%) visits. CHBC visits were reported in 14 districts. # community home based care visits # Visits Health care worker Volunteer District Rural Urban Sub total Rural Urban Sub total Grand Total Blantyre 99 190 289 923 783 1,706 1,995 Chikwawa - 4 4 120 - 120 124 Dowa - - - 5,839 - 5,839 5,839 Kasungu 215 - 215 3,096 - 3,096 3,311 Lilongwe 29 4,474 4,503 41 12,480 12,521 17,024
B IB LIO G R A PH Y Machinga 5 2 7 6 1 7 14 Mangochi 2 1 3 2 3 5 8 Mchinji 424 - 424 5,308 - 5,308 5,732 Mzimba 3 - 3 1,363 - 1,363 1,366 Mzuzu 585 130 715 2,050 2,404 4,454 5,169 Nsanje 99 - 99 299 - 299 398 Ntchisi 8 - 8 1,320 512 1,832 1,840 Phalombe - - - 306 - 306 306 Salima 539 - 539 2,069 - 2,069 2,608 Thyolo 396 - 396 7,940 - 7,940 8,336 Total 2,404 4801 7,205 30,682 16,183 46,865 54,070 3.3.3 IMPACT MITIGATION
a) Orphans and Vulnerable Children
# of orphans and vulnerable children receiving care/support in 2003
At least 24,767 orphans and vulnerable children received care and support from July to December in 2003; 24,767 (42%) received psychosocial support 18,733 (32%) received nutritional support and 11,526 (20%) received school fees support. Orphan support was reported for 12 districts.
# orphans and vulnerable children receiving care/support Type of support
District
Counselling Nutrition Fees Other
Total Balaka - 369 - - 369 Blantyre 147 159 306 163 775 Lilongwe 909 877 1,786 566 4,138 Machinga 877 343 23 1,243 Mangochi 966 45 - 34 1,045 Mchinji 1,714 1,704 374 18 3,810 Mulanje 3,605 3,601 - - 7,206 Mwanza 50 - - - 50
B IB LIO G R A PH Y Mzimba 2,928 3,308 6,205 2,903 15,344 Mzuzu 3,675 98 31 193 3,997 Neno 9,831 6,505 349 250 16,935 Salima 56 56 112 - 224 Thyolo 886 1,134 2,020 - 4,040 Total 24,767 18,733 11,526 4,150 59,176
# of community initiatives or community organizations receiving support to care for orphans data not available
3.3.4 SECTORAL MAINSTREAMING
% of large enterprise/companies and public sector institutions that have HIV/AIDS workplace policies and programmes (GFATM)
At least 17.5% of public sector institutions had HIV/AIDS workplace policies and programmes in 2002.1
# and % of employees and spouses in all sectors that have been reached by interventions defined in their employers’ workplace policy
Only 473 employees and spouses were reported to have been reached by work place interventions. More females, 296 (63%), were reached than males, 177 (37%). Out of 11 organizations which reported to have work place policies, 9 (82%) were NGO/FBO while 2 (18%) were from the public sector.
Organizations with HIV/AIDS Workplace Policies
Organization Type of organization
CADECOM- Mchinji NGO
Centre For AIDS Care Education and Training NGO
Concern Universal- Blantyre NGO
ESCOM-Clinic -Lilongwe Public
GUILLEME Action for AIDS -GAGA NGO
Livingstonia Synod AIDS Control Program FBO
Malawi Police Headquarters- Lilongwe Public
Medecines Sans Frontieres -Luxembourg NGO
SOS -Medical Centre NGO
Word Alive Ministries International NGO
YOPACO NGO
3.3.5 CAPACITY BUILDING AND PARTNERSHIPS Amount of funds that NAC granted to implementers
A total of MWK161 796 672.87 was disbursed as grants by NAC in 2003. Funds for grants were from Pool donors, which consists of; CIDA, DFID, NORAD, Malawi Government , World Bank and discrete