Integrative pathway enrichment analysis
of multivariate omics data
Marta Paczkowska
1,136, Jonathan Barenboim
1,136, Nardnisa Sintupisut
1, Natalie S. Fox
1,2, Helen Zhu
1,2,
Diala Abd-Rabbo
1, Miles W. Mee
1, Paul C. Boutros
1,2,3,4,5,6,7,8, PCAWG Drivers and Functional
Interpretation Working Group, Jüri Reimand
1,2* & PCAWG Consortium
Multi-omics datasets represent distinct aspects of the central dogma of molecular biology. Such high-dimensional molecular profiles pose challenges to data interpretation and hypothesis generation. ActivePathways is an integrative method that discovers significantly enriched pathways across multiple datasets using statistical data fusion, rationalizes con-tributing evidence and highlights associated genes. As part of the ICGC/TCGA Pan-Cancer Analysis of Whole Genomes (PCAWG) Consortium, which aggregated whole genome sequencing data from 2658 cancers across 38 tumor types, we integrated genes with coding and non-coding mutations and revealed frequently mutated pathways and additional cancer genes with infrequent mutations. We also analyzed prognostic molecular pathways by integrating genomic and transcriptomic features of 1780 breast cancers and highlighted associations with immune response and anti-apoptotic signaling. Integration of ChIP-seq and RNA-seq data for master regulators of the Hippo pathway across normal human tissues identified processes of tissue regeneration and stem cell regulation. ActivePathways is a versatile method that improves systems-level understanding of cellular organization in health and disease through integration of multiple molecular datasets and pathway annotations.
https://doi.org/10.1038/s41467-019-13983-9 OPEN
1Computational Biology Program, Ontario Institute for Cancer Research, 661 University Ave Suite 510, Toronto, ON M5G 0A3, Canada.2Department of
Medical Biophysics, University of Toronto, 101 College Street Suite 15-701, Toronto, ON M5G 1L7, Canada.3Department of Pharmacology & Toxicology, University of Toronto, 1 King’s College Circle Room 4207, Toronto, ON M5S 1A8, Canada.4Department of Human Genetics, University of California Los Angeles, 10833 Le Conte Avenue, Los Angeles, CA 90095, USA.5Department of Urology, University of California Los Angeles, 200 Medical Plaza Driveway #140, Los Angeles, CA 90024, USA.6Institute of Precision Health, University of California Los Angeles, 10833 Le Conte Avenue, Los Angeles, CA 90024, USA.7Broad Stem Cell Research Centre, University of California Los Angeles, 615 Charles E Young Drive S, Los Angeles, CA 90095, USA.8Jonsson
Comprehensive Cancer Centre, University of California Los Angeles, 10833 Le Conte Avenue, Los Angeles, CA 90024, USA.136These authors contributed equally: Marta Paczkowska, Jonathan Barenboim. PCAWG Drivers and Functional Interpretation Working Group authors and their affiliations appears at the end of the paper. PCAWG Consortium members and their affiliations appear in the Supplementary Information *email:Juri.Reimand@utoronto.ca
123456789
0():,;
source:
https://doi.org/10.7892/boris.146114
P
athway enrichment analysis is an essential step for inter-preting high-throughput (omics) data that uses current knowledge of genes and biological processes. A common application determines statistical enrichment of molecular path-ways, biological processes and other functional annotations in long lists of candidate genes1. Genomic, transcriptomic, pro-teomic and epigenomic experiments emphasize complementary aspects of underlying biology and are best analyzed integratively, as is now routinely done in large-scale projects such as The Cancer Genome Atlas (TCGA)2, Clinical Proteome Tumor Analysis Consortium (CPTAC), International Cancer Genome Consortium (ICGC)3,4, Genotype-Tissue Expression (GTEx)5, and others6. Thus, simultaneous analysis of multiple candidate gene lists for characteristic pathways is increasingly needed.Numerous approaches are available for interpreting single gene lists. For example, the GSEA algorithm can detect upregulated and downregulated pathways in gene expression datasets7. Web-based methods such as Panther8, ToppCluster9, and g:Profiler10 detect significantly enriched pathways amongst ranked or unranked gene lists and are generally applicable to genes and proteins from various analyses. Some approaches allow analysis of multiple input gene lists however these primarily rely on visualization rather than data integration to evaluate the con-tribution of distinct gene lists towards each detected pathway9,10. Finally, no methods are available for unified pathway analysis of coding and non-coding mutations from whole-genome sequen-cing (WGS) data, or integrating these with other types of DNA aberrations such as copy number changes and balanced genomic rearrangements.
Cancer genomes are characterized by multiple classes of mutations, including single nucleotide variants (SNVs), small insertions–deletions (indels), copy number alterations, and translocations. These affect a small number of frequently mutated pan-cancer driver genes such as TP53, less-frequent and tissue-specific genes such as SPOP in prostate cancer, and numerous infrequently mutated genes. The majority of currently known driver mutations of SNVs and indels affect protein-coding sequence11 and only few high-confidence non-coding drivers have been found, such as the mutation hotspots in the TERT promoter12. Discovery of coding and non-coding driver muta-tions is a major goal of large cancer whole genome sequencing efforts. The PCAWG Consortium aggregated whole genome sequencing data from 2658 cancers across 38 tumor types gen-erated by the ICGC and TCGA projects. These sequencing data were re-analysed with standardized, high-accuracy pipelines to align to the human genome (reference build hs37d5) and identify germline variants and somatically acquired mutations, as descri-bed in the PCAWG marker paper4. A consensus analysis of variant calls in PCAWG tumors generated a high-confidence catalog of driver mutations in protein-coding driver genes (CDS) and non-coding regions of 5′ and 3′ untranslated elements (UTRs), promoters and enhancers13. A consensus pathway and network analysis of PCAWG driver mutations used knowledge of molecular pathways and gene interaction networks as priors to further discover infrequent candidate driver variants including those in the non-coding genome14.
Here we report the development of the ActivePathways method that uses data fusion techniques to address the challenge of integrative pathway analysis of multi-omics data. It detects significantly enriched pathways across multiple datasets, includ-ing those pathways that are not apparent in any individual dataset. We present several analyses to demonstrate this method. First, we integrate cancer driver genes with coding and non-coding mutations predicted using the PCAWG dataset13 and reveal numerous processes and additional genes with frequent coding and non-coding mutations. Second, we integrate patient
clinical information with transcriptomic and copy number alterations in breast cancers of the METABRIC project15to dis-cover prognostic pathways and processes in breast cancer sub-types. Third, we integrate transcriptomic data of normal tissues of the GTEx project5 with ChIP-seq data to infer gene regulatory networks and biological processes downstream of the Hippo pathway of tissue growth control and regeneration. Thus Acti-vePathways is a versatile method for combining diverse multio-mics datasets.
Results
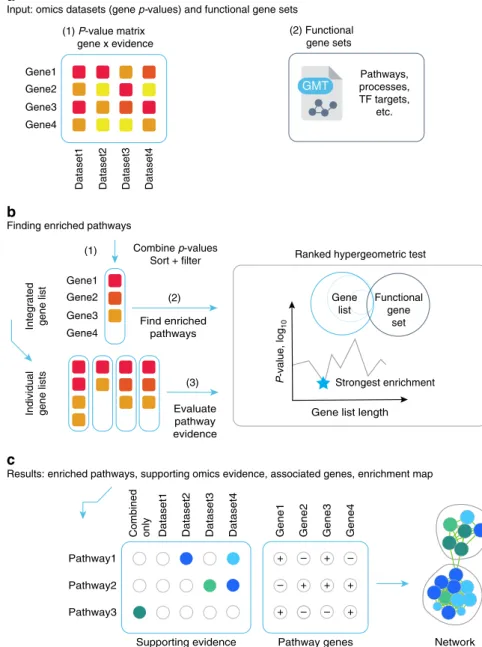
Multi-omics pathway enrichment analysis with ActivePath-ways. ActivePathways is a simple three-step method that extends our earlier work10(Fig.1). It requires two input datasets. Thefirst input is a table ofP-values with genes listed in rows and evidence from distinct datasets listed in columns. The columns can include P-values of differential gene expression, gene essentiality, muta-tion or copy number alteramuta-tion burden and many others that are derived using platform-specific quantification methods. The sec-ond input is a collection of gene sets that represents collective knowledge of gene function and interactions we refer to as pathways. The most common analysis utilizes biological processes from gene ontology16 (GO) and molecular pathways from the Reactome database17. Depending on the hypothesis, these data may also include many other types of gene sets such as targets of transcription factors or microRNAs.
In the first step of ActivePathways, we derive an integrated gene list that for each input gene aggregates significance from multiple omics datasets. The integrated gene list is compiled by a fusion of gene significance from different omics datasets (i.e., evidence) using the Brown’s extension18of the Fisher’s combined probability test. The Brown’s method considers dependencies between datasets and thus provides more conservative estimates of significance for genes that are supported by multiple similar omics datasets. The integrated input gene list is then ranked by decreasing significance and filtered using a lenient cut-off, designed to capture additional candidate genes with sub-significant signals while discarding the bulk of insignificant genes (unadjusted Brown Pgene< 0.1). In the second step, a pathway enrichment analysis is conducted on the integrated gene using a ranked hypergeometric test10and a collection of gene sets (i.e., biological processes, molecular pathways, and other gene annotations). The ranked hypergeometric test is designed to capture smaller pathways tightly associated with few top-ranking genes and also broader processes associated with larger subsets of input genes. The family-wise multiple testing correction method by Holm19 is then applied across tested pathways to select the pathways significantly enriched in the integrated gene list
(Qpathway< 0.05). In the third step, we perform a similar analysis
on the gene lists of individual omics datasets separately to determine the omics evidence supporting the integrative pathway analysis results determined in step 2. Importantly, the third step also highlights pathways that are only found through data integration and are not apparent in any single omics dataset separately, providing the added value of integrated analysis. Finally, the method provides inputfiles for Enrichment Map20for visualizing resulting pathways with the corresponding omics evidence.
Integrating coding and non-coding drivers in 2658 cancer genomes. We performed an integrative pathway analysis of driver genes predicted in the PCAWG project based on somatic SNVs and indels. This analysis comprised 29 cancer patients cohorts of histological tumor types and 18 meta-cohorts combining multiple types of tumors, with 47 cohorts in total (Supplementary Table 1).
ActivePathways identified at least one significantly enriched process or pathway in 89% of these cohorts (42/47, Qpathway< 0.05, ranked hypergeometric test) (Fig. 2a). We analyzed the evidence supporting predictions of enriched pathways: most cohorts showed enrichments in pathways supported by protein-coding mutations in genes (37/47 or 79%). This serves as a positive control since the majority of currently-known cancer driver genes have frequent protein-coding mutations.
Non-coding mutations in genes also contributed broadly to the discovery of frequently mutated biological processes and path-ways: 24/47 cohorts (51%) showed significantly enriched path-ways that were apparent when only analyzing non-coding driver
scores corresponding to UTRs, promoters or enhancers. The majority of PCAWG tumor cohorts (41/47 or 87%) revealed some frequently mutated pathways that were apparent when integrat-ing codintegrat-ing and non-codintegrat-ing mutations however remained undetected when considering either coding or non-coding mutations separately, emphasizing the value of our integrative approach. As expected, cohorts with more patient tumor samples generated more significantly enriched pathways (Spearmanρ= 0.74,P=2.3 × 10⁻⁹; Supplementary Fig. 1), suggesting that larger
datasets are better powered to distinguish rarely mutated genes involved in biological pathways and processes. Discovery of pathways enriched in non-coding mutations suggests that our
Dataset1 Dataset2 Dataset3 Dataset4
Gene1 Gene2 Gene3 Gene4
GMT
Gene list length
Gene1
Dataset1 Dataset2 Dataset3 Dataset4 Gene2 Gene3 Gene4
(2) Functional gene sets
Pathway1 Pathway2 Pathway3
Supporting evidence Pathway genes Network visualization + + + + + + + – – – – – Strongest enrichment Ranked hypergeometric test Input: omicsdatasets (gene p-values) and functional gene sets
Finding enriched pathways
Results: enriched pathways, supporting omics evidence, associated genes, enrichment map
Combined only P -value, log 10 Evaluate pathway evidence Gene1 Gene2 Gene3 Gene4
Integrated gene list
Combine p-values Sort + filter Pathways, processes, TF targets, etc.
Individual gene lists
Find enriched pathways Gene list Functional gene set (1) (2) (3) (1) P-value matrix gene x evidence a b c
Fig. 1 Method overview. aActivePathways requires as input (1) a matrix of geneP-values for different omics datasets, and (2) a collection of gene sets
corresponding to biological pathways and processes.bIn step (1), geneP-values are merged using the Brown procedure andfiltered to produce an integrated gene list that combines evidence from datasets and is ranked by decreasing significance with a lenient threshold. In step (2), pathway enrichment analysis is conducted on the integrated gene list using the ranked hypergeometric test that determines the optimal level of enrichment in the ranked gene sub-list for every pathway. In step (3), separate gene lists are compiled from individual input datasets and analyzed for pathway enrichment using the ranked hypergeometric test, tofind supporting evidence for each pathway from the integrative analysis.cActivePathways provides a list of enriched pathways in the integrated gene list, the associated genes with significant BrownP-values, and annotations of evidence supporting each pathway. Results of ActivePathways are visualized as enrichment maps where nodes correspond to pathways and pathways with many shared genes are connected into networks representing broader biological themes.
integrative pathway analysis is an attractive strategy for illuminating the dark matter of the non-coding cancer genome.
We studied the adenocarcinoma cohort of 1773 samples of 16 tumor types. Integrative pathway analysis highlighted 432 genes that were significantly enriched in 526 pathways (Qpathway< 0.05) (Fig. 2b). As expected, the majority of pathways were only
supported by genes with frequent coding mutations (328/526 or 62%). However, an additional set of 101 pathways (19%) was supported by both coding and non-coding gene mutations, 72 pathways (14%) were only apparent in the integrated analysis of both coding and non-coding mutations, and 25 (5%) were only enriched in non-coding mutations. Accumulation of these 0 250 500 750 Pancan−no−lymph Pancan−no−skin−melanoma Pancan Pancan−no−skin−melanoma−lymph Meta_Carcinoma Meta_AdenocarcinomaMeta_Digestive_tract Lymph−BNHL Meta_Lymphatic_system Meta_Hematopoietic_system Meta_CNS ColoRect−AdenoCa Meta_Female_reproductive_tract Meta_GliomaLiver−HCC
Meta_SquamousPanc−AdenoCaSkin−MelanomaUterus−AdenoCaEso−AdenoCa Stomach−AdenoCa
CNS−GBM Breast−AdenoCa
Meta_BreastCNS−MedulloMeta_LungHead−SCCBladder−TCCMeta_Kidney Lung−AdenoCa
Lung−SCC
Bone−LeiomyoMeta_SarcomaKidney−RCCCNS−PiloAstroMyeloid−MPNLymph−CLLThy−AdenoCa
Panc−EndocrineOvary−AdenoCaProst−AdenoCaKidney−ChRCCMeta_Myeloid
CNS−OligoCervix−SCC
Bone−OsteosarcBiliary−AdenoCa
Number of enriched pathways
Evidence of mutations Coding
Non−coding Combined only Coding & non−coding
Organ development Axon development Pre-mRNA transcription TP53 dependent DNA damage response RNA processing and splicing Chromatin modification Cell cycle Hemo-poiesis Protein catabolic process Protein localization Toll-like receptor Signal transduction (FGFR, ERBB, PDGF, AKT) WNT signaling Neuron death MAP kinase activity Cell cycle
a
b
c d 1 3 5 –log10 (P) Regulation of kidney development Metanephros development Cell differentiation involved in kidney development Kidney development Renal system development Nephron epithelium development Mesonephros development Nephron epithelium morpho-genesis Ureteric bud morphogenesis Mesonephric epithelium development Nephron tubule development * *** . * . . *** * * . *** *** *** *** *** * *** *** * * . ** ** . . *** . *** * * . * ** * *** *** *** *** ** ** * * * * * * * * * * * . SOX4 SOX9 # SMAD3 LGR4 COL4A1 TEK SALL1 MEF2C SERPINB7 TSC1 HNF1B BAX IQGAP1 MYC HES1 # GA TA3 # SMAD4 # CTNNB1 # Brown P Enhancer Promoter 5′UTR 3′UTR CDSCGC gene; #PCAWG driver . P < 0.1
*P < 0.05 **P < 0.01 ***P < 0.001 Head and brain
development
*
- Drivers from focused analysis - Additional cancer genes from pathway analysise
*
*
*
** *
* * *
**
* *
**
* *
*
*
* * * * * * * **
* **
*
*
*
*
* * *
* *
**
* *
*
*
* *
*
*
* *
*
BCL11A BCL9 BCL6 AXIN2 CASP8 CHD4 CLTC CTCF CXCR4 DDX3X EIF4A2 ELL FAT1 FLI1 GATA2 GNAS HLA−A HNRNPA2B1 IDH1 KDM5C KLF4 KMT2D LMO1 MYC NF1 NF2 PAX8 PICALM PLCG1 PRRX1 RPL5 SFPQ SMAD3 SMARCA4 SMARCB1 SRSF2 SRSF3 STAG2 SUFU SUZ12 TBL1XR1 TBX3 TCF7L2 TSC1 U2AF1 XPO1 ZNF521 0 5 10 15 20 Brown integrated p –value, –log 10individually infrequent non-coding mutations into relevant pathways and processes is apparent in our integrative analysis and remains undetected in a gene-focused analysis.
The major biological themes with frequent protein-coding mutations included hallmark cancer processes such as‘apoptotic signaling’(24 genes;Qpathway=4.3 × 10⁻⁵) and‘mitotic cell cycle’ (8 genes; Qpathway=0.0026), and additional biological processes such as chromatin modification and RNA splicing that are increasingly recognized in cancer biology. Thus, ActivePathways captures the expected cancer pathways enriched in driver genes with protein-coding mutations as positive controls. In contrast to these solely protein-coding driver associations, a large group of developmental processes and signal transduction pathways was detected as enriched in both coding and non-coding mutations in genes; for example‘embryo development process’was supported by mutations in exons, 3′UTRs and gene promoters (68 genes;
Qpathway=2.9 × 10⁻¹²), while the Reactome pathway‘repression
of WNT target genes’was only apparent in the integrated analysis of coding and non-coding mutations but not in either dataset alone (5 genes,Qpathway=0.016). In summary, these data show that ActivePathways is a sensitive approach for integrating multi-omics signals such as coding and non-coding mutations, interpreting supporting omics evidence, and finding additional functional associations that are not apparent in any single input dataset.
Pathway-based prioritization of rarely mutated cancer genes. Pathway analysis can identify candidate genes that would other-wise remain undetected in gene-based analyses. ActivePathways enhances such discovery by integrating signals across multiple datasets. In the pathway analysis of coding and non-coding mutations in PCAWG, we focused on a group of processes involved in kidney development that were exclusively detected through the integration of coding and non-coding mutations (Fig. 2c, d). ActivePathways found 18 genes involved in these processes, onlyfive of which were predicted as driver genes in the consensus driver analysis of the PCAWG project13. Additional known cancer genes included the oncogeneMYCwith 13 patients with 3′UTR mutations (driver P-valuePUTR3=4.8 × 10⁻⁴), the transcription factor SMAD3 of the TGF-β pathway with 14 patients with protein-coding mutations (PCDS=4.0 × 10⁻⁴) and the growth inhibitory tumor suppressor gene TSC1 with 23 patients with protein-coding mutations (PCDS=1.4 × 10⁻⁴) as well as candidate cancer genes such asIQGAP1with ten patients with promoter mutations (Ppromoter=8.2 × 10⁻⁴) that encodes a signaling protein involved in cell motility and morphology. The additional genes remained below the FDR-adjusted significance cut-off in the gene-focused consensus driver analysis (Q= 0.17–0.62), however were found by ActivePathways due to their associations with kidney development. Thus ActivePathways can
exploit functional gene annotations and multiple omics signals to find further candidate genes that remain undetected in gene-focused analyses.
We evaluated the effects of our data integration strategy and examined all 333 pathway-associated candidate genes detected in the adenocarcinoma cohort (Fig.2e). As expected, these included a considerable proportion of known cancer genes. First, as positive controls we found 60/64 significantly mutated genes that were also identified in the PCAWG consensus driver analysis13. In addition, we found a set of 47/333 known cancer genes annotated in the COSMIC Cancer Gene Census database11that were not detected in the driver analysis, significantly more than expected by chance alone (seven genes expected, Fisher’s exact P=4.0 × 10⁻²⁴). Those included well-known cancer driver genes
MYC, IDH1, NF1, andBCL9. ActivePathways was able to detect
these additional genes for several reasons. First, the integrated gene list was filtered using a lenient statistical cut-off in ActivePathways (Pgene< 0.1) that allowed a long tail of 273/333 genes with less-frequent mutations to be detected through pathway associations. Second, certain genes were upgraded through the data fusion procedure as a single stronger P-value per gene was derived by combining multiple weaker P-values corresponding to the coding regions, promoters, UTRs, enhancers of the gene. This affected 17/333 pathway-associated genes including six known cancer genes (HNRNPA2B1, STAG2,
TCF7L2, SUZ12, CLTC, and ZNF521), Thus, the integration
procedure prioritized specific pathway-related genes compared to their original rankings in individual mutation datasets. However, the majority of genes showed reduced significance after the fusion and were excluded from the pathway analysis: 3543 genes had at least one significant P-value prior to data fusion (Pgene< 0.1) while 88% of these (3112) were considered insignificant following the BrownP-value combination step. In contrast, the majority of pathway-associated genes (220/333) showed improved rankings in the integrated gene list compared to their original rankings in individual input datasets. This formal combination of P-values across omics datasets is therefore more conservative than a naïve approach of selecting a top P-value for every gene. Thus, ActivePathways finds additional candidate genes that remain undetected in gene-by-gene analyses and are highlighted due to their multiple omics signals in pathways.
Integrating prognostic CNA and mRNA signals in breast cancer. To demonstrate an integrative analysis of patient clinical information with multiple types of omics data, we studied the pathways and processes associated with patient prognosis in breast cancer. We leveraged the METABRIC dataset15 of 1780 breast cancer samples drawn from all four subtypes (HER2-enriched, basal-like, luminal-A, luminal-B) and evaluated all genes using three types of prognostic evidence. mRNA abundance
Fig. 2 Pathway enrichment analysis of cancer driver genes with ActivePathways. aBar plot shows number of significantly enriched pathways (Q< 0.05)
among predicted driver genes with coding and non-coding mutations in the PCAWG dataset. The majority of pathways detected by ActivePathways are supported by protein-coding mutations, as expected (dark green bars), while non-coding mutations (orange, red) reveal additional pathways. Pathways shown in dark red are found only in the integrated gene list of coding and non-coding mutations but not in gene lists of individual mutation scores.
bEnrichment map shows pathways enriched in frequently mutated genes in the adenocarcinoma cohort of 1773 tumors. Nodes in the network represent pathways and similar pathways with many common genes are connected. Groups of similar pathways are indicated. Nodes are colored by supporting evidence from coding and non-coding cancer mutations. Arrow indicates kidney developmental processes.cThe group of enriched kidney developmental processes is apparent from integrated evidence of coding and non-coding mutations but is not found among coding or non-coding candidate genes separately.dHeatmap showsP-values of driver genes involved in kidney developmental processes, including driver genes found in the driver analysis (indicated with #) and additional genes only found in the pathway analysis. Top row shows mergedP-values from the Brown procedure. Genes listed in the Cancer Gene Census (CGC) database are indicated in boldface letters.ePathway analysis recovers most genes of the driver list from PCAWG (orange asterisks), as well as additional infrequently mutated genes apparent due to their pathway associations. Additional known cancer genes detected in the pathway analysis are listed (green dots) and occur more frequently than expected from chance alone.
profiles were deconvolved between mRNA abundance levels in tumor cells (TC) and tumor-adjacent cells (TAC) using the ISOpure algorithm21,22. mRNA values were associated with patient survival using median dichotomization and log-rank tests. Gene copy number alterations (CNA) were included as the third type of evidence and associated with patient survival using log-rank tests.
ActivePathways identified 192 significantly enriched GO biological processes and Reactome pathways across the four subtypes of breast cancer, of which nine pathways were enriched in multiple cancer subtypes and 33 pathways were only apparent through the integrative pathway analysis but not in any of the CNA or mRNA datasets alone. The major findings enriched in prognostic signatures in breast cancer subtypes involved the processes and pathways of immune response, apoptosis, ribosome biogenesis and chromosome segregation (Fig.3a).
Immune activity was associated with prognostic genes in basal-like and HER2-enriched breast cancers with significant enrichment of GO processes such as ‘immune system
develop-ment’ (Qbasal=3.0 × 10⁻⁴, 113 genes;QHER2=0.035, 61 genes;
ranked hypergeometric test) and ‘lymphocyte differentiation’ (QHER2=6.8 × 10⁻⁴, 46 genes; Qbasal=8.4 × 10⁻⁴, 45 genes). The majority of related genes were associated with improved patient prognosis upon increased mRNA abundance in tumor cells or tumor-adjacent cells, comprising 50/61 genes in the HER2-enriched subtype and 78/113 genes in the basal subtype (Fig.3b). Interestingly, only a minority of these genes (10) were significant in both of the two breast cancer subtypes, suggesting different modes of immune activity in subtypes and emphasizing the power of our pathway-based approach. Basal-like breast cancers were associated with additional 67 terms involving immune response and blood cells, however no immune-related terms were enriched for luminal subtypes of breast cancers. Prognostic features of immune-related genes in HER2-enriched and basal-like breast cancers are well known23,24. Our pathway-based findings indicate that immune activity in breast tumor cells and in the surrounding microenvironment negatively affects tumor progression and improves prognosis.
Apoptosis was associated with patient prognosis in HER2-enriched and luminal-A breast cancers through HER2-enriched GO processes such as ‘negative regulation of apoptotic process’ (QHER2=0.030, 122 genes; QluminalA=0.015, 228 genes) and
‘programmed cell death’(QHER2=0.015, 125 genes;QluminalA= 0.016, 231 genes) (Fig.3c). Interestingly, anti-apoptotic pathways were only detected in the integrative analysis and not in genomic and transcriptomic gene signatures separately. Among the genes negatively regulating apoptosis, DUSP1 provided the strongest prognostic signal in HER2-enriched breast cancers. This was apparent in the molecular stratification of samples by mRNA of tumor cells (log-rankPTC=0.019, HR=1.5) and tumor-adjacent cells (PTAC=8.3 × 10⁻⁴, HR=1.8) as well as gene copy number amplifications (PCNA=9.8 × 10⁻⁴, HR=2.8) (Fig. 3d). DUSP1 encodes a phosphatase signaling protein of the MAPK pathway that is over-expressed in malignant breast cancer cells and inhibits apoptotic signaling25.HER2over-expression is known to suppress apoptosis in breast cancer26. Anti-apoptotic signaling is a hallmark of cancer and expectedly associated with worse patient prognosis.
ActivePathways also identified prognostic pathway associations that were only apparent in single subtypes of breast cancer. For example, the prognostic genes for luminal-B subtype were enriched in processes related to ‘chromosome segregation’
(QluminalB=0.017, 41 genes) that have been associated with
worse outcome in breast cancer27. As another example, luminal-A breast cancers were associated with prognosis in ribosomal and RNA processing genes, such as‘ribosome biogenesis’(QluminalA=
6.9 × 10⁻¹⁰, 60 genes) and‘rRNA metabolic process’(Q
luminalA=
1.8 × 10⁻¹³, 64 genes). Although not described specifically in the luminal-A subtype, ribosomal mRNA abundance has been shown to be prognostic in breast cancer as a marker of cell proliferation28,29. In summary, ActivePathways can be used for integrating clinical data with multiomics information of mole-cular alterations. Such analyses can provide leads for functional studies and biomarker development.
Interpreting co-expressed and DNA-bound targets of Hippo TFs. To demonstrate the use of ActivePathways for studying gene regulation, we analyzed transcriptomes of non-cancerous human tissues from the GTEx project5. We focused on the Hippo sig-naling pathway involved in organ size control, tissue homeostasis and cancer30,31and studied regulatory networks downstream of the two transcription factors (TFs) YAP and TAZ (encoded by
YAP1andWWTR1). YAP and TAZ are evolutionarily conserved
master regulators of Hippo signaling in mammals that respond to intracellular and extracellular signals of cell–cell interactions, cell polarity, mechanical cues, G protein-coupled receptor signaling, and cellular energy status30,31.
We performed an integrative pathway enrichment analysis of transcriptomics and epigenomics data of the two master regulators of the Hippo pathway. First, we predicted transcrip-tional target genes for YAP and TAZ (1898 and 1319 genes, respectively), using co-expression analysis and robust rank aggregration32 over 9642 transcriptomes of 40 tissue types in GTEx (Q< 0.05). Second, we studied the set of 2356 target genes of YAP that have DNA-binding sites at gene promoters derived from a YAP ChIP-seq study33 reanalyzed in the ReMap database34 (Q< 0.05). The three gene lists with corresponding significance values were used as input to ActivePathways for the integrative analysis.
Integrative analysis of transcriptional and DNA-binding target genes of YAP/TAZ resulted in 225 significantly enriched GO processes and Reactome pathways (Qpathway< 0.05) (Fig.4a). The resulting pathways are expected in the context of Hippo signaling and included development and morphogenesis, cell motility, organization of actin cytoskeleton and cell–cell junctions, signal transduction pathways such as EGFR, Wnt, Robo, TGF-beta, rho GTPase, and others. ActivePathways highlighted 2066 genes in these pathways. We examined known members of the Hippo pathway and found 13 of 32 genes among pathway-associated genes (WWTR1, LATS1, WWC1, YWHAQ, YAP1, MAPK8,
MAPK9,STK3,TNIK,TEAD3,MAP4K3,MINK1,TEAD1), more
than expected from chance alone (four genes expected,P=3.6 × 10⁻⁵, Fisher’s exact test). We also compiled an extended list of
106 Hippo-related genes30,31,35 and confirmed that these were enriched in pathway-associated genes (36/308 genes expected, P=9.1 × 10⁻²⁶, Fisher’s exact test) (Fig.4b). A large fraction of
pathways (55 or 24%) was only identified in the integrated analysis and not in any input dataset alone, underlining the advantage of detecting significantly enriched pathways across multiple complementary omics datasets. Similarly, Hippo-related genes were either supported by ChIP-seq data alone (54 genes), mRNA data alone (30 genes), or both by mRNA and ChIP-seq data (22 genes), concordant with the notion that RNA-seq and ChIP-seq show limited agreement regarding TF target genes and provide complementary insights into gene regulation. Thus, our integrative analysis of co-expression networks and TF–DNA interactions of Hippo master regulators expectedly converges on Hippo-related genes and pathways.
In addition to GO terms and pathways, ActivePathways can be used to interpret omics data with other classes of functional gene sets such as TF target genes. To further elucidate gene regulatory
networks downstream of YAP/TAZ, we considered potential enrichments of DNA-binding target genes of 161 TFs profiled in ChIP-seq studies of the ENCODE project36. We found a regulatory network of 17 TFs and 1426 target genes enriched in the YAP/TAZ regulome (Q< 0.05, ranked hypergeometric test) (Fig.4c). These included the DNA-binding targets of the master
regulators of pluripotent stem cells37 NANOG (208/774 target genes, Q=1.3 × 10⁻⁶) and POU5F1 (107/406 target genes,Q=
7.3 × 10⁻¹¹). Thisfinding is in agreement with the role of Hippo pathway activity in stem cell regulation38. The regulatory network was significantly enriched in 50 Hippo-related genes (25 expected, P=1.2 × 10⁻⁷, Fisher’s exact test) and six core Hippo genes (two
1 3 5 –log10 (P) b d 0.0 0.2 0.4 0.6 0.8 1.0 0 5 10 15 20 25 30 | | | || | | | | ||||||||| ||| ||| ||| | |||||||||||||||| |||||| ||| ||||||||||| ||| | | ||||||||| || |||||| | ||| | | | | || | Neutral+Loss Gain HRGain: 2.8 (1.51,5.01) P: 9.18 × 10⁻⁴
Fraction, overall survival
0.0 0.2 0.4 0.6 0.8 1.0 0 5 10 15 20 25 30 | | | | | | ||| | || |||||| || ||||||||| ||||||| ||| | ||||| || | | | | | | | | | ||| ||||||| | | | || | || | || |||||| || || | ||| || || | | | Low High Low High HRhigh: 1.83 (1.28,2.61) HRhigh: 1.5 (1.07,2.11) P: 8.33 × 10⁻⁴ Time (Years) 0.0 0.2 0.4 0.6 0.8 1.0 0 5 10 15 20 25 30 | | | ||| | || || | || | ||||| || |||||||||| | |||||| || | |||| || | | | | | | | ||| | || || ||||| | | | | |||||| |||||||| || | || | ||| | | | | | P: 0.019
DUSP1, TAC DUSP1, TC DUSP1, CNA
*** * * ** * * ** ** ** ** ** ** *** ** *** ** * ** ** ** * ** *** ** * ** ** ** ** ** * * ** ** * ** *** ** * * * ** *** ** ** * ** *** ** ** ** ** * *** *** *** *** *** ** *** *** *** *** *** *** * *** *** CAMK1D ARNT2 CASP2 BNIP1 IL2 FLT4 CEACAM5 KDM2B STXBP1 EN1 FCMR IKBKB PPIF ANXA5 KIF14 CCL19 NR4A1 MICAL1 PRDX5 TNF ZMYND11 HIPK2 PDCD4 SLC40A1 DUSP1 TAC mRNA TC mRNA Gene CNA Brown P HER2-enriched RNA processing Translation Tube development LumA Chromosome segregation Growth LumB Cell adhesion Angiogenesis HER2+ B and T cell differentiation SNARE complex Cell migration Basal
Tumor cell mRNA (TC)
Immune response Cytokine immune signaling Cytokine production Enzyme-linked receptor signaling Response to bacteria Ribosome biogenesis Nonsense-mediated decay Skeletal system development Regulation of protein stability Serine-type peptidase activity Signal transduction NF-κB/IκB
Apoptosis Immune system
development DNA biosynthesis Regulation of locomotion Transmembrane receptor kinase pathway STAT phosphorylation Tumor adjacent cell mRNA (TAC)
Peptide cross-linking
Gene copy number alterations (CNA) Combined evidence Apoptosis a CIAPIN1 CTNNB1 LRRC8A BTK IL7R MEF2C PIP4K2A PLCG2 PLEK PREX1 CIAPIN1 CTNNB1 LRRC8A BTK IL7R MEF2C PIP4K2A PLCG2 PLEK PREX1 Basal HER2-enriched 0.25 0.50 1.00 2.00 4.00
Prognostic genes of GO immune system development
Hazard ratio (HR) Evidence Both TAC TC c
Prognostic genes of GO process
expected, P=0.030; WWTR1,VGLL4,TNIK,MAPK8,MOB1A, LATS1), similarly to the pathway-based analysis above. However, the two analyses revealed distinct genes: 886 genes were commonly found by both analyses, 1180 genes were found only in the pathway-based analysis, and 540 genes were found only in the TF-based analysis (Fig. 4d). Thus, integrative enrichment analysis of TF target genes provides complementary information to GO terms and pathways. In summary, this analysis highlights genes and pathways related to Hippo signaling in human tissues and demonstrates the use of ActivePathways for studying gene regulatory networks across complementary omics datasets and technology platforms.
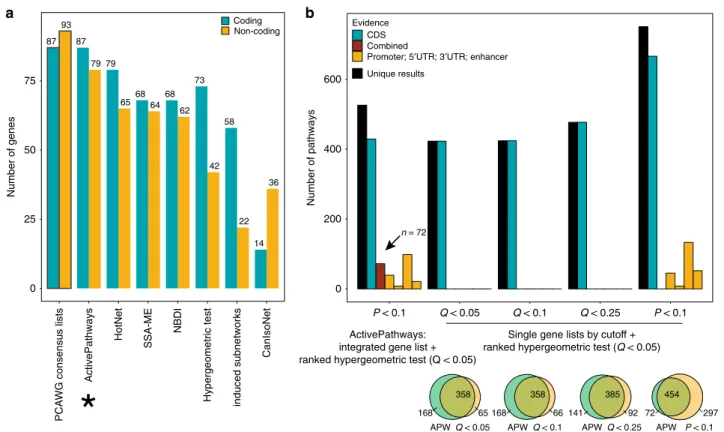
Evaluating the robustness and sensitivity of ActivePathways. We carefully benchmarked ActivePathways using the dataset of cancer driver genes predicted by PCAWG13. First, we compared the performance of ActivePathways with six methods used in the PCAWG pathway and network analysis working group14 (Hier-archical HotNet39,40, SSA−ME41, NBDI42, induced subnetwork analysis40, CanIsoNet43, hypergeometric test). These diverse methods used molecular interaction networks, functional gene sets and/or transcriptomics data to analyze the PCAWG pan-cancer dataset of predicted pan-cancer driver genes. A subsequent consensus analysis defined pathway-implicated driver gene lists with protein-coding and non-coding mutations, based on a majority vote of the pathway and network analysis methods14. ActivePathways recovered these consensus gene lists with the highest accuracy: 100% of coding driver genes (87/87) and 85% of non-coding candidate genes (79/93) were detected (Fig.5a). Thus ActivePathways agreed the most with the ensemble of several other methods in prioritizing known and candidate cancer driver genes using pathway and network context.
We also compared the performance of ActivePathways with a standard approach of pathway enrichment analysis that considers a single statistically-filtered gene list using a ranked hypergeo-metric test1,10(Fig.5b). To this end, we analyzed individual gene lists of protein-coding and non-coding drivers of the PCAWG adenocarcinoma cohort using multiple gene selection thresholds (Q< 0.05, Q< 0.1, Q< 0.25, P< 0.1). ActivePathways showed increased sensitivity of pathway enrichment analysis compared to the standard approach, in particular for pathways involving non-coding mutations that were not promimently represented in any single gene lists. Even compared to the analysis employing the most lenient gene selection filter (P< 0.1), ActivePathways identified 72 additional pathways that were only apparent through the integration of coding and non-coding mutations and remained undetected in the analysis of individual datasets. Thus, our method provides additional information to common approaches that focus on single gene lists.
We evaluated the robustness of ActivePathways to parameter variations and missing data. We varied the parameter Pgenethat determines the ranked gene lists used in the pathway enrichment analysis (default thresholdPgene< 0.1). The majority of PCAWG cohorts (40/47 or 85%) retrieved significantly enriched pathways
even with a considerably more stringent threshold (Pgene< 0.001), however 67% fewer pathways were found compared to the default threshold in the median cohort (Supplementary Fig. 2). We then evaluated the robustness of ActivePathways to missing data by randomly removing subsets of driver scores from the initial dataset. Even when removing 50% of gene driverP-values with P< 0.001, the majority of cohorts (37/47 or 79%) had at least one significantly enriched pathway, however 66% fewer pathways were found on average (Supplementary Fig. 3).
We evaluated the expected false positive rates of ActivePath-ways. We tested 1,000 simulated datasets for each of 47 patient cohorts and expectedly found no significant pathways in 92% of these simulations (Supplementary Fig. 4). Simulated data were obtained by randomly reassigning P-values of driver predictions to different genomic elements, a conservative approach that disrupts pathway annotations of genes while retaining the presence of strong P-values observed in the real data. The median family-wise false discovery rate of ActivePathways computed across cohorts (7.2%) slightly exceeded the applied multiple testing correction (Q< 0.05). Higher rates were observed in cohorts including melanoma tumors, potentially due to abundant promoter mutations caused by impaired nucleotide excision repair in protein-bound genomic regions44. We evaluated quantile-quantile (QQ) plots of pathway-based ranked hypergeometric P-values from ActivePathways and found that these often deviated from the expected uniform distribution and appeared statistically inflated (Supplementary Fig. 5). However, P-values derived from simulated gene scores showed no inflation in our simulations. Anticipating that the most significant cancer driver genes associated with protein-coding mutations, we performed partial simulations. We constructed datasets with simulated geneP-values for protein-coding mutations and trueP -values for non-coding mutations. As expected, partially simulated datasets showed a lesser extent of P-value inflation, suggesting that highly significant known cancer genes are responsible for inflation due to their involvement in many pathways. Statistical testing of highly redundant pathways and processes violates the independence assumption of statistical tests and multiple testing procedures, a known caveat of pathway enrichment analysis1, which likely explains the observed distribution of significance values of our method. Collectively, these benchmarks show that ActivePathways is a sensitive and robust method for detecting significantly enriched pathways and processes through integrative analysis of multi-omics data.
Discussion
Integrative pathway enrichment analysis helps distill thousands of high-throughput measurements to a smaller number of pathways and biological themes that are most characteristic of the experi-mental data at hand, ideally leading to mechanistic insights and candidate genes for follow-up studies. In particular, a joint ana-lysis of complementary datasets often leads to insights that are unavailable in any particular dataset. ActivePathways provides a generally available framework for systematically prioritizing genes
Fig. 3 Prognosis-associated pathways in four molecular subtypes of breast cancer. aEnrichment maps of prognostic pathways and processes were found in
an integrative analysis of mRNA abundance in tumor cells (TC), tumor-adjacent cells (TAC), and gene copy number alterations (CNA) of the METABRIC dataset. Multicolored nodes indicate pathways that were prognostic according to several types of molecular evidence. Blue nodes indicate pathways that were only apparent through merging of molecular signals.bHazard ratios (HR) of prognostic genes related to immune system development in basal and HER2-enriched subtypes of breast cancer. Strongest HR value of TC, TAC is shown. Genes commonly found in basal and HER2-HER2-enriched tumors are shown. Known cancer genes are shown in boldface.cHeatmap shows genes, corresponding log-rankP-values, and merged BrownP-values related to the GO process
‘negative regulation of apoptotic process’that was found by integrating prognostic omics data in HER2-enriched breast cancer.dKaplan–Meier plots show the strongest prognostic signal related to apoptotic signaling, the phosphataseDUSP1that significantly associates with reduced patient survival through increased tumor-adjacent mRNA level (left), increased tumor mRNA level (center) and gene copy number amplification (right). Log-rankP-values are shown.
and pathways across multiple omics datasets that utilizes fusion of gene significance. This allows us to identify pathways and processes that stand out when the data are combined, yet are not apparent in any single analyzed dataset. The use of
ActivePathways is demonstrated in the three case studies above. In our example of cancer driver discovery, pathway analysis provides complementary insights to gene-focused driver dis-covery as it also focuses on sub-significant genes that are clustered Axonogenesis Neuron projection and development Cell morphogenesis Regulation of neurogenesis Axon extension Cell growth Actin cytoskel-eton organiza-tion Endomembrane system organization Microtubule-based movement Cell junction assembly Nucleocytoplasmic transport Organelle organization Protein catabolic process
Epithelial cell migration
Regulation of catabolic process Brain development Heart development Toll like receptors cascade Wnt signaling pathway ERBB signaling pathway ROBO signaling pathway TGF-beta signaling ER-nucleus signaling pathway Golgi-ER traffic Golgi organization Golgi vesicle transport mRNA destabilization Protein dephosphory-lation Signaling by EGFR and NGF Vesicle docking Deadenylation of mRNA Wound healing Ephrin receptor signaling Anatomical structure maturation Actomyosin structure organization G alpha (12/13) signaling events Axon guidance Membrane trafficking Transferase activity Cell cycle a
YAP DNA-binding targets YAP co-expressed genes TAZ co-expressed genes Combined evidence only
54 4 18 26 4
YAP ChIP-seq YAP mRNA-seq
TAZ mRNA MAPK8 YAP1 TNIK TEAD1 WWC1 MINK1 YWHAQ LATS1 STK3 WWTR1 TEAD3 MAP4K3 MAPK9 b c 1180 (61) 540 (5) 886 (45)
Pathway genes TF target genes
d
YAP DNA-binding targets YAP co-expressed genes TAZ co-expressed genes Brown P-value, –log10
0.5 30 PRKACB PRKAB1 APC2 SMARCA4 MAPK8 GRp20 APC CTNNB1 NCK2 GLIS3 TJP2 WNT2B PAK2 GATAD2B PPP2R1B PPP2CA FBXW11 CAPZB SUZ12 MTA3 ID2 FGF1 GTF3C2 RPC155 GNAI2 WWTR1 NANOG SMAD3 ZNF217 POU5F1 PPP2R2A RAC1 PARD3 HDAC8 RUNX1 PARD6B CDC42 HIPK1 PRDM1 ACTB PRKCZ IQGAP2 CD44 ESRRA CTNNA1 SIRT6 PIK3CD GNAL FAM48A BRF2 MARK2 GSN DLG2 LATS1 ZNF274 NFE2 TNIK MAP2K1 TP73 NEDD4 IKZF1 DLG1 MOB1A VGLL4 TP63 CSNK1E RASSF5 Regulation of cell motility Inhibition of SMAD activity Histone modification Regulation of cellular protein organization Signaling by Rho GTPases Regulation of GTPase activity
into relevant biological processes and carry coding and non-coding mutations. In the integrative analysis of molecular alterations in breast cancer subtypes, wefind a spectrum of genes and pathways whose molecular signatures in the tumors or the microenvironment have potential prognostic significance. A subset of thesefindings, such as anti-apoptotic signaling, is only apparent through data integration. In thefinal example, we use ActivePathways to associate the co-expression and DNA-binding networks of Hippo master regulators to downstream pathways and processes with multi-omics evidence.
Our general pathway analysis strategy is applicable to diverse kinds of datasets where well-calibratedP-values are available for the entire set of genes or proteins. A multi-omics study may quantify genes using a series of genomic, transcriptomic and proteomic experiments and compute corresponding P-values. Data from epigenomic experiments and genome-wide association
studies can be also analyzed after signals have been appropriately mapped to genes, for example by identifying ChIP-seq peaks in gene promoters similarly to our GTEx analysis. Clinical and phenotypic information of patients can be also included through association and survival statistics, as shown in our analysis of prognostic signatures of breast cancer subtypes. Our method is expected to work with raw, unadjustedP-values and also withQ -values adjusted for multiple testing, however it is primarily intended for unadjustedP-values for increased sensitivity. Acti-vePathways conducts multiple testing correction at the pathway level and reports significantly enriched pathways at a family-wise error rate cutoff, regardless of the gene-specific multiple testing correction applied upstream. Quantification of genes and proteins throughP-values is more robust than quantification through their abundance measures such as counts or fold-changes. P-values provided to ActivePathways need to be computed using dedicated
Fig. 4 Integrative pathway enrichment analysis of Hippo target genes across human tissues. aEnrichment map of GO processes and Reactome
pathways enriched in the target genes of transcriptional regulators YAP and TAZ of the Hippo pathway. Co-expressed target genes of YAP and TAZ across normal human tissues of the GTEx dataset (pathways are shown in green and yellow, respectively) and DNA-binding target genes of YAP from ChIP-seq experiments (shown in blue) were analyzed. Pathways only found through the integration of ChIP-seq and RNA-seq data are shown in red.bEuler diagram shows 106 Hippo-related genes that were significantly enriched in the detected pathways and supported by a combination of signals in RNA-seq and ChIP-seq datasets. Core Hippo genes detected in the analysis are listed.cRegulatory network of 17 TFs and 1,426 target genes detected in the ActivePathways analysis of gene sets representing transcription factor target genes. Transcription factors with enriched target genes in the YAP/TAZ regulome are shown in multi-colored circles. Target genes are colored by increasing statistical significance (turquoise to red).dIntegrative analysis of pathways and GO processes is complementary to the analysis of transcription factor targets. Euler diagram shows total number of pathway-associated identified in the analysis of GO and Reactome terms (left) and TF target genes from ENCODE (right). Numbers of Hippo-related genes are shown in brackets.
93 87 79 87 65 79 64 68 62 68 42 73 22 58 36 14
*
0 25 50 75 Number of genes PCA WG consensus lists ActivePathways
HotNet
SSA-ME
NBDI
Hypergeometric test induced subnetworks
CanIsoNet Coding Non-coding a 0 200 400 600 ActivePathways: integrated gene list + ranked hypergeometric test (Q < 0.05)
Q < 0.05 Q < 0.1 Q < 0.25 P < 0.1 Number of pathways Evidence Unique results CDS Combined
Promoter; 5′UTR; 3′UTR; enhancer
358 APWQ < 0.05 168 65 358 APWQ < 0.1 168 66 385 APWQ < 0.25 141 92 APW P < 0.1 72 297 454 Single gene lists by cutoff + ranked hypergeometric test (Q < 0.05)
P < 0.1
n = 72
b
Fig. 5 Benchmarking of ActivePathways. aComparison of ActivePathways with six additional pathway and network analysis methods used in the PCAWG
pathway and network consensus analysis. ActivePathways best recovers the consensus lists of pathway-implicated driver genes with coding and non-coding mutations (indicated by asterisk). The consensus lists are shown in the leftmost bars of the plot and have been compiled through a majority vote of the seven methods in the PCAWG pathway and network analysis working group.bComparison of ActivePathways (leftmost bars) and common pathway enrichment analysis using multiple significance cut-offs of PCAWG gene lists with protein-coding and non-coding mutations. ActivePathways shows increased sensitivity of pathway analysis even at the most lenient gene list significance cut-offs and recovers additional pathways only detected through integration of multiple datasets (dark red).
methods for individual omics platforms such that inherent biases in the data are accounted for prior to pathway analysis. In our example of cancer driver discovery, appropriately computed P -values of driver gene predictions from the PCAWG project13 account for confounding factors of somatic mutations, such as gene sequence length and nucleotide content, mutation signatures active in different types of tumors45and biological correlates of mutation frequency such as transcription and replication tim-ing46. On the one hand, considering all such variations directly in the pathway enrichment analysis would require substantially more complex models. On the other hand, directly analyzing pathways using simpler metrics (such as mutation counts or frequencies) would propagate any upstream biases to the pathway enrichment analysis and cause challenges with false positives and data interpretation. Thius, given appropriately derived P-values for genes, proteins and other molecules, ActivePathways can be applied to a wide range of analyses.
Our method comes with important caveats. First, we only eval-uate genes and proteins annotated in pathway databases. Such databases have variable coverage, rely on frequent data updates47 and may miss sparsely annotated candidate genes. The most general type of pathway enrichment analysis considers biological processes and molecular pathways however many kinds of gene sets available in resources such as MSigDB48can be used to expand the scope of ActivePathways. Second, pathway information is highly redundant and analyses of rich molecular datasets often result in many sig-nificant results reflecting the same underlying pathway. We address this redundancy by visualizing and summarizing pathway results as enrichment maps1,20that summarize multiple similar pathways and processes into general biological themes. Statistical inflation of results accompanied by biological redundancy is addressed by a stringent multiple testing correction. Third, the analysis treats pathways as gene sets and does not consider interactions of genes in pathways. This simplified strategy allows us to consider a wider repertoire of pathways and processes as reliable mechanistic inter-actions are often context-specific and limited to a small subset of well-studied signaling pathways. Several advanced methods such as HotNet39, PARADIGM49, and GeneMania50 model pathways through gene and protein interactions.
Translation of discoveries into improved human health through actionable mechanistic insights, biomarkers, and mole-cular therapies is a long-standing goal of biomedical research. For example, next-generation cancer genomics projects such as ICGC-ARGO aim to collect multi-omics datasets with detailed clinical profiles that will present new challenges for pathway and network analysis techniques. In summary, ActivePathways is integrative pathway analysis method that improves systems-level understanding of cellular organization in health and disease.
Methods
Integrated and evidence-based gene lists. The main input of ActivePathways is a matrix ofP-values where rows include all genes of a genome and columns correspond to evidence from omics datasets. To interpret multiple omics datasets, a combinedP-value is computed for each gene using a data fusion approach, resulting in an integrated gene list. The integrated gene list is computed by merging allP-values of a given gene into one combinedP-value using the Brown’s exten-sion18of the Fisher’s combined probability test that accounts for overall
covaria-tion ofP-values from different sources of evidence. The integrated gene list of BrownP-values is then ranked in order of decreasing significance andfiltered using a lenient threshold (unadjustedP< 0.1 by default). Evidence-based gene lists representing different omics datasets are based on rankedP-values from individual columns of the input matrix andfiltered using the same significance threshold. Statistical enrichment of pathways. Statistical enrichment of pathways in ranked lists of candidate genes is carried out with the ranked hypergeometric test. The test considers one pathway gene set at a time and analyzes increasing subsets of input genes from the top of the ranked gene list. The same procedure is used for
integrated and evidence-based gene lists. At each iteration, the test computes the hypergeometric enrichment statistic andP-value for the set of genes shared by the pathway and top sub-list of the input gene list. For optimal processing speed, only gene lists ending with a pathway-related gene are considered. The ranked hyper-geometric statistic selected the input gene sub-list that achieves the strongest enrichment and the smallestP-value as thefinal result for the given pathway, as:
Ppathway;G ¼min;argminn X minðn;KÞ x¼k K k NK nk N n ;
wherePpathwaystands for the hypergeometricP-value of the pathway enrichment at
the optimal sub-list of the significance-ranked candidate genes,Grepresents the length of the optimal sub-list, i.e., the number of top genes from the input gene list,
Nis the number of protein-coding genes with annotations in the pathway database, i.e., in Gene Ontology and Reactome,Kis the total number of genes in a given pathway,nis the number of genes in a given gene sub-list considered, andkis the number of pathway genes in the considered sub-list. For a conservative estimate of pathway enrichment, we consider as backgroundNthe universe of genes contained in input gene sets (terms from pathway databases and ontologies) rather than the complete repertoire of protein-coding genes. To obtain candidate genes involved in the pathway of interest, we intersect pathway genes with the optimal sub-list of candidate genes. The ranked hypergeometricP-value is computed for all pathways and resultingP-values are corrected for multiple testing using the Holm-Bonferroni method of family-wise error rate (FWER)19. Significant pathways are
reported by default (Q< 0.05).
Evaluating omics evidence of enriched pathways. Each evidence-based gene list derived from a single omics dataset is also analyzed for enriched pathways with the ranked hypergeometric test. Pathways found in the integrated gene list are then labeled for supporting evidence in the case they are also found as significant in any evidence-based gene list. A pathway is considered to be found only through data integration and labeled as combined-only if it is identified as enriched in the inte-grated gene list but not identified as enriched in any of the evidence-based gene lists at equivalent significance cut-offs (defaultQ< 0.05). Each detected pathway is addi-tionally annotated with pathway genes apparent in the optimal sub-list of candidate genes separately for the integrated gene list and each evidence-based gene list.
Pathways and processes. We used gene sets corresponding to biological processes of Gene Ontology16and molecular pathways of the Reactome database17
down-loaded from the g:Profiler web server10on Jan 26th 2018. Large general gene sets
with more than a thousand genes and small specific gene sets with less thanfive genes were excluded to avoid statistical inflation of large gene lists and inter-pretation challenges with very small lists.
Enrichment map visualization. ActivePathways creates inputfiles for the EnrichmentMap app20of Cytoscape51for network visualization of similar
path-ways and their coloring according to supporting evidence. Enrichment maps for adenocarcinoma driver mutations, prognostic quantification of molecular altera-tions of breast cancer, and transcriptional networks downstream of Hippo sig-naling were visualized with stringent pathway similarity scores (Jaccard and overlap combined coefficient 0.6) and manually curated for the most representative groups of similar pathways and processes. Singleton pathways that were redundant with larger groups of pathways were merged with the latter or discarded. Coloring of pathways in the adenocarcinoma enrichment map was rearranged by merging colors of pathways supported by non-coding mutation scores of promoters, enhancers and/or UTRs into one group.
Coding and non-coding mutations of the PCAWG dataset. We used
Active-Pathways to analyze driver predictions of coding and non-coding mutations across white-listed 2583 whole cancer genomes of the ICGC-TCGA PCAWG project.P -values of driver predictions were computed separately for protein-coding sequences, promoters, enhancers and untranslated regions (UTR3, UTR5 across multiple subsets of samples representing histological tumor types and pan-cancer cohorts as reported in the PCAWG driver discovery study13. We used
gene-enhancer mapping predictions provided by PCAWG, excluded gene-enhancers with more thanfive target genes, and selected the most significant enhancer for each gene, if any. UnadjustedP-values for coding sequences, promoters, enhancers and UTRs were compiled as input matrices and analyzed as described above. MissingP -values were conservatively interpreted as ones. Results from ActivePathways were validated with two lists of cancer genes. Predicted drivers from the PCAWG consensus analysis13were selected as statistically significantfindings (Q< 0.05)
following a stringent multiple testing correction spanning all types of elements (exons, UTRs, promoter, enhancers). The curated list of known cancer genes was retrieved from the COSMIC Cancer Gene Census (CGC) database11. One-tailed
Fisher’s exact tests were used to estimate enrichment of these genes in our results, using all human protein-coding genes as the statistical background set.
Prognostic CNA and mRNA signals in breast cancer. ActivePathways was used to evaluate prognostic pathways in breast cancer subtypes. Multiple types of omics data were used for an integrative analysis: mRNA gene expression data and gene copy number alteration (CNA) data of the were derived from the METABRIC cohort of 1991 patients with a single primary fresh frozen breast cancer specimen each15. Curtis et al.15classified the patients into the intrinsic breast cancer subtypes
using the PAM50 mRNA-based classifier52resulting in 330 basal-like breast
can-cers, 238 HER2-enriched breast cancan-cers, 721 luminal-A breast cancan-cers, 491 luminal-B breast cancers. Using these data, we computationally deconvolved tumor cell (TC) mRNA and tumor adjacent cell (TAC) mRNA abundance levels from the bulk profiled specimens. TC mRNA was deconvolved using the ISOpure21method
release 2010b in MATLAB. TAC mRNA abundance profiles were computed using the ISOpure.calculate.tac function from the R package ISOpureR22v1.1.2. The
deconvolution analyses were performed independently for each breast cancer subtype. The mRNA univariate survival analysis was conducted as follows. For each gene, patients were dichotomized based on mRNA abundance. Dichot-omization was either based on the median mRNA abundance for that gene or a
fixed value of 6.5. Based on the mRNA abundance distribution of genes on the Y chromosome in female samples, the value 6.5 was estimated as the threshold for noise for non-expressed genes. Median dichotomization was used if the median was above 6.5 or if there were no events in one of the groups when dichotomizing based on 6.5. The high and low groups based on mRNA abundance were compared by univariate log-rank tests for overall patient survival. TC and TAC mRNA abundance values were evaluated independently. Survival modeling was performed in the R statistical environment (v3.4.3) using the survival package (v2.42–3). The CNA univariate survival analysis was conducted as follows. For each gene, we assessed whether more gains or losses were apparent. The copy number status with a higher count was subsequently used to separate patients into two groups: those with the chosen copy number status and the remaining patients. The two groups were then used for overall survival modeling with log-rank tests.
Hippo pathway target genes in mRNA and ChIP-seq data. This analysis
included two types of omics data, mRNA abundance measurements from RNA-seq experiments and transcription factor DNA-binding measurements from chromatin immunoprecipitation sequencing (ChIP-seq) experiments. The RNA-seq dataset of human tissues was downloaded from GTEx v7 data portal (https://www.gtexportal.
org/home/). The dataset included transcript abundance values of 21,518
protein-coding genes in 11,688 samples across 53 tissues. Tissues with less than 25 available samples and low gene expression (mean TPM < 1.0; transcripts per million) were excluded from further analysis, resulting in 40 tissues and 9672 samples with mRNA abundance profiles of 19,025 genes. Transcriptional target gene lists for the master transcription factors YAP and TAZ (encoded byYAP1, WWTR1) were predicted separately in the following two steps. First, we computed pairwise Pearson correlations between a given TF and all other genes within a tissue of interest and ranked these by the significanceP-value of positive correlations. Second, the resulting ranked gene lists were then aggregated into one master target gene list across the GTEx tissues using the robust rank aggregation (RRA) method32with default parameters (Qgene< 0.05). FDR-adjusted values of genes
from RRA for YAP and TAZ were used as thefirst and second evidence for input of ActivePathways, respectively. For DNA-binding targets of YAP, we retrieved ChIP-seq binding sites in three cell lines (CCLP1, MSTO, and HUCCT1) from an earlier study33that were reprocessed in the ReMap database34. Binding sites werefiltered
by statistical significance (Q< 0.05) and mapped to gene promoters of the human genome (hg19) using gene promoters defined in the PCAWG driver analysis13. If a
promoter had multiple binding sites, the site with the strongest FDR-value was selected as a representative site for that gene. FDR-adjusted values of genes with YAP DNA-binding sites were used as the third evidence for input of Active-Pathways. Significantly enriched pathways among the putative target genes of YAP and TAZ were subsequently detected using ActivePathways. We compiled a list of 308 Hippo-related genes from the KEGG pathway database35and two recent
review papers30,31. To validate the analysis, we tested the overall sets of genes
identified by ActivePathways for enrichment of Hippo-related genes using Fisher’s exact tests. The Hippo analysis was conducted separately for two collections of functional gene sets. First, we tested GO biological processes and Reactome pathways similarly to analyses described above. Second, we used gene sets corre-sponding to transcription factor binding sites (TFBS) derived from the ENCODE project36.
Method benchmarking. We benchmarked ActivePathways using multiple
approaches, including simulated datasets ofP-values, method parameter variations, and partial replacement ofP-values scores with insignificantP-values. Bench-marking was performed on the PCAWG predictions of cancer driver genes with coding and non-coding mutations. To evaluate the false discovery rate of Active-Pathways, we created simulated datasets by reassigning all observedP-values to random genes and their genomic elements. Simulations were conducted separately for different tumor cohorts. One thousand simulated datasets were analyzed with ActivePathways and those with at least one significantly detected pathway counted towards false discovery rates. A separate set of simulations maintained the posi-tions of non-codingP-values among genes and randomly reassignedP-values
corresponding to protein-coding mutations, expectedly leading to a reduction in detected pathways as the PCAWG datasets primarily included strongP-values for genes with frequent protein-coding mutations. Quantile-quantile analysis and QQ-plots were used to compareP-value distributions of pathways discovered from true
P-values, partially shuffled P-values (true non-coding and shuffled protein-coding
P-values), and fully shuffledP-values. To evaluate robustness of ActivePathways, we randomly replaced a fraction of significant driverP-values in the true dataset (P< 0.001) with insignificantP-values (P=1). We tested different fractions of missing values (10, 25, and 50%) across a thousand datasets of randomly selected missing data points. We concluded that most PCAWG cohorts included sig-nificantly enriched pathways even with large fractions of missing data. To further evaluate robustness, we tested different values of the BrownP-value threshold used to select the integrated gene list for pathway enrichment analysis. The default parameter value (Pgene< 0.1) was compared to alternative values (0.001, 0.01, 0.05,
and 0.2). We concluded that ActivePathways found enriched pathways in most tumor cohorts even at more stringent gene selection levels.
Ethical review. Sequencing of human subjects’tissue was performed by ICGC and TCGA consortium members under a series of locally approved Institutional Review Board (IRB) protocols as described in Hudsonet al. Informed consent was obtained from all human participants. Ethical review of the current data analysis project was granted by the University of Toronto Research Ethics Board (REB) under protocol #30278,“Pan-cancer Analysis of Whole Genomes: PCAWG”. Reporting summary. Further information on research design is available in the Nature Research Reporting Summary linked to this article.
Data availability
Somatic and germline variant calls, mutational signatures, subclonal reconstructions, transcript abundance, splice calls and other core data generated by the ICGC/TCGA
Pan-cancer Analysis of Whole Genomes Consortium is described in the marker paper4and
available for download athttps://dcc.icgc.org/releases/PCAWG. Additional information
on accessing the data, including raw readfiles, can be found athttps://docs.icgc.org/
pcawg/data/. In accordance with the data access policies of the ICGC and TCGA projects, most molecular, clinical and specimen data are in an open tier which does not require
access approval. To access potentially identifiable information, such as germline alleles
and underlying sequencing data, researchers will need to apply to the TCGA Data Access
Committee (DAC) via dbGaP (https://dbgap.ncbi.nlm.nih.gov/aa/wga.cgi?page=login)
for access to the TCGA portion of the dataset, and to the ICGC Data Access Compliance
Office (DACO;http://icgc.org/daco) for the ICGC portion. In addition, to access somatic
single nucleotide variants derived from TCGA donors, researchers will also need to
obtain dbGaP authorization. Derived PCAWG datasets described specifically in this
manuscript can be found at the locations listed below. Additional relevant datasets are
listed in the PCAWG study of pathways and networks14.
Label Synapse ID ICGC DCC URL ICGC DCC
Filename Access (Open/ Controlled) PCAWG driver P-values syn8494939 https://dcc.icgc. org/releases/ PCAWG/ networks/ final_integration_ results_2017_ 03_16.tar.gz Open PCAWG pathway and network method results syn21413360 https://dcc.icgc. org/releases/ PCAWG/ networks/ pathway_and_ network_method_ results.tar.gz Open PCAWG pathway and network consensus results syn11654843 https://dcc.icgc. org/releases/ PCAWG/ networks/ method_results_ 2017_10_10.tar.gz Open Enhancer-gene mappings syn7201027 https://dcc.icgc. org/releases/ PCAWG/ networks/ map.enhancer. gene.txt.gz Open
Coding and non-coding elements syn21416282 https://dcc.icgc. org/releases/ PCAWG/ networks/ gene-coding-and- non-coding-elements.tar.gz Open Code availability
ActivePathways is freely available as an R package and source code on the GitHub
repositoryhttps://github.com/reimandlab/ActivePathwaysand in the Comprehensive R
Archive Network (CRAN). Additional scripts are available upon request. The core computational pipelines used by the PCAWG Consortium for alignment, quality control
and variant calling are available to the public athttps://dockstore.org/search?search=pcawg