University of Missouri, St. Louis
IRL @ UMSL
Theses UMSL Graduate Works
4-18-2018
Efficient Reduced BIAS Genetic Algorithm for
Generic Community Detection Objectives
Aditya Karnam Gururaj Rao
Follow this and additional works at:https://irl.umsl.edu/thesis
Part of theArtificial Intelligence and Robotics Commons,Bioinformatics Commons, Computational Biology Commons,Computational Neuroscience Commons,Databases and Information Systems Commons,Discrete Mathematics and Combinatorics Commons,Genetics Commons,Genomics Commons,Molecular Genetics Commons,Other Genetics and Genomics Commons, and theTheory and Algorithms Commons
This Thesis is brought to you for free and open access by the UMSL Graduate Works at IRL @ UMSL. It has been accepted for inclusion in Theses by an authorized administrator of IRL @ UMSL. For more information, please [email protected].
Recommended Citation
Gururaj Rao, Aditya Karnam, "Efficient Reduced BIAS Genetic Algorithm for Generic Community Detection Objectives" (2018).
Theses. 331.
Efficient Reduced-Bias Genetic Algorithm for Generic
Community Detection Objectives
Aditya Karnam Gururaj Rao
Bachelor of Technology in Computer Science and Engineering, Vellore Institute of Technology, 2016
A Thesis Submitted to The Graduate School at the University of Missouri-St. Louis in partial fulfillment of the requirements for the degree
Master of Science in Computer Science
May 2018 Advisory Committee Dr. Sharlee Climer Committee Chairperson Dr. Cezary Janikow Committee Member Dr. Sanjiv Bhatia Committee Member Dr. Mark Hauschild Committee Member
Table of Contents
ABSTRACT ... 4 1. INTRODUCTION ... 7 BACKGROUND ... 7 MOTIVATION ... 9 2. RELATED WORKS... 11 NETWORKS ... 11PROPERTIES OF BIOLOGICAL NETWORKS ... 12
CLUSTERING ... 12 GENETIC ALGORITHMS ... 19 3. DATASETS... 25 FOOTBALL NETWORK ... 25 KARATE CLUB ... 26 DOLPHIN NETWORK ... 26
BOOKS ABOUT USPOLITICS ... 26
ENRON EMAIL ... 26
ALZHEIMER’S DISEASE ... 27
4. METHODS ... 29
NETWORK MODEL ... 30
ELITISM ... 34 SELECTION ... 34 UNIFORM CROSSOVER ... 35 MUTATION ... 35 GENE REPAIR ... 36 GAISLANDS ... 37 EFFICIENCY ... 37 FITNESS FUNCTION ... 39 SUMMARY ... 39 5. RESULTS ... 40 ACCURACY ... 41 EFFICIENCY ... 41 FITNESS LANDSCAPE... 42 SUMMARY ... 46 6. CONCLUSION ... 47 FUTURE WORK ... 49 REFERENCES ... 51
Abstract
The problem of community structure identification has been an extensively investigated area for biology, physics, social sciences, and computer science in recent years for studying the properties of networks representing complex relationships. Most traditional methods, such as K-means and hierarchical clustering, are based on the assumption that communities have spherical configurations. Lately, Genetic Algorithms (GA) are being utilized for efficient community detection without imposing sphericity. GAs are machine learning methods which mimic natural selection and scale with the complexity of the network. However, traditional GA approaches employ a representation method that dramatically increases the solution space to be searched by introducing redundancies. They also utilize a crossover operator which imposes a linear ordering that is not suitable for community detection.
The algorithm presented here is a framework to detect communities for complex biological networks that removes both redundancies and linearity. We also introduce a novel operator, named Gene Repair. This algorithm is unique as it is a flexible community detection technique aimed at maximizing the value of any given mathematical objective for the network. We reduce the memory requirements by representing chromosomes as a 3-dimensional bit array. Furthermore, in order to increase diversity while retaining promising chromosomes, we use natural selection process based on tournament selection with elitism. Additionally, our approach doesn’t require prior information about the number of true communities in the network. We apply our novel
algorithm to benchmark datasets and also to a network representing a large cohort of AD cases and controls.
By utilizing this efficient and flexible implementation that is cognizant of characteristics for networks representing complex disease genetics, we sift out communities representing patterns of interacting genetic variants that are associated with this enigmatic disease.
Preface
This thesis is submitted to fulfill the requirements of the Master of Science in Computer Science. The project was done by Aditya Karnam Guruaj Rao during the period July 2017 to May 2018 at the department of Mathematics and Computer Science, University of Missouri, St. Louis (UMSL). The work was supervised by Dr. Sharlee Climer.
Acknowledgments
I would like to thank my supervisor Dr. Sharlee Climer for her assistance throughout the thesis. She assisted me on all the stages of my thesis and always gave me good ideas and helpful suggestions. Meanwhile, I would like to thank Dr. Cezary Janikow for giving me ideas on genetic algorithms; as well as Dr. Sanjiv Bhatia and Dr. Mark Hauschild for their expertise and contributions. And thanks to my friend and fellow research assistant Michael Chan for his help in editing and proofreading. Special thanks to my parents and my friends for their support.
I dedicate this thesis to my late grandfather, Bannihatti Venkoba Rao who was my inspiration to my achievements throughout my educational success.
Chapter 1
Introduction
Background
Recent research has shown enormous growth in whole-genome level study of complex diseases such as Alzheimer’s Disease. The challenging aspect of studying these complex diseases involve understanding the biological effects of inherited variations in DNA structure between individuals. A type of highly common genetic variation is represented as single DNA building block alterations; such mutations have received considerable attention in terms of detection of a particular disease (Krishnan VG, 2003). These variations are characterized by single nucleotide polymorphism (SNP). SNPs are single nucleotide alterations found in every 300 to 1000 nucleotides in genomic DNA and cause personal differences in phenotypes as well as underlying pathogenesis of many diseases (Human Genetic Variation [Internet], 2007). SNPs can be used as genomic markers revealing an individual’s susceptibility to certain disease, to produce new approaches for treatment, and to take prohibitive precaution. SNP association studies are widely used to determine possible relations between genetic variations and a given disease. The states of SNPs are sequenced for a number of cases exhibiting the disease and a number of normal controls. Many big datasets have been generated with millions of SNP markers for thousands of samples. Deciphering hidden patterns in SNP data proffers a prodigious opportunity to strengthen the understanding of functional genomics. Traditional
Genome-Wide Association Studies (GWAS) utilize straightforward association testing, in which single markers are tested one at a time for associations with the disease. However, for most human diseases of interest, GWAS have been unable to capture the full heritability, likely due to the fact that complex diseases arise due to a combination of markers. Recently, combinatorial GWAS (cGWAS) methods have been developed, such as PLINK’s Fast Epistasis (Purcell, et al., 2007), which exhaustively tests every pair of markers for associations. Unfortunately, pairwise testing has had limited success and straightforward testing for every trio or higher-ordered combination is computationally intractable. This poses challenges for extracting and deciphering the useful information hidden in these datasets and undermines attempts to understand the biological processes that take place in organisms in relation to their genetic composition and the environment.
A promising approach to test combinatorial sets of markers for association is based on the use of network modeling, in which markers are represented as nodes, and edges are used to connect pairs of markers that are correlated (Wang, et al., 2015). This is based on an expectation that higher-ordered patterns will appear as clusters, or communities, within the network. Extracting meaningful clusters from complex networks is essential for the use of networks in this respect.
Clustering is an essential and fundamental data mining technique to reveal natural structures and underlying patterns. The clustering of genetic data has proven to be beneficial in advancing knowledge about natural structures, cellular processes, and understanding gene regulation. For example, clustering gene data identifies homology,
which is important in vaccine design (Lizotte-Waniewski, et al., 2000). Moreover, network modeling and clustering are effective for mining useful information from noisy data, and have been widely used in diverse domains, including social sciences, physics, computer science, and business.
Motivation
Modeling complex systems as networks and extracting clusters from these networks is a promising method for mining valuable information from large datasets, but many challenges exist. Many clustering approaches exist, and it is not readily clear which of them will provide the most meaningful information for a given dataset. Also, optimally solving popular clustering objectives may require exponential computation time so it is usually necessary to utilize approximation techniques. Many approximation approaches exist and, in this thesis, we utilize Genetic Algorithms (GAs). GAs have many desirable features, but previous instantiations have included some undesirable properties. For example, to our knowledge, all approaches in this domain use a data representation that leads to redundancies that dramatically increase the search space. Also, previous GA approaches for clustering have utilized a generic operator that imposes linear ordering of the nodes, which isn’t appropriate in this domain. Furthermore, they may be improved by modifications of chosen operations and the use of additional operators.
To overcome these issues, in this thesis, I propose a new efficient GA-based optimization technique that aims to identify communities based on optimizing any chosen objective function. Our GA is efficient in searching complex solution space, which makes it
suitable for a problem of such scale. The algorithm does not impose a given number of clusters; rather it evolves to an optimal number of clusters during the clustering phase.
In short, this thesis sets the following goals:
• Propose and implement a Genetic Algorithm for clustering a given network.
• Create a data representation that does not introduce redundancies.
• Introduce a novel GA operator: GARepair.
• Identify operators and techniques that are suitable for this domain by comparing different representation of solutions described in the literature.
• Develop a method that uses any arbitrary fitness function.
• Create an efficient implementation.
• Evaluate the performance with results from previously published GA approaches.
Chapter 2
Related Works
To understand the proposed GA in this thesis, it is important to understand networks and their properties. The next subsection summarizes key points. Typical network analysis approaches utilize community detection, or clustering, algorithms to cluster the nodes, as described below. After presenting background information regarding networks and clustering approaches, the next section will overview GAs.
Networks
Networks are popular modeling tools in diverse fields because they can be used to represent many real world systems. More specifically, nodes in a network are generally connected to one another in a way that represents certain properties of a given domain. One of the most important network properties to investigate is the community structure. Community structure captures relationships among collections of nodes. When the nodes in a network are more strongly related, they are grouped together, resulting in the formation of a distinct community or cluster. These clusters can reveal information about the interaction of the central forces represented by the network and how those forces affect the individual nodes in the clusters. The problem of accurately detecting these communities is a pressing issue for extracting useful information from big data and there have been numerous clustering approaches proposed.
Properties of Biological Networks
Some biological networks tend to be highly clustered and have small node to node distances (Martin G., 2005). For some datasets, there are very few connected nodes and they end up being sparse networks comprised of a few giant chunks of densely connected structures. Snel, et al, (Snel, 2002) devised ways to obtain protein networks using a pairwise correlation technique. The resulting networks contain one giant component and a multitude of small disjoint clusters. Many of these small clusters were comprised of only one or two nodes, and are denoted as singletons and doubletons, respectively. The giant component in itself turned out to be a combination of sub-clusters related to each other by multifunctional essential linkage proteins. All of the other smaller subsets were reported to be homogeneous functional composition. These properties lead to difficulties for objective functions designed for clustering general networks and hinder the rendering of optimal and meaningful clustering results.
Clustering
Clustering is an unsupervised learning technique that has been widely applied in diverse fields such as machine learning, data mining, pattern recognition, image analysis, and bioinformatics. However, no single clustering algorithm is the best for all networks (Pirim, Ekşioğlu, Perkins, & Yüceer, 2012). The clustering algorithm should be intelligently chosen for the specific domain at hand. Creating clusters involves identifying common properties among the data objects and grouping them accordingly. A fundamental benefit of network clustering approaches is that pairwise relationships are
computed between all nodes, yet higher-ordered relationships can potentially be observed. For large datasets, computation of pairwise relationships may be practical, while systematic computations of three-way or higher relationships are likely to be intractable.
A key to network modeling is the selection of a method to evaluate pairwise relationships and determine when to place an edge between two nodes. For biological datasets, this is commonly achieved by using Pearson’s Correlation Coefficient (PCC). PCC is a measure of linear correlation between two variables 𝑋 and 𝑌. It has values between -1 to +1, where +1 is total positive linear correlation, 0 is no correlation, and -1 is total negative correlation. PCC is measured for a sample using the function:
𝑟 = 𝑟&' =
𝑛 ∑ 𝑥+𝑦+ − ∑ 𝑥+∑ 𝑦+ .𝑛 ∑ 𝑥+/− (∑ 𝑥
+)/.𝑛 ∑ 𝑦+/− (∑ 𝑦+)/
where n is the sample size and 𝑥+ ∈ 𝑋 and 𝑦+ ∈ 𝑌 are single samples at index i.
Another commonly used metric is Euclidean distance, D. The distance between two nodes x and y, defined by ||x - y||, is commonly used for networks representing physical objects. Other methods like Hamming distance could also be used for computing the distance.
More recently a unique Customized Correlation Coefficient (CCC, pronounced as ‘triple C’) was designed exclusively for SNP data (Climer, Yang et. al 2014; Climer, Templeton, Zhang 2014). CCC effectively accommodates genetic heterogeneity, in
which different subsets of individuals exhibit a given disease due to different genetic patterns. For SNPs with two nucleotide states, there are precisely four types of relationships possible for a given pair of SNPs. CCC estimates whether any one of the four relationships for two SNPs appears more than what would be expected, given the frequencies of the variants. CCC is fundamentally different from other correlation measures in two aspects. First, it is not a universal measure as it evaluates each portion of the data that exhibits a relationship and is not diminished by unrelated data that is uncorrelated for the pair of markers. Second, CCC returns multiple values instead of a single scalar. This property arises from examining four different types of relationships for the markers and provides an extra advantage as the type of relationship is immediately available.
Note that all of these metrics could provide weights for edges, however, community detection is typically applied to networks with unweighted edges. Consequently, a threshold is commonly employed, and an edge is placed if the correlation or similarity exceeds the threshold.
Though several approaches are available for clustering, difficulty arises when an experimental dataset is being clustered without prior knowledge about the information contained in the nodes or properties they emit. For example, clustering could be partial or complete, a partial clustering doesn’t assign all the nodes into clusters. Partial clustering tends to be more suitable for biological datasets (Jelili, et al., 2016), such as data
representing genetic markers, for which many markers may not be correlated with other markers. Another concern is the expected shape of the clusters, which is discussed below.
The problem of accurately detecting communities is a pressing issue and there have been numerous different community detection approaches proposed. Some available software, such as DBSCAN (Martin, Hans-Peter, Jörg, & Xiaowei, 1996), are algorithmic, with no precise objective function defined, while others aim to optimize specific objectives. Several objective functions are proposed for community detection in the literature, such as K-Means clustering (Jain, 2010) and Newman-Girvan’s Modularity (Newman M. E., 2006). A basic assumption of K-Means is that clusters have a relatively spherical shape, which may result in incomplete exploration of structural properties of the network and partitioning of elongated clusters. Modularity is a quantitative definition used for assessing the partitioning of a network into clusters that does not assume sphericity. Note that identification of optimal solutions for either Modularity or K-Means is NP-hard and consequently approximation algorithms are utilized.
K-Means aims towards finding K clusters for the network with the following objective function:
min 6 6 𝑑𝑖𝑠𝑡(𝑥 − 𝑐+) &∈<=
>
+?@
where K is the number of clusters, Si is the set of nodes in cluster i, and ci is the current
algorithm (Lloyd, 1982). This algorithm iteratively assigns each node to one of the K
clusters based on a provided measure, such as distance as measured by the shortest path between nodes. K-Means optimizes the distance criterion by minimizing the pairwise distances within cluster, or by maximizing the inter-cluster separation. The algorithm starts by randomly assigning K nodes as centers of clusters and assigns the remaining nodes to these centroids, based upon the chosen measure. For each iteration, the centroids of the current clusters are recomputed, and the remaining nodes are reassigned. Due to this reliance upon centroids, the algorithm tends to identify clusters that are spherical in shape. This sphericity assumption can be deleterious for networks with elongated and/or arbitrarily shaped clusters, as would be expected for most biological networks. Furthermore, the initial random selection of centroids yields different results for independent runs, rendering the algorithm unstable; and different trials may produce diverse results.
Another proposed measure of graph partitioning quality is Modularity (Newman & Girvan, 2004). This measure is commonly used to quantify the performance of clustering algorithms against a null hypothesis. The modularity of clustering is the total number of intra-cluster edges, minus the expected number of such edges if the graph were a uniformly random multigraph subject to the given degree sequence. More specifically, the modularity of the graph is defined as
𝑄(𝐺) ≔ 6 D𝑙+ 𝐸− G 𝑠𝑑+ 2𝐸I / J > +?@
Where li is the number of edges in cluster i, E is the number of edges in the entire
network and sdiis the sum of the degrees of vertices in cluster i. If the number of
intra-cluster edges is the same as what is expected in a random multigraph, then Q = 0. Values approaching Q = 1 indicate a strong community structure according to this objective. In practice these values fall in the range of [0.3, 0.7] for what is commonly considered a ‘strong’ community structure (Newman & Girvan, 2004). However, with this measure, it is difficult to compare two graphs with similar modular structure but different sizes because the larger graph will get a higher modularity value. For a more detailed behavior of the modularity, see Newman (Newman, M. E. J, 2006).
(Shang, Bai, Jiao, & Jin, 2013) propose a community detection method based on the modularity objective function and an improved genetic algorithm (MIGA). MIGA takes the modularity Q as the fitness function and attempts to simplify the algorithm. MIGA uses prior information (the number of community structures) in the initialization, which makes the algorithm more targeted and improves the stability and accuracy of community detection. The number of community structures is known for some real-world networks and this algorithm can immediately use this prior information. For population initialization, MIGA uses the number of community structures based on the given classes of the network. The class labels of nodes in each chromosome are randomly designated within the scope of the given classes.
method has been previously applied for community detection (Gong, Fu, Jiao, & Du, 2011). In MAs, a meme is considered as an individual learning procedure capable of performing local refinements. The goal is to maximize the modularity density (Dλ) using
the following objective function:
𝐷L = 6
2𝜆𝐿(𝑉+, 𝑉+) − 2(1 − 𝜆)𝐿(𝑉+, 𝑉S)R |𝑉+|
U
+?@
When λ = 1, Dλ is equivalent to the ratio association; when λ = 0, Dλ is equivalent to the
ratio cut; when λ = 0. 5, Dλ is equivalent to the modularity density D. So, the general
modularity density Dλ can be viewed as a combination of the ratio association and the
ratio cut. Generally, optimization of the ratio association algorithm often divides a network into small communities, while optimization of the ratio cut often divides a network into large communities. However, in MA, in order to find a better individual, the objective function D must adjust λ, which leads to large amount of computations for Dλ.
Consequently, this approach is unsuitable for the large datasets of interest here.
Similar to MIGA and K-Means, we frequently see algorithms using prior knowledge of the network, namely the number of clusters. These algorithms work well with networks where the partition classes are known. Blindly searching the solution space would be expensive as a large number of K values may need to be tested. To pave our way towards developing a generalized optimization algorithm that does not require this prior information, a promising approach was to develop an appropriate Genetic Algorithm for this domain.
Genetic Algorithms
As previously described, Genetic Algorithms (GAs) have been used to optimize modularity (Newman 2006; Tasgin et al. 2007; Shang, Bai, Jiao, & Jin 2013). GAs are randomized search and optimization techniques guided by the principles of evolution and genetics. They are designed especially for exploring large solution space in polynomial time complexity. GAs flow towards optimal solutions by passing over suboptimal solutions quite rapidly due to the use of the basic tenets of evolution.
Evolution theory involves a population, with selection biasing the search (controlling resource allocation) and mutation/crossover operators leading the search direction: mutation introduces random variations and crossover mixes partial solutions.
GAs mimic basic evolutionary theory. The solution space is expressed in the form of
chromosomes (strings of genes), each of which represents an entire clustering
configuration. A collection of chromosomes is termed as a population. Initially a possibly random set of solutions is generated, which is represented by a population of chromosomes. These chromosomes are then evaluated using a fitness function, which is the objective function, to assess the quality of the solutions. Then, the breeding cycle for generating a new generation of the population is achieved by using Selection, Crossover, and Mutation operators.
Selection is based on the concept of “survival of the fittest”. It involves selecting a portion of the existing population to breed a new generation. Individual solutions are
selected through a fitness-based process, where fitter solutions are more likely to be selected. However, low-fitness individuals may be selected due to the stochastic nature of the algorithm. GAs define fitness over the representation of chromosomes and measure the quality of the solution. The fitness function is problem dependent. Furthermore, we could have multiple fitness functions for assessing the quality of the solution and it might not be immediately clear which objective is most well-suited. The fitness value of a solution is based on mapping of the chromosome to a solution, also called phenotype, meaning the observable characteristics or properties of the individual.
Several selection techniques have been used in GAs. A popular technique is the Fitness Proportionate based solution, also known as roulette wheel selection. The fitness level associated with each chromosome in the population is used to associate a probability of selection for each individual. Usually this is done be assigning a portion of the wheel to each individual proportional to fitness. This is achieved by dividing the fitness of each individual by the total fitness of all the selections. Then a random selection is done similar to the roulette wheel. This selection is strongly biased towards highly fit individuals. A number of GAs use Tournament Selection to reduce this bias to some degree. Tournament selection is based on selecting a pool of random individuals and then having a tournament among them to select the fittest. A Tournament Size is defined to restrict the pool size. If the pool size is equal to the population size, it behaves as a best-selection operator by selecting the best of all individuals. At the other extreme, restricting the size to just one individual causes the behavior similar to complete random selection. Lately, Tournament Selection has proven effective in GAs since they facilitate the
retention of diversity as well as converging towards the best solution. Often, two individuals are selected together in the Tournament. After selection of the two individuals, regarded as parents, they are moved further to the breeding phase.
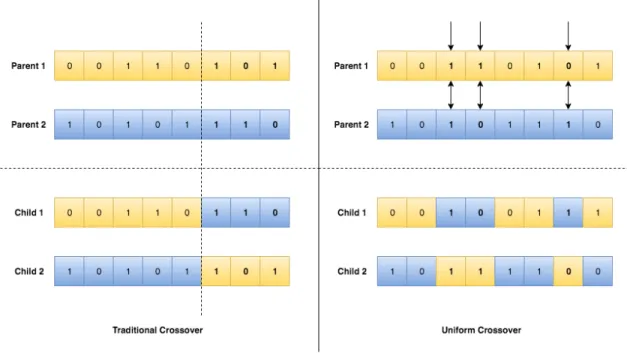
In the breeding phase, GAs utilize Crossover and Mutation operators. Traditional Crossover operators use a single crossover point and all the genes after that selection point are exchanged between chromosomes. Other predominantly used crossover operators are Two-Point Crossover and Uniform Crossover. In a Two-Point crossover, two exchange points are selected randomly where the chromosomes are exchanged. Uniform Crossover uses a fixed mixing ratio between the parents. Unlike single and two-point crossover, which mimics biological processes, the uniform crossover contributes to gene level intermixing rather than segment level.
Eventually the crossover offspring get mutated at select points in the chromosome. A mutation changes the state of a gene to an alternate state. Mutation rates are predefined and mutation sites are randomly selected. Finally, the children are moved to the next generation.
GAs follow two models to maintain and update the population, namely Generational model and Steady State model (Vavak & Fogarty, 1996). The generational model creates new offspring from the members of an existing population using genetic operators and places these offspring in a completely new population, which becomes the existing population for the subsequent generation. The Incremental or Steady State is different
than generational model in that there is typically one single new member being inserted into the new population at a time. A replacement/deletion strategy defines which member would be replaced. Standard replacement strategies are deleting the oldest and the lowest fitness individuals in the population.
GAs are generally run until a termination criteria is reached. This could be a fixed number of iterations the GA will be run, having a target fitness value for the best solution when the algorithm would terminate, or terminating when some specified convergence is met.
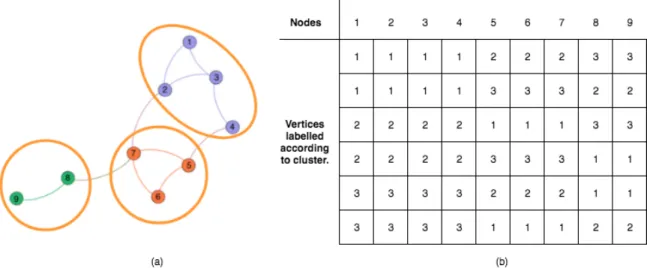
Others (Tasgin, Herdagdelen, & Bingol, 2007; Shang, Bai, Jiao, & Jin, 2013) have proposed GA-based algorithms for network clustering. A major problematic issue with existing algorithms is the representation of cluster information by labelling the vertices.
Figure 1. (a) and (b) depict an example network with three clusters being represented by six distinct encodings. This representation clearly is not efficient since it expands the search space by an order of K! by introducing redundancies.
Figure 1. (a). Sample network with clustering scheme. (b). Conventional method of representing chromosome by labelling vertices with their cluster numbers. This representation yields ambiguous cluster labelling. The table shows the six distinct ways that the clustering indicated by colors in the network could be encoded. In general, if there are K clusters, then there would be K factorial (K!) possible chromosomes representing identical clustering of the nodes.
Redundancy in representation propagates into the breeding phase introducing unwanted solutions. Moreover, these algorithms use conventional one-point or two-point crossover operators. This exchange of genes results in introducing bias towards maintaining linearity of structures, which is not a property of clusters. Genes that are adjacent in the chromosome are less likely to be separated than genes that are farther apart. The ordering of the genes is arbitrary and doesn’t change throughout the evolution, so this approach introduces an unfounded bias. In other words, biological crossover is effective as DNA encodes, transcribes, and translates genetic information in a linear ordering, while no natural linear ordering exists for edges in networks.
In this thesis, we introduce an efficient and flexible GA which addresses the linearity and ambiguous labelling issues. Our approach serves five important contributions. First, our novel two-level method of representing chromosomes drastically reduces redundancies in the solution space that are generated by other GA approaches. Second, we introduce a novel operator, Gene Repair, that improves evolutionary progress in this domain. Third, our approach is optimized for reduced memory consumption with increasing complexity of the networks, resulting in an efficient execution environment. Fourth, our approach is flexible and can be readily adapted for any arbitrary objective function. Fifth, we select operators, settings, and fitness function that are suitable for community detection and remove sphericity and linearity assumptions. We demonstrate this Efficient Reduced-Bias GA (ERBGA) using Modularity and compare our outcomes with previously published results for benchmark instances (Zhangtao & Jing, 2016).
Chapter 3
Datasets
The datasets used in our experiments are described below. They include four commonly cited benchmarks and a network representing genetic markers for Alzheimer’s Disease cases and controls. The benchmark instances utilized have previously reported clustering configurations, but there is no “ground truth” for the ideal clustering available for most.
Football Network
Newman and Girvan (Newman & Girvan, 2004) introduced the United States college football network which is a representation of the schedule of Division I games for the season of year 2000. Nodes in the graph represent teams (identified by their college names) and links represent regular-season games between the two teams they connect. What makes this network interesting is that it incorporates a known community structure which will be called explicit community structure. The teams are divided into conferences containing around 8 and 12 teams each. Games are more frequent between members of the same conference than between members of different conferences, with teams playing on average about seven intra-conference games and four inter-conference games in the 2000 season. Inter-conference play is not uniformly distributed; teams that are geographically close to one another but belong to different conferences are more likely to play one another than teams separated by large geographic distances. This
Karate Club
Karate club (Zachary, 1997) is a social network of friendship between 34 members of a karate club at a US university in the 1970s. This network was generated with edges between two individuals if they were observed to interact outside the normal activities of the club. It is an unweighted graph with 34 nodes and 78 pairwise links or edges.
Dolphin Network
Dolphin (Lusseau, et al., 2003) is an undirected social network of frequent association between 62 dolphins in a community living off Doubtful Sound, New Zealand. The community was stably structured with close and long-lasting association among members. An edge indicates a frequent association. The dolphins were observed between 1994 and 2001. The dataset has 62 nodes and 159 edges.
Books about US Politics
Krebs compiled a network representing books about US politics published around the time of the 2004 presidential election and sold by the online bookseller Amazon.com (Krebs, 2004). Edges between books represent frequent purchase of books by the same buyers. The dataset has 105 nodes and 441 edges.
Enron Email
The Enron email (Klimt & Yang, 2004) network is a social network constructed from email communication in a large corporation. Due to its size it has previously been
corpus, a large set of email messages, was made public during the legal investigation concerning the Enron corporation. The raw Enron corpus contains 619,446 messages sent to and received by 158 Enron employees. From this email corpus a network was constructed in which the email addresses are represented by nodes and emails between two addresses are represented by links. This network contains 77849 nodes and 286379 undirected links. Non-Enron email addresses act as sinks and sources because only emails from and to Enron employees were included in the corpus. The network does not contain an explicit community structure, but community structure has been explored using community detection algorithms.
Alzheimer’s Disease
In addition to these benchmark networks, we use a biological dataset that has arisen as part of an ongoing research project focused on identifying the genetic markers and patterns associated with Alzheimer’s Disease. Genetic data from Alzheimer’s Disease Neuroimaging Initiative (ADNI), NIA Genetics of Alzheimer’s Disease Data Storage Site (NIAGADS), and the Charles F. and Joanne Knight Alzheimer’s Disease Research Center at Washington University (Knight ADRC) were merged to create a single file of SNPs for 4972 individuals. All of these centers used the same genotyping platform, namely the Affymetrix 660k genotyping array. Our collaborator, Dr. Carlos Cruchaga at Washington University School of Medicine, supervised the processing of these data by Zeran Li, in which she applied the CCC metric previously described and constructed a network of inter-correlated SNP variants. This network has properties similar to Snel’s protein network, which is summarized in the Properties of Biological Networks
subsection. We applied Breadth-First Search to extract the large connected component, which consists of 962 nodes and 6672 edges.
Chapter 4
Methods
ERBGA optimizes a given community detection objective function using a set of distinct islands of populations that evolve over a predefined number of iterations or generations
(Gensize). An initial population of chromosomes (individuals) is randomly generated, and
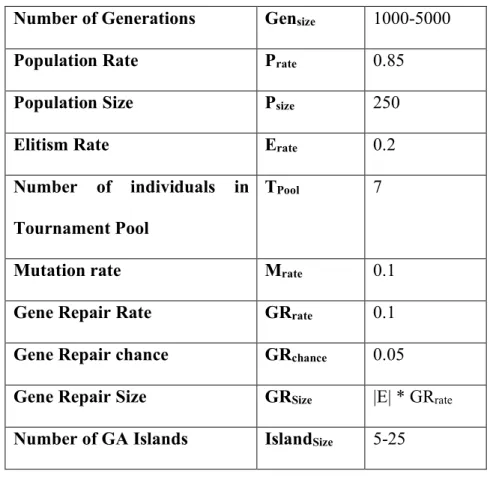
subsequent populations are produced using selection across evolved chromosomes. ERBGA is generational, where we maintain two populations, corresponding to generations i and i+1. Breeding operators are controlled using tuning parameters associated with each operator, as shown in Table 1. Our implementation accepts files in Graph Modeling Language (GML) (Himsolt, 2018) format. GML files are used to define graphs by listing node labels and mapping edges using these labels. No additional sampling of data is required in a phase prior to running the GA.
Table 1. Parameters used by ERBGA. The number of generations varied in our experiments as a fixed computation time was employed. For the Gene Repair Size, ‘E’ is the number of edges in the network.
Number of Generations Gensize 1000-5000
Population Rate Prate 0.85
Population Size Psize 250
Elitism Rate Erate 0.2
Number of individuals in Tournament Pool
TPool 7
Mutation rate Mrate 0.1
Gene Repair Rate GRrate 0.1
Gene Repair chance GRchance 0.05
Gene Repair Size GRSize |E| * GRrate
Number of GA Islands IslandSize 5-25
Network model
The network is defined by an undirected graph G = (V, E) with V vertices and E edges. The edges are denoted by an adjacency list as Adj(u) = (list of end points of edges
incident to vertex u); thus, if vertex i has an edge to vertex j then Adj(i) will have j as a
member in the adjacency list and vice-versa. The degree of node v is denoted by dv.
unique edge identification eid using a function j (𝑢, 𝑣) = |𝑉| ∗ 𝑢 + 𝑣, where u and v
are the endpoints. Furthermore, we define a sorted list, EdgeList comprised of unique edge IDs generated using j. This list is used to map chromosomes back into the network structure. To decode eid back to edge representation E (u, v) we use an inverse function j’. j’(𝑒
+\) = (𝑒+\ / |𝑉|, 𝑒+\ % 𝑉). EdgeList facilitates a unique way of mapping the
edges that eliminates the problems of introducing edges which were not present in the original network. This reduces time and space complexity, while providing consistency into the solutions and the chromosomes being initialized for the GA.
Chromosome representation
In our approach, each clustering solution is defined by a set of removed edges RE = {e1,
e2, e3, …, ep} that, when removed from the network, breaks the network to separate it into
unconnected clusters. These separated components indicate the clustering scheme of the network.
We define a dual layer representation of the chromosomes for representing the solution space (Figure 2). In contrast to the traditional approach of using cluster assignment numbers as previously shown in Figure 1, this representation serves to identify
phenotypically unique individuals after breeding. With this representation technique we
never introduce any redundant chromosomes into the population as is possible by conventional approaches (see Figure 1). Having the scheme independent of vertices maintains the uniqueness of the individual representing the solution. We also avoid some unwanted solutions where nodes are clustered into the same community, but these nodes
might not share any connections or edges among them.
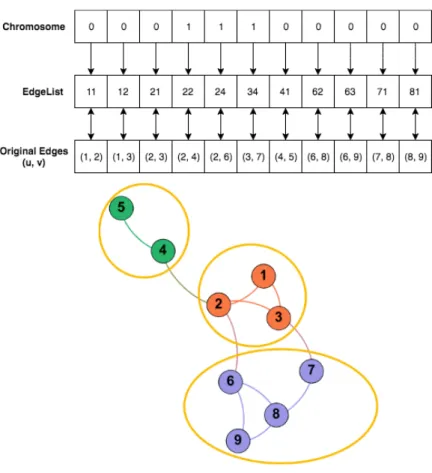
Figure 2. A dual-layer representation of an example chromosome translated to clustering scheme.
Each chromosome is a bit string with a sequence of 0’s and 1’s. Figure 2 shows an example graph with 11 edges and 9 vertices. The length of each chromosome is equal to the number of edges in the network determined using Breadth First Search. Let the chromosome c: {b1b2b3…bE}, where 𝑏+ = 0 denotes the edge is present in the clustering
scheme and 𝑏+ = 1 denotes that the corresponding edge is removed. That is to say that
the removed edges are used to physically separate the clusters in the current clustering scheme. The edges are mapped from chromosomes to edges using EdgeList, where
example chromosome mapped to the edges using the EdgeList for the shown clustering scheme.
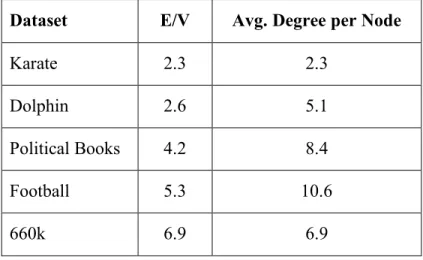
In addition to removing redundancies in the search space, this chromosomal representation typically requires less memory than the conventional approach. Here we need one bit for each edge in 𝐸 for each chromosome, whereas the conventional representation requires one integer for each vertex in 𝑉. If an integer requires 64 bits of memory, networks with E/V less than 64 would consume less memory for our approach. The highest E/V value for our presented datasets is 6.94 (for the Alzheimer’s Disease 660k network). Table 2 shows the density (E/V) and average degree for all the datasets.
Table 2. Density and Average degree per nodes.
Dataset E/V Avg. Degree per Node
Karate 2.3 2.3 Dolphin 2.6 5.1 Political Books 4.2 8.4 Football 5.3 10.6 660k 6.9 6.9 Initialization
GA is initialized by randomly generating bit strings (chromosomes) of size equal to the number of edges in the network. The Random Population Rate (Prate) is the probability
chromosome. Number of such chromosomes generated is equal to the Population Size (Psize).
Elitism
Elitism refers to retaining the best individuals from the previous generation to the next unaltered. These ‘elite’ individuals are also included in the selection phase and may undergo mutations and crossovers. This strategy guarantees that the solution quality of the fittest individuals doesn’t decrease from one generation to the next, while facilitating evolution and diversity of the remainder of the population. The rate of elitism is controlled by a parameter defined as Elitism Rate (Erate). The number of such individuals
is equal to Erate * Psize. This strategy works similarly to a beam search technique where all
of the solutions chase the best solutions to improve their fitness.
Selection
Selection is used for choosing those chromosomes who will participate in the crossover and mutation breeding phases. We use a tournament-based selection operator that runs Psize/2 tournaments for each generation. For each tournament, TPool chromosomes are
randomly selected and put into the Tournament Pool. Each of the chromosomes in TPool is
evaluated for the fitness function value and the two best individuals move to Crossover phase. This process is repeated for each TPool, yielding Psize/2 pairs of chromosomes for
Uniform Crossover
Crossover operation in GA results with the exchange of genetic information between two chromosomes. As mentioned in the above section, each Tournament Selection generates two chromosomes. Because nodes in clusters are not linearly ordered, we arbitrarily generate a list of crossover points and single genes are exchanged only at these points. This approach breaks the linearity of traditional crossover and facilitates exploration of remote regions of the search space, thereby improving upon previous GA implementations for network detection. Figure 4 shows the difference between traditional crossover versus uniform crossover.
Figure 4. An example showing the Traditional Crossover against the Uniform Crossover.
Mutation
The mutation operator increases the diversity of the population and helps explore the solution space. Like Crossover, this operator holds potential to generate or destroy high
rankings of individuals on the fitness landscape. We regulate the amount of mutations we invoke to control this behavior.
After performing crossover, for every crossover offspring we randomly mutate some bits at multiple positions. A mutation flips the bit, resulting in adding or removing the corresponding edge in the network mapped by EdgeList. Mutation rate Mrate is set to 0.1,
indicating the expected percentage of bits mutated in the chromosome. Each bit in the chromosome gets Mrate percentage of chance to undergo mutation.
Gene Repair
The evolutionary processes presented cut off edges regardless of the density of the adjacent nodes. We observed in our initial trials that this resulted into some networks still being connected in a single cluster, despite the removal of a high percentage of edges during initialization. In particular, high-degree nodes could end up in clusters that did not include many of their immediate neighbors. To help alleviate this behavior, we developed a novel genetic operator, which we refer to as Gene Repair.
After the mutation phase, the Gene Repair operator may ‘repair’ some chromosomes by strategically adding some previously removed edges. The basic idea is to replace some edges that are adjacent to high-degree nodes as it might be expected that a high-degree node has substantially more intra-cluster than inter-cluster edges. We use a parameter called Gene Repair Size (GRSize) which equals GRrate * |E|. This repair size provides the
highest degree are placed in a list at the start of the search. We used Quicksort algorithm to construct this list. Gene Repair chance (GRchance) controls the rate at which the edges
are inserted back into the network. We set GRchance to 0.05 in these experiments. For each
high-degree node in the list, adjacent edges that have been removed have a GRchance
chance of being replaced. This repair is beneficial for pushing the GA towards keeping high-density nodes in communities where they are connected to multiple intra-cluster nodes. We have observed that this strategy also helps to keep the search from getting into a local minimum and returning suboptimal solutions.
GA Islands
ERBGA uses islands of populations evolving independently (Darrell, Soraya, & Robert B., 1998) which helps in maintaining diversity and exploring more regions of the search space as each population may follow unique trajectories into the search space. We use the best of all islands to benchmark the results. These islands function independently of the runs and generate different initial populations. Since the algorithm could possibly end up generating an initial population of low-fitness chromosomes, this strategy helps to ensure diversity to the global populations. ERBGA uses a varying number of island populations (IslandSize) in the range of 5 through 25. The best run from all the Islands was used for
reporting the results.
Efficiency
Due to the fact that Psize, Gensize, and IslandSize are all constants, the ERBGA algorithm
our algorithm using C++ and, as shown in the Results section, our implementation is computationally efficient. It also scales well for complex networks, requiring relatively low memory space as it uses bits to encode chromosomes. We optimize memory by using a 3-dimensional bit array to represent the chromosomes. Effective size of a G (V, E)
dataset with population size Psize represented in memory would be population size times
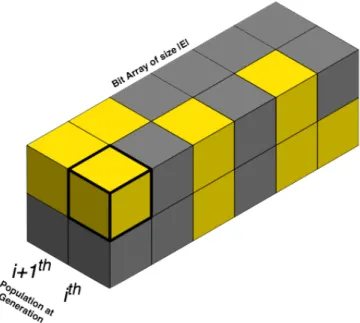
the number of bits required to represent the edges, 𝑃d+ef × (𝐸/8 + ¬¬(𝐸 % 8)) bytes, where ¬ is the logical negation operator, used here to convert a positive integer to 1, while leaving zero at its original value. Figure 3 shows a representation of the 3D cuboid space. Since ERBGA is generational, generations i and i+1 flip after each generation. This leads to the new generation becoming the old generation for the subsequent iteration. On average, the memory size required to hold the population was reduced by 85% for all the datasets.
Figure 3. Representation of 3-D array that hold the bits in memory representing the population at generations i and i+1. In this illustration, a yellow block translates to ‘1’
and grey indicates a ‘0’. If the bit is ‘1’ then the edge is removed, otherwise the edge is untouched. This example represents two chromosomes for a network with six edges. The highlighted yellow block indicates that the first edge (gene) for the first chromosome is removed for generation i. The chromosomes are mapped back to edges using the j’
function. In general, a matrix has height equal to the number of chromosomes, width equal to the number of edges in the network, and depth equal to two.
Fitness Function
ERBGA is flexible for acceptance of any community detection-based objective to evaluate the fitness of chromosomes. Since the data structure used for representation is an adjacency list, it can be easily mapped into matrix-based objective functions. Also, the algorithm doesn’t require prior information about the number of clusters in the network. If a situation arises when a particular number of clusters is desired, this can be accomplished by building the value into the objective function. In the experiments presented here, the Modularity function was optimized.
Summary
ERBGA eliminates redundancy and improves the efficiency of optimization of the given objective function. Its unique chromosomal representation method and 3-dimensional bit array storage container reduces the amount of memory consumed to represent the solution space.
Chapter 5
Results
In this section, we will look into some of the results of the experiments for all the datasets mentioned above. We used Modularity as the fitness function for the results presented here. The experiments were run on an i7 2.1GHz machine running Linux with 8GB of RAM. All of the experiments were run for exactly 48 hours. Using the parameters shown in Table 1, we tested four standard benchmark datasets, namely Zachary’s Karate Club (Zachary, 1997), Dolphin Social Network (Lusseau, et al., 2003), American College Football (Girvan & Newman, 2002), and US Politics Books (Krebs, 2004). We also tested a network, 660k, that has arisen in our research of genetic markers associated with Alzheimer’s Disease. Finally, in order to test the scalability of our approach, we tested a network comprised of email correspondence, namely Enron (Klimt & Yang, 2004).
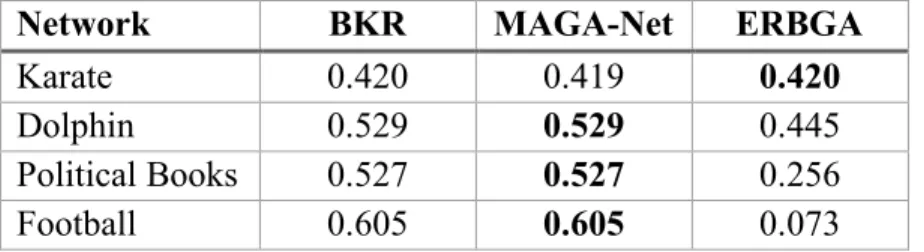
Table 3. The comparison in terms of Modularity (Q) value on all four real world networks.
Network BKR MAGA-Net ERBGA
Karate 0.420 0.419 0.420
Dolphin 0.529 0.529 0.445 Political Books 0.527 0.527 0.256 Football 0.605 0.605 0.073
Accuracy
We compare our results with the fitness reported for the four benchmark instances against MAGA-Net in the paper by Zhangtao Li (Zhangtao & Jing, 2016) and the Best-Known Results (BKR) across multiple diverse Modularity optimization implementations (Agarwal & Kempe, 2008; Noack & Rotta, 2009; Ye, Hu, & Yu, 2008; Medus, Acuna, & Dorso, 2005; Xu, Tsoka, & Papageorgiou, 2007; Lancichinetti, Fortunato, & Radicchi, 2008) as shown in Table 2. ERBGA outperformed MAGA-Net when it identified the best-known solution for the Karate Club. Currently, our approach doesn’t perform well for the Football network and requires further investigations, as discussed below.
Efficiency
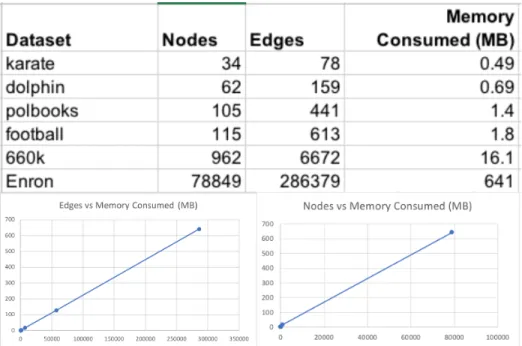
ERBGA computation time and memory usage are shown in Figure 5. We plot two trends to visualize the amount of memory consumed by the runs. As seen in the figure, memory is efficiently allocated as the number of nodes scale. Our implementation can run huge datasets like Enron email network, which consists of 78,849 nodes and 286,379 edges, with less than 1GB of memory.
Figure 5. Memory consumption trends as the nodes and edges scale.
Fitness Landscape
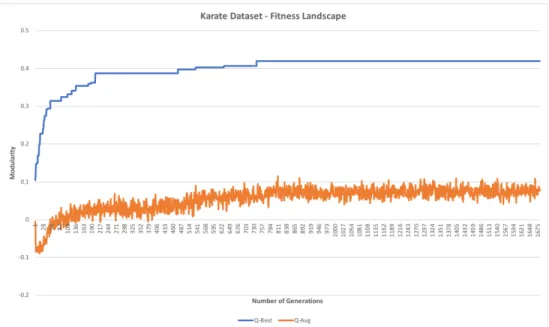
In order to observe the evolutionary changes, Figures 6 – 10 present graphs that plot the Best solution (blue curve) and the Average of whole population (orange curve) for the fitness function for the island population that yielded the highest modularity value.
Figure 6. Modularity evolution for Karate dataset. The dataset converged to the optimal value at generation 749.
For Karate Club, 4 out of 25 islands converged to the optimal value of 0.420. All other islands ended up with modularity values approximately around 0.397. Similarly, Dolphins Network also exhibited rapid evolution until a fitness value of 0.4.
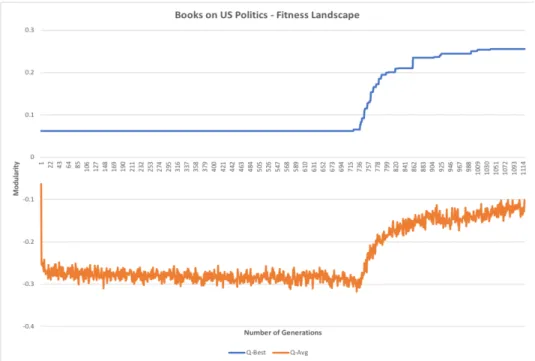
Figure 8. Political Books exhibit a delayed evolution.
Figure 8 illustrates a puzzling evolution scheme that arose for Political Books. We don’t see rapid positive evolution until iteration 736. Since more than half of the computation time didn’t improve the solution, it is possible that this dataset might perform better if more computation time is allocated for the experiment.
Figure 9. Football dataset shows no improvement.
As shown in Figure 9, Football dataset didn’t exhibit any improvement towards the solution. It is possible that it is taking longer to start making evolutionary progress than was observed for Political Books. Future trials with longer computation time will give more insight into this behavior. However, we ran side experiments with values tweaked to assess the sensitivities of these parameters. We observed that tweaking the Random Population Rate to be closer to 1 resulted in the improvement in the quality of the initial set of chromosomes.
Figure 10. 660k dataset performs average for the set parameters.
660k is a dataset with fairly larger number of nodes and edges. As shown in Figure 10, the evolutionary trend looks similar to the results for Karate club and Dolphin networks. Although this dataset has not been previously evaluated using other methods, the evolutionary trend suggests the ERBGA results are promising.
Summary
As observed in the results for our trials, Karate did excellent and Dolphin performed well with the existing configuration of ERBGA and 48-hour time limit. With the exception of Football, the other datasets are seen to be evolving although they appear to manifest mixed behavior. On carefully observing Political Books we could hypothesize that the algorithm struggles to find the evolution point.
Chapter 6
______________________________________________________________________________
Conclusion
A key issue for the use of GAs for community detection is a meaningful chromosomal representation that properly captures phenotypic characteristics in an efficient manner. Previous efforts have resulted in the search space being expanded by an order of K!, where K is the number of communities. Here we introduce a novel representation that uses the removal of edges to define each possible clustering configuration exactly once in the search space. One drawback of our current implementation is that dense networks may have many edges removed yet remain connected, thus representing a single cluster. This behavior was observed in our initial trials for the US Politics Books, Football, 660k, and Enron datasets. These results suggested development of a strategy to increase contextual removal of edges rather than removing them randomly. We developed a novel operator to improve performance by considering the degree of vertices that are adjacent to a candidate edge. If the edge is currently set to be removed and it is incident to a vertex with high degree, the edge might be replaced back into the network. This strategy was introduced in this thesis as the Gene Repair operator which helps to break up large dense networks into distinct clusters by repairing potentially deleterious variants.
The Gene Repair operator mimics a prevalent biological process. Cells in living organisms are endowed with a host of mechanisms to identify and correct mutations and
chromosomal damage that may arise due to environmental factors, such as radiation and normal metabolic activities, as well as errors during DNA replication. These types of changes occur frequently, and in some cases they may potentially lead to higher fitness. However, if such lesions are lethal for the cell and are not properly repaired, cells may undergo an organized cell death. Furthermore, failures of such mechanisms lie at the heart of the initiation of potentially cancerous cells. Fortunately, cells are empowered with a multitude of DNA repair mechanisms that efficiently avert these potentially fatal outcomes. Our Gene Repair operator attempts to improve fitness by repairing 1’s representing removed edges adjacent to high-degree nodes and returning them back into the network.
Another issue for community detection using GAs is the enforcement of linearity for the chromosomes during crossover operations. ERBGA breaks up the linearity by randomly selecting genes.
A broad issue for community detection is the selection of a meaningful objective function. The choice is dependent upon the characteristics of the particular network of interest. In some domains sphericity is suitable, while other domains, such as genetic associations with complex diseases, such a bias could be highly problematic. ERBGA flexibly allows any arbitrary objective, providing a convenient tool for comparing alternative functions.
Future Work
With the inherent qualities of ERBGA of reducing search space as well as efficient memory management, future work should focus on improving methods in order to mitigate the slow start for productive evolution, as observed for two of the benchmark datasets.
In addition to the new Gene Repair operator, another potential approach for improving the breakup of the network into clusters could be realized by implementing a method to prioritize removal of edges instead of random deletion. Also, we are unsure whether completely randomized Initialization of chromosomes is desirable for this domain. Some bias could be introduced into the generation of initial population which strategically improves early network breakup while retaining diversity.
Another opportunity for improvement might be in the selection phase. The elite chromosomes could be given increased probabilities to be selected as a parent for breeding phase, perhaps by employing both Tournament Selection and Roulette Selection. This could potentially improve the algorithm to break out of a minima wall and start evolving earlier. However, such adjustments might decrease diversity.
Finally, using more islands would likely increase performance; and added functionality to exchange chromosomes across islands after a predefined number of generations may help the islands evolve faster. It should be noted that these trials can be run in parallel and it may be possible to compute large numbers of populations, given an adequate number of
processors. Overall, ERBGA is an efficient approach which addresses key biases introduced by previous methods and holds potential for future research development.
References
1. Agarwal, G., & Kempe, D. (2008). Modularity-maximizing graph communities via mathematical programming. Eur. Phys. J. B 66 (3), 409–418.
2. B, L., & T., S. (2009). Protein –protein interaction databases: Keeping up with growing interactomes. HUMAN GENOMICS, 291–297.
3. B., G., Y., D. M., & A., C. (2010). Performance of modularity maximization in practical contexts. Physical Review E, vol. 81, no. 4, p. 046106.
4. Berend Snel, P. B. (2002). The identification of functional modules from the genomic association of genes . Proceedings of the National Academy of Sciences
(pp. 5890-5895). PNAS.
5. Climer, S., Templeton, A., & Zhang., W. (2014). Allele-Specific Network Reveals Combinatorial Interaction That Transcends Small Effects in Psoriasis GWAS. PLoS Computational Biology, 10 (9)(doi:10.1371/journal.pcbi.1003766.). 6. Climer, S., Yang, W., de Las Fuentes, L., Dávila-Román, V. G., & Gu, C. C. (2014). A custom correlation coefficient (CCC) approach for fast identification of multi-SNP association patterns in genome-wide SNPs data. Genet. Epidemiol. 38, 610–621.
7. Darrell, W., Soraya, R., & Robert B., H. (1998). The Island Model Genetic Algorithm: On Separability, Population Size and Convergence . Journal of
Computing and Information Technology, 33-47.
8. Eichler, E, E., Flint, J., Gibson, G., Augustine, K., Suzanne M, L., . . . Joseph H, N. (2010). Missing Heritability and Strategies for Finding the Underlying Causes
of Complex Disease. Nature Reviews. Genetics 11 (6).
9. Fortunato, S., & Barthélemy, M. (2007). Resolution limit in community detection.
Proc. Natl. Acad. Sci. U. S. A., 104, 36–41.
10.Girvan, M., & Newman, M. E. (2002). Community structure in social and biological networks. Proc. Natl. Acad. Sci. USA, 7821-7826.
11.Gong, M., Fu, B., Jiao, L., & Du, H. (2011). Memetic algorithm for community detection in networks. Phys Rev E Stat Nonlin Soft Matter Phys., 84(5 Pt 2):056101.
12.Himsolt, M. (2018). Gml: A portable graph file format.
13.Human Genetic Variation [Internet]. (2007). National Human Genome Research
Institute, http://www.sciencemag.org/content/318/5858/1842.short.
14.Jain, A. K. (2010). Data clustering: 50 years beyond K-means. Pattern
Recognition Letters 31.
15.Jelili, O., Itunuoluwa, I., Funke, O., Olufemi, A., Efosa, U., Faridah, A., . . . Ezekiel, A. (2016). Clustering Algorithms: Their Application to Gene Expression Data. Bioinformatics and Biology Insights.
16.Klimt, B., & Yang, Y. (2004). The enron corpus: a new dataset for email classification research. ECML'04 Proceedings of the 15th European Conference
on Machine Learning, (pp. 217-226). Pisa, Italy.
17.Krebs, V. (2004). Books about us politics. Retrieved from http://www.orgnet.com 18.Krishnan VG, W. D. (2003). A comparative study of machine-learning methods
to predict the effects of single nucleotide polymorphisms on protein function.
19.Lancichinetti, A., Fortunato, S., & Radicchi, F. (2008). Benchmark graphs for testing community detection algorithms. Phys. Rev. E 78 (4).
20.Lizotte-Waniewski, M., Taw, W., Guiliano, D., Lu, W., Liu, J., Williams, S., & Lustigman, S. (2000). Identification of potential vaccine and drug target candidates by expressed sequence tag analysis and immunoscreening of Onchocerca volvulus larval cDNA libraries. Infect Immun. Jun;68(6):3491-501. 21.Lloyd, S. P. (1982). Least squares quantization in PCM. IEEE Transactions on
Information Theory, 28 (2) 129–137.
22.Lusseau, D., Schneider, K., Boisseau, O., Haase, P., Slooten, E., & Dawson, S. (2003). The bottlenose dolphin community of doubtful sound features a large proportion of long-lasting associations. Behav. Ecol. Sociobiol, 396–405.
23.Martin G., G. (2005). Global prperties of biological networks. Drug Discovery
Today, 365-372.
24.Martin, E., Hans-Peter, K., Jörg, S., & Xiaowei, X. (1996). A density-based algorithm for discovering clusters in large spatial databases with noise. Published in Proceedings of 2nd International Conference on Knowledge Discovery and
Data Mining, 226-231.
25.Medus, A., Acuna, G., & Dorso, C. (2005). Detection of community structures in networks via global optimization. Phys. A 358 (2), 593–604.
26.Newman, M. E. (2006). Modularity and community structure in networks. Proc.
Natl. Acad. Sci. U. S. A., 103, 8577–82 .
27.Newman, M., & Girvan, M. (2004). Finding and evaluating community structure in networks. Phys. Rev. E 69, 26113.
28.Noack, A., & Rotta, R. (2009). Multi-level algorithms for modularity clustering.
Experimental Algorithms Springer, 257–268.
29.Pirim, H., Ekşioğlu, B., Perkins, A., & Yüceer, Ç. (2012). Clustering of High Throughput Gene Expression Data. Computers & Operations Research, 3046– 3061.
30.Purcell, Shaun, Neale, B., Toddbrown, K., Lori, T., Ferreira, M. A., . . . Maller, J. (2007). PLINK: A Tool Set for Whole-Genome Association and Population-Based Linkage Analyses. The American Journal of Human Genetics 81 (3). 31.Shang, R., Bai, J., Jiao, L., & Jin, C. (2013). Community detection based on
modularity and an improved genetic algorithm. Physica A: Statistical Mechanics
and its Applications, 392. 1215–1231. 10.1016/j.physa.2012.11.003.
32.Snel, B. e. (2002). The identification of functional modules from the genomic association of genes. Proc. Natl. Acad. Sci. U. S. A. 99, 5890–5895.
33.Tasgin, M., Herdagdelen, A., & Bingol, H. (2007). Community detection in complex networks using genetic algorithms. ArXiv preprint, arXiv:0711.0491. 34.Vavak, F., & Fogarty, T. C. (1996). Comparison of steady state and generational
genetic algorithms for use in nonstationary environments. Proceedings of IEEE
International Conference on Evolutionary Computation (pp. 192-195). Nagoya:
IEEE.
35.Wang, J., Zuo, Y., Man, Y., Avital, I., Stojadinovic, A., Liu, M., & Ressom, H. W. (2015). Pathway and Network Approaches for Identification of Cancer Signature Markers from Omics Data. Journal of Cancer, 6(1), 54–65.
complex networks using mixed integer optimisation. Eur. Phys. J. B 60 (2), 231– 239.
37.Ye, Z., Hu, S., & Yu, J. (2008). Adaptive clustering algorithm for community detection in complex networks. Phys. Rev. E 78 (4).
38.Zachary, W. W. (1997). An information flow model for conflict and fission in small groups. Journal of Anthropological Research, 452-473.
39.Zhangtao, L., & Jing, L. (2016). A multi-agent genetic algorithm for community detection in complex networks. Physica A 449, 336–347.
40.Zuk, Or, Eliana, H., Shamil R, S., & Eric S, L. (2012). The Mystery of Missing Heritability: Genetic Interactions Create Phantom Heritability. Proceedings of the