H
ERIOT
-W
ATT
U
NIVERSITY
D
OCTORAL
T
HESIS
Child Human Capital in
Developing Countries
Wei Fan
Submitted for the degree of Doctor of Philosophy
School of Social Sciences
Department of Accounting, Economics and Finance
December 20, 2019
“The copyright in this thesis is owned by the author. Any quotation from the thesis or use of any of the information contained in it must acknowledge this thesis as the source of the quotation or information.”
Abstract
This thesis contributes to three current topics in child human capital devel-opment in the developing world. First, we examine the role that child ability plays in parental investment decisions in Ethiopia. Second, using a different dataset, we investigate whether women’s empowerment could improve child nutritional status in Ethiopia. Third, we study the effect of sanitation on child cognitive ability in India, and explore heterogeneous effects by child endow-ments.
In Chapter 2, we present a paper which exploits the longitudinal Young Lives data survey in Ethiopia to evaluate the causal effect of child cognitive skill on parental educational investment within the family. The study uses instrument variables combined with sibling fixed-effects to tackle the endo-geneity in child ability and parental investment. We find that parents compen-sate the low-ability child among their primary school-age offspring through increased educational fees. We also find that this effect mainly holds for the high socioeconomic households.
Chapter 3 investigates the association between maternal autonomy and child nutritional status among children aged 0-59 months in Ethiopia. Using the nationally representative Demographic and Health Survey data and an in-novative empirical methodology - ‘post-double-selection Lasso’ (PDS-LASSO) - which helps to avoid dubious variable selection and to deal with omitted variable bias, we provide evidence that a child is less likely to be underweight if his/her mother has high autonomy. Notably, this correlation is strongest for children who are older than two years old.
The last paper, shown in Chapter 4, explores the impact of shocks and pol-icy during the fetal and infancy periods, along with their interaction, on later
cognitive performance in rural India. Specifically, it studies the separate ef-fect of in-utero rainfall fluctuations and a sanitation campaign at birth. It fur-ther discusses whefur-ther the effect of the sanitation campaign is differential by child endowments induced by previous rainfall shock. Using a difference-in-differences design, we do not find that the return to the sanitation programme is higher for advantaged children, as evidence shows that children who were exposed to positive rainfall in utero achieve similar scores at the age of 8-11 through the improved sanitary environment at birth.
Acknowledgements
First and foremost, I am most grateful to have Cath as my first supervisor. I am fortunate to have her company along the journey of my PhD. She has been the light in my research process, academically and personally. She offers me structural solutions when I face obstacles in research and motivates me by her good African cooking in the ‘lovely’ Scottish weather. Apart from her instrumental help in my thesis, she generously offers lots of opportunities in work, presentations, and internship, which turn out to be significant assets for my career. Her care and support for colleagues also inspire me a lot. I also like to thank Philippe, my second supervisor, for being patient, supportive and encouraging in my career.
Thanks to the lecturers, such as Mark, Andrea, Atanas, Shumei, and Arnab in the department for attending my presentations and giving valuable advice. Thanks to my economics PhD cohorts and all those who joined the 12pm lunch and played in our football team: Rong, Jan, Antonio, Fran, John, Ryuta, Achim, Yeshwas, Sering and Romi. It is a great pleasure to study and work with you. Thanks to the PhD office mates in the Department of Accounting, Finance and Economics: Nana, Antonio, and Dara. I am appreciative of Vincenzo and the rest of the team in SPESI, UNICEF Ethiopia for welcoming me with the warmest heart and working with me.
Thanks to my family in Buccleuch Free Church. Their love and friend-ship have been the most supportive solid rock for my life in Edinburgh. Spe-cial thanks to my dear friends Shen, Yuanyuan, Moji, Cia, Moira, Eric, Anne, Willie, Daniel, Marion, Joan, Donald, James, Vickie, Heather, Bob, Neil, Mary, Roddy, Christine, Ena, William, Loren, the Blackford Hill home group, and the EDGE teens group. My European friends and friends back in China have been
my most excellent support and laughter boosters. Thanks to Yanni, Sarah, Ap-ple, Shiyao, Karen, Jerry, Mara, Marilou, Zhihai, Kara, Class Two in Beijiang Middle School, and 101.5 Dorm at GDUFS.
Last but not least, I would like to express my gratitude to my parents, grandparents, uncles, aunts and cousins in China for their unconditional love and support when I am far away from them in the past five years. I want to express my special gratitude to my mom, who has been a great inspiration and role model in achieving excellent performance in education and career as a fe-male. Thank you for all the efforts you have put in me and supported me in so many ways. Thank you for encouraging me to pursue what I want when I lack confidence.
Joint Work Declaration
Chapter 2 is a joint paper with Dr. Catherine
Porter, with my contribution on developing
its idea, data cleaning, estimation method,
results generation, and writing.
This paper has been accepted by the Journal
of Population Economics.
Page 1 of 1
RDC Clerk/Apr 2019
Research Thesis Submission
Name: Wei Fan
School: School of Social Science Version: (i.e. First,
Resubmission, Final)
Final Degree Sought: Doctor of Philosophy, Economics
Declaration
In accordance with the appropriate regulations I hereby submit my thesis and I declare that: 1. The thesis embodies the results of my own work and has been composed by myself 2. Where appropriate, I have made acknowledgement of the work of others
3. The thesis is the correct version for submission and is the same version as any electronic versions submitted*. 4. My thesis for the award referred to, deposited in the Heriot-Watt University Library, should be made available for loan or photocopying and be available via the Institutional Repository, subject to such conditions as the Librarian may require
5. I understand that as a student of the University I am required to abide by the Regulations of the University and to conform to its discipline.
6. I confirm that the thesis has been verified against plagiarism via an approved plagiarism detection application e.g. Turnitin.
ONLY for submissions including published works
7. Where the thesis contains published outputs under Regulation 6 (9.1.2) or Regulation 43 (9) these are accompanied by a critical review which accurately describes my contribution to the research and, for multi-author outputs, a signed declaration indicating the contribution of each author (complete)
8. Inclusion of published outputs under Regulation 6 (9.1.2) or Regulation 43 (9) shall not constitute plagiarism.
* Please note that it is the responsibility of the candidate to ensure that the correct version of the thesis is submitted.
Signature of Candidate:
Date:
Submission
Submitted By (name in capitals):
Signature of Individual Submitting: Date Submitted:
For Completion in the Student Service Centre (SSC)
Limited Access Requested Yes No Approved Yes No
E-thesis Submitted (mandatory for final theses)
Received in the SSC by (name in capitals): Date:
Page 1 of 1
RDC Clerk/Apr 2019
Inclusion of Published Works Declaration
This thesis contains one or more multi-author published works. In accordance with Regulation 6 (9.1.2) I hereby declare that the contributions of each author to these publications is as follows:
Citation details Fan, W. & Porter, C., ‘Reinforcement or Compensation? Parental Responses to Children’s Revealed Human Capital Levels’, Journal of Population Economics, September 2019; working paper 183, Young Lives, 2018 Author 1 Wei Fan has contributed to this paper in developing its idea, data cleaning,
estimation method, results generation, and writing.
Author 2 Dr Catherine Porter has contributed to this paper in writing and situating it in the literature.
Signature: Date:
Contents
1 Introduction 1
Bibliography . . . 4
2 Reinforcement or compensation? Heterogeneous parental responses to children’s revealed human capital levels in Ethiopia 5 2.1 Introduction . . . 7
2.2 Literature review . . . 9
2.3 Data and measures . . . 15
2.3.1 Rainfall . . . 16
2.3.2 PPVT scores as a measure of cognitive ability . . . 18
2.3.3 Total educational fees as a measure of cognitive resources 19 2.3.4 Socio-economic status (SES) . . . 23
2.4 Econometric strategy . . . 25
2.5 Results . . . 28
2.5.1 Preliminary results . . . 29
2.5.2 Main results . . . 31
2.5.2.1 IV-FE models: First-stage results and diagnostics 31 2.5.2.2 IV-FE models: Second-stage results . . . 34
2.5.3 Heterogeneity of parental responses to children’s early ability . . . 39
2.5.4 Robustness checks . . . 42
Bibliography . . . 48
Appendix . . . 55
3 Is maternal autonomy a potential pathway to child nutritional status? Evidence from Ethiopia 2005-2016 62 3.1 Introduction . . . 64
3.2 Literature review . . . 67
3.2.1 Definition and measurement of women’s autonomy . . . 67
3.2.2 The relationship between women’s autonomy and child’s nutrition . . . 70
3.3 Data . . . 73
3.3.1 Maternal autonomy: main explanatory variable . . . 74
3.3.1.1 Construction of latent autonomy variables: us-ing Bayesian analysis based on a CFA model . 75 3.3.2 Child nutritional status: outcome measures . . . 81
3.3.3 Control variables . . . 82 3.4 Econometric model . . . 85 3.5 Results . . . 89 3.5.1 Preliminary results . . . 89 3.5.2 Main results . . . 92 3.5.3 Heterogeneous results . . . 97 3.5.4 Robustness checks . . . 100 3.6 Conclusion . . . 101 Bibliography . . . 104 Appendix . . . 112
4 Do early life shocks constrain returns to human capital investment? Evidence from a large-scale sanitation programme in India 124 4.1 Introduction . . . 126
4.2 Literature review . . . 130 4.3 Theoretical framework . . . 137 4.4 Data . . . 139 4.4.1 The TSC programme . . . 139 4.4.1.1 Description of programme . . . 139 4.4.2 TSC data . . . 140 4.4.2.1 TSC intensity variable . . . 141 4.4.3 Rainfall data . . . 142
4.4.3.1 Rainfall shock variable . . . 142
4.4.4 IHDS survey data . . . 145
4.4.4.1 Dependent variables . . . 146
4.4.4.2 Control variables . . . 147
4.4.5 Sample . . . 147
4.5 Empirical strategy . . . 150
4.6 Results . . . 153
4.6.1 Effects of rainfall on test outcomes . . . 153
4.6.2 Effects of TSC on test outcomes . . . 156
4.6.3 Effects of rainfall and TSC on test outcomes . . . 159
4.6.4 Robustness checks . . . 164
4.6.4.1 Parallel trends in test outcomes in older chil-dren . . . 164
4.6.4.2 Balance of covariates . . . 166
4.7 Conclusion . . . 167
Bibliography . . . 169
List of Tables
2.1 Summary statistics . . . 24 2.2 Preliminary regression models . . . 30 2.3 First stage regressions: Results and tests of underidentification
and weak identification . . . 32 2.4 IV-FE regression models of cognitive ability and total
educa-tional fees . . . 35 2.5 IV-FE model of the effects of cognitive ability on total
educa-tional fees: potential heterogeneity effect by SES . . . 40 2.6 Robustness regression models . . . 44 A1 Full list of coefficients from Table 4 . . . 56 A2 Robustness check: First stage results adding sibling rainfall in
infancy using community fixed-effects model . . . 57 A3 Redundancy tests: Cognitive ability and cognitive resources . . 58 A4 Robustness check: First stage results using restricted sample . . 59 A5 IV-FE results: HAZ as the interest variable . . . 60 3.1 Percent of mothers answering autonomy questions in the
sam-ple . . . 76 3.2 Sample statistics for estimated factor scores using the Bayesian
CFA model . . . 81 3.3 Descriptive statistics for key variables . . . 84 3.4 FE regression models: preliminary results . . . 91
3.5 PDS-LASSO regression models: main results . . . 94
3.6 PDS-LASSO regression models: heterogeneous results . . . 98
C1 Child and parental characteristics . . . 113
C2 Household characteristics . . . 114
C3 PDS-LASSO regression models: variables selected for regres-sions with dependent variables of being underweight and WAZ 115 C4 PDS-LASSO regression models: variables selected for regres-sions with dependent variables of being stunted and HAZ . . . 116
C5 Mechanism: heterogeneous effect . . . 117
C6 PDS-LASSO regression models: without unpenalised variables 118 C7 PDS-LASSO regression models: heterogeneous results using re-stricted sample . . . 119
C8 PDS-LASSO regression models: when women have highest au-tonomy if they make decision jointly with husband . . . 120
C9 PDS-LASSO regression models: restricted sample to women hav-ing only one child under five . . . 121
4.1 Mean of normal rainfall in utero when the cut-off of the defini-tion of normal rainfall varies . . . 144
4.2 Descriptive statistics for key variables . . . 149
4.3 Effects of rainfall on test outcomes . . . 154
4.4 Effects of TSC on test outcomes . . . 157
4.5 Effects of rainfall and TSC on test outcomes . . . 160
4.6 Effects of rainfall and TSC on combined scores . . . 163
4.7 Parallel trends: using cohorts born before TSC’s implementation 165 E1 Effects of rainfall on test outcomes using cohorts born between 1999-2004 . . . 178
E2 Effects of rainfall on test outcomes using rainfall in the first year of life . . . 179 E3 Effects of TSC on test outcomes using TSC measured by varying
population . . . 180 E4 Sanitation-cognition gradient at the age of one and two . . . 181 E5 Balance of covariates: Rainfall shocks, TSC and control variables 182
List of Figures
2.1 Annual rainfall by community, 1998-2008 . . . 17
2.2 IRT PPVT scores by language, 2009 . . . 19
2.3 Young Lives Survey timings . . . 20
2.4 Total educational fees . . . 21
2.5 Mean cognitive resources and cognitive ability for each fifth per-centile of the cognitive ability distribution . . . 22
2.6 Intra-household difference in total educational fees by SES . . . 25
2.7 Kernel density plot of household wealth index by maternal ed-ucation, 2013 . . . 42
B1 Estimatedβby direct effect of instrument . . . 61
3.1 Conventional CFA model of autonomy . . . 79
3.2 Trends in nutritional status of children under age five, EDHS 2005-2016 . . . 82
D1 Conventional CFA model with standardised factor-loadings . . 122
D2 Bayesian CFA model with standardised factor-loadings, allow-ing for cross-loadallow-ings . . . 123
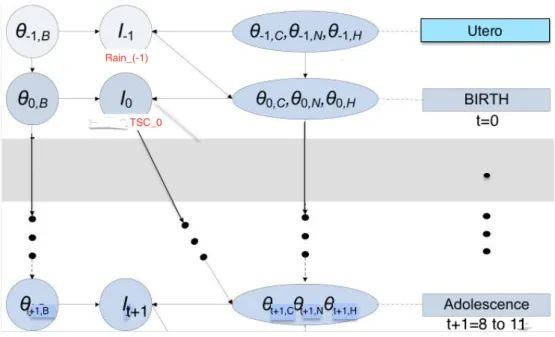
4.1 Diagram of technology of capability formation . . . 138
4.2 Variation in TSC and rainfall between 2001-2004 . . . 150
Chapter 1
Introduction
The three chapters in this thesis, while each one of them serving as a stand-alone paper, examine the life cycle of human capital formation from in utero to adolescence. Three specific aspects of human capital development are investi-gated: whether parents respond to the difference in offspring’s ability; whether an intangible input - maternal empowerment - contributes to child develop-ment; and whether sanitation investments help disadvantaged children catch up.
As noted by Currie and Almond (2011), while most of the “early origins” literature relies on the reduced form estimation, it leaves the question - through which channel, pure biology or responsive investments, the effect is displayed - unanswered. Chapter 2 attempts to answer the question of whether parents compensate or reinforce in the difference in children’s revealed ability. Com-plementing the evidence found in current studies which mainly focus on birth weight as child endowments in the developed context, we look at how parents respond to the revealed difference in primary school-age children’s cognitive skill in Ethiopia.
In order to pin down the causal effect, this paper applies an instrumental variable method combined with a sibling fixed-effects to isolate the exogenous variation in child cognitive achievement within the family. Specifically, we
exploit rainfall fluctuation during child critical developmental period within the household, which induces an exogenous variation in child cognitive ability observed in later childhood. We find that on average parents tend to invest more in a child with low ability and that higher-class parents compensate more in comparison with lower-class ones.
While early childhood development literature has established particular tangible inputs to child human capital production, such as nutritional intake and home environment, Chapter 3 focuses on a potential intangible input to child nutrition, i.e. women’s autonomy. We ask whether a higher level of ma-ternal autonomy is correlated with better child nutrition for children under five in Ethiopia. This paper makes advances to the development literature by adopting a novel methodology, called “post-double-selection Lasso” (Belloni et al., 2014), to deal with variable selection and omitted variable bias, allay-ing concerns about havallay-ing too many control variables in the model or dubious ‘p-hacking’ selection of variables. We also include village-level fixed effects in the model. This paper uses three rounds of national representative Demo-graphic and Health Survey data between 2005-2016, with rich information on women’s autonomy and characteristics of child, parents, and households. We measure mother’s autonomy using a reliable statistical method based on the theory of autonomy, i.e. Bayesian Confirmatory Factor Analysis. The results suggest that a child of a mother with a higher level of autonomy is less likely to be underweight, and this is particularly apparent among children aged 24-59 months.
Lastly, in Chapter 4, we look at how sanitation programme would affect child cognition and whether its effect is differentiated by child endowments. In India, more than half of the population defecate openly, exacerbating the disease environment to which vulnerable infants are exposed. In 2001, a na-tional sanitation campaign called Total Sanitation Campaign was introduced,
aiming to eliminate open defecation, especially in rural areas. Relying on a difference-in-differences method, we discover the positive impact this sanita-tion investment at birth makes on cognitive achievement at the age of 8-11 in rural India.
Furthermore, this paper contributes to learning the dynamic aspect of the technology of skill formation. In Cunha et al. (2006), Cunha and Heckman (2007), and Heckman (2006, 2007)’s dynamic human capital formation theory, the authors promote a key feature of skill formation, i.e. “dynamic comple-mentarity”, which suggests that the productivity of investment can be driven by the level of skills acquired in the previous stage. To supply empirical ev-idence, we need to tackle the econometric challenge in finding an exogenous measurement of skill/endowments to be interacting with the sanitation invest-ment. Recalling the context of India, a rainfed country, we use adverse rainfall in utero as an exogenous source of variation in infant endowments. The results suggest that adverse rainfall in utero reduces child test outcomes at the age of 8-11. However, we do not find complementarity that the high level of endow-ments could raise the return of the sanitation programme. We contribute to the literature in being the first to identify the interaction between sanitation and early endowments and in investigating this effect in the first year of life.
Bibliography
Belloni, Alexandre, Victor Chernozhukov, and Christian Hansen (2014). “Infer-ence on treatment effects after selection among high-dimensional controls”.
The Review of Economic Studies81.2, pp. 608–650.
Cunha, Flavio and James Heckman (2007). “The technology of skill formation”.
American Economic Review97.2, pp. 31–47.
Cunha, Flavio, James J Heckman, Lance Lochner, and Dimitriy V Masterov (2006). “Interpreting the evidence on life cycle skill formation”.Handbook of the Economics of Education1, pp. 697–812.
Currie, Janet and Douglas Almond (2011). “Human capital development be-fore age five”.Handbook of Labor Economics. Vol. 4. Elsevier, pp. 1315–1486. Heckman, James J (2006). “Skill formation and the economics of investing in
disadvantaged children”.Science312.5782, pp. 1900–1902.
— (2007). “The economics, technology, and neuroscience of human capability formation”.Proceedings of the National Academy of Sciences of the United States of America, pp. 13250–13255.
Chapter 2
Reinforcement or compensation?
Heterogeneous parental responses
to children’s revealed human capital
levels in Ethiopia
1
1This is a joint paper with Dr. Catherine Porter, with my contribution on developing the
idea, data cleaning, estimation method, results generation, and writing. This paper has been recently accepted by theJournal of Population Economics. It is also a working paper in Young Lives Working Papers Series.
The data are from Young Lives, a 15-year study of the changing nature of childhood poverty in Ethiopia, India, Peru and Vietnam (www.younglives.org.uk). Young Lives is funded by UK aid from the Department for International Development (DFID). The views expressed here are those of the author(s). They are not necessarily those of Young Lives, the University of Oxford, DFID or other funders. Thanks to three anonymous reviewers, Liang Bai, Amalavoyal Chari, Marta Favara, Kalle Hirvonen, Pascal Jaupart, Tatiana Kornienko, Jessica Leight, Patricia Es-pinoza Revollo, and Mark Schaffer for helpful suggestions, and to seminar and conference participants in Young Lives, Jun 2017; SGPE conference, Jan 2018; CSAE conference, Mar 2018; University of Sussex, Mar 2018; UNICEF Ethiopia, Apr 2018; SEHO conference, May 2018; SMYE, May 2018, and ESPE, June 2018. All errors and omissions are our own.
Abstract
A small but increasing body of literature finds that parents invest in their children unequally. However, the evidence is contradictory, and providing convincing causal evidence of the effect of child ability on parental investment in a low-income context is challenging. This paper examines how parents re-spond to the differing abilities of primary school-age Ethiopian siblings, using rainfall shocks during the critical developmental period between pregnancy and the first three years of a child’s life to isolate exogenous variation in child ability within the household, observed at a later stage than birth. The results show that on average parents attempt to compensate disadvantaged children through increased cognitive investment. The effect is significant, but small in magnitude: parents provide about 3.9% of a standard deviation more in edu-cational fees to the lower-ability child in the observed pair. We provide sug-gestive evidence that families with educated mothers, smaller household size, and higher wealth compensate with greater cognitive resources for a lower-ability child.
Keywords: Children, Human Capital Formation, Parental Investment,
Intra-household Resource Allocation.
2.1
Introduction
A large body of evidence has developed during the past three decades showing thatin uteroand early life conditions have a significant impact on chil-dren’s early life ability, subsequent development and therefore on outcomes in adulthood (surveyed by Currie and Almond (2011) and Almond et al. (2018)). Most of these studies are reduced-form estimates of the total effect of an early life shock or adverse event on final adult health. However, ability in early life impacts on later human capital not only through the biological channel (Heck-man, 2007), but also through the channel of parental involvement - in theory parents can either reinforce or compensate for revealed early ability. It is then an empirical question whether parental actions amplify or mute the ultimate effect of early life shocks and circumstances on adult human capital outcomes. Our paper contributes to this latter research question, which is of direct pol-icy relevance. The current literature comprises a body of empirical evidence that appears somewhat contradictory, containing studies that document both compensatory and reinforcing behaviour of parents. Attempting to clearly identify such effects given the econometric concerns is extremely difficult, and could be one reason for the apparently conflicting results. Alternatively, there may be important differences across country contexts (either cultural or eco-nomic) that are leading to such different conclusions.
Our contribution extends the existing literature in three specific ways. First, we examine the response of parents to differences in child cognitive ability in early childhood in a low-income country, using a measure of ability rather than birth weight or height as a proxy. We are aware of only two previous studies that have analysed parental responses to observed cognitive ability be-yond birth. Frijters et al. (2013) find that parents reinforce cognitive resources in response to differences in cognitive ability in the USA. Ayalew (2005) also
finds reinforcing effects, but these results are based on estimates from only one village in Ethiopia.2
Second, we use both sibling fixed-effects and a plausibly exogenous source instrument (rainfall in early life) for variation in cognitive ability to more con-vincingly identify parental responses, rather than relying on within-twin es-timation, since twins are not the ideal group on which to study such effects (Bhalotra and Clarke, 2018). Other instruments have been utilised in the literature-Frijters et al. (2013) use handedness as an instrument of a child’s ability, the validity of which has been contested (Grätz and Torche, 2016). Leight (2017) uses grain yields as a plausible instrument for differences in ability proxied by height-for-age. There is an extremely careful literature that has analysed whether parents compensate or reinforce specific (plausibly exogenous) poli-cies and events experienced in childhood (Halla and Zweimüller, 2014; Ad-hvaryu and Nyshadham, 2016), which is highly informative, but may only be generalisable to larger policy shocks, whereas our use of variation in rainfall could be seen as ‘normal’ shocks to childhood experienced by children in low-income countries (Maccini and Yang, 2009).
Third, we descriptively examine heterogeneity in parental responses across socio-economic status, in a low-income setting. Such heterogeneity has been examined, but only in country contexts that are more developed than Ethiopia (Cabrera-Hernandez, 2016; Hsin, 2012; Grätz and Torche, 2016; Restrepo, 2016). To preview our results, we find that on average, parents provide more cogni-tive investment to the lower-ability child to reduce intra-household inequality. The compensatory parental responses appear to be concentrated in relatively higher-SES families. Specifically, we find suggestive evidence that families with educated mothers, smaller household size and higher wealth compen-sate through a higher level of cognitive investment when there are differences
in ability, while families with non-educated mothers, larger size and lower wealth exhibit only small and modest compensatory behaviours.
The paper proceeds as follows. In the next section we briefly review the relevant literature, and in subsequent sections then present our data, includ-ing the cognitive ability measures, followed by our econometric approach, our results and robustness checks and a concluding discussion.
2.2
Literature review
There are two competing theories on the direction of parental responses to observed ability in their children, both originating from theoretical models which are by now more than forty years old. Becker and Tomes (1976) pre-dict that parents reinforce differences in child ability by investing more in the high-ability child, under the assumption that marginal return to investment is higher when the ability of the child is higher. In this case, parents’ con-cern is for efficiency more than equity. On the contrary, Behrman et al. (1982) suggest that parents will compensate for ability differences to achieve equal-ity among children when parents’ inequalequal-ity aversion preferences outweigh efficiency concerns.
In response, a burgeoning empirical literature has examined the effect of child endowments on parental responses. However, the results of this liter-ature are mixed, indicating overall that there is either no clear direction of parental response on child endowment, or that the response depends heav-ily on context. Some studies have found evidence of reinforcing parental re-sponses (Aizer and Cunha, 2012; Adhvaryu and Nyshadham, 2016; Behrman et al., 1994; Datar et al., 2010; Frijters et al., 2013; Grätz and Torche, 2016; Hsin, 2012; Rosales-Rueda, 2014); some have found compensating parental responses (Behrman et al., 1982; Bharadwaj et al., 2018; Cabrera-Hernandez,
2016; Del Bono et al., 2012; Frijters et al., 2009; Griliches, 1979; Halla and Zweimüller, 2014; Leight, 2017); some have found mixed responses (Ayalew, 2005; Hsin, 2012; Restrepo, 2016; Yi et al., 2015); some have found no effect at all (Abufhele et al., 2017; Almond and Currie, 2011).
Many of the recent empirical studies have relied heavily on the variation in birth weight to answer the question of parental responses, using a sibling fixed-effects (FE) model (Abufhele et al., 2017; Bharadwaj et al., 2018; Del Bono et al., 2012; Cabrera-Hernandez, 2016; Datar et al., 2010; Hsin, 2012; Re-strepo, 2016; Rosales-Rueda, 2014). However, some studies argue that birth weight might be associated with prenatal endogenous input, and hence, ex-ploit a source of exogenous variation in the endowment at birth. Halla and Zweimüller (2014) study the effect of an exogenous shock on the Austrian 1986 cohort, who experienced a prenatal exposure to radioactive fallout from the Chernobyl accident. The shock decreases the birth weight, live births and Ap-gar score; and increases premature births, and days for maternity leave. They find robust empirical evidence that parents compensate the children for expe-riencing input shocks. Adhvaryu and Nyshadham (2016) exploit variation in a plausible randomin uteroexposure to an iodine supplementation programme in Tanzania, and show that parents choose reinforcing investment in higher-ability children. Using Norwegian administrative data, Nicoletti et al. (2018) find that mothers compensate for low child birth weight by reducing mater-nal labour supply two years after birth. They instrument child birth weight by father’s health endowment at birth, which arguably only brings variation in birth weight of child through genetic transmission without a direct impact on the mother’s postnatal investments when conditioning on parental human capital and prenatal investments.
Meanwhile, other studies tackle this problem by using within-twins differ-ences as a exogenous source of variation in endowment since prenatal parental
investment is impossible to vary (Abufhele et al., 2017; Bharadwaj et al., 2018; Yi et al., 2015; Grätz and Torche, 2016). For example, Abufhele et al. (2017) find that parents are neutral to the difference in birth weight of twins in Chile and support the existing evidence that parents do not invest differentially between twins. Using the same data, Bharadwaj et al. (2018) find similar results that parents do not invest differentially within twins, while, using a sample of par-ents with singleton siblings, compensatory behaviour is found. As Almond and Mazumder (2013) noted, the reason could be that it might be especially costly for parents to implement differential treatment between twins.
Important concerns about using twins as an instrument have been raised. Using individual data in 72 countries, Bhalotra and Clarke (2018) find that the distribution of twins is not random in the population and that indicators of the mother’s health and health-related behaviours and exposures are systemati-cally positively associated with the probability of a twin birth. Certainly, twins are not a large proportion of the population, and may be seen more as a special case.
We build on two recent studies that examine the effect of child endow-ment on parental investendow-ment, and rather than relying on twins data, use instru-mental variables to alleviate concerns of endogeneity bias resulting from both unobserved household heterogeneity and child-specific heterogeneity. Using sibling differences in handedness as an instrument for cognitive ability dif-ferences, Frijters et al. (2013) find reinforcing behaviours of parents who are more likely to allocate more cognitive resources on advantaged child in the USA. Grätz and Torche (2016), however, argue that handedness might vary over time so that it might not be an adequate instrument for child’s early abil-ity. Using the same technique but using variation in grain yields during the early life period of siblings as an instrument for physical health, Leight (2017) shows that Chinese parents invest more cognitive resources in the less-healthy
child (as proxied by height-for-age) in Gansu province.
We combine a sibling-difference approach with instrumental variables, us-ing the quasi-exogenous rainfall shocks occurrus-ing durus-ing the critical develop-mental period of a child as an instrument for differences in child ability be-tween siblings.3 As studies find that rainfall shocks have a substantial impact
on child development in agricultural contexts (see Almond et al. (2018) for a review), we exploit differences between siblings by looking at rainfall shocks fromin uteroduring the first three years of their life4as a source of exogenous
variation in nutritional inputs during the critical development period experi-enced by the siblings.5 Glewwe et al. (2001) note that a suitable instrument to
capture within-sibling differences should be “(i) of sufficient magnitude and persistence to affect a child’s stature; (ii) sufficiently variable across house-holds; and (iii) sufficiently transitory not to affect the sibling’s stature”(p.350). We provide robustness checks in this paper to argue that rainfall shock timing does indeed provide a plausible source of exogenous variation.
To our knowledge there are two other studies examining the pattern of parental investment in the context of Ethiopia. Ayalew (2005) examines catch-up growth of children in the dimensions of health and cognitive ability, using the first three rounds of the Ethiopia Rural Household Survey from 1994-95. He finds compensating behaviour in health, but reinforcing behaviour in cog-nitive skills. Arguably, the results for cogcog-nitive skills are less persuasive, since they use information on only one village in the survey.6 Second, using the
Young Lives Older Cohort data and relying on ordinary least squares (OLS)
3Rainfall information is external data matched with location by the Young Lives survey
since the residence of interviewees is confidential.
4The period during pregnancy and the first 1000 days of life is widely recognised as the
critical developmental period of child development (Doyle et al., 2009; Victora et al., 2010).
5Hill and Porter (2017) find that droughts cause a reduction in consumption of households
in both rural and urban areas in Ethiopia.
6The outcome measure used is Ravens’s Progressive Matrices scores, which did not work
successfully in the Ethiopian context during Young Lives (Cueto and Leon, 2012) as children were unable to understand the task.
and fixed-effects (FE) estimations for identification, Dendir (2014) finds rein-forcing behaviours, proxying parental investment with enrolment and child time allocation, and measuring ability using raw Peabody Picture Vocabulary Test (PPVT) scores7. Although the fixed-effects estimation successfully deals
with the endogeneity issue caused by unobserved household characteristics, there is a potential high degree of correlation between child ability and un-observed child heterogeneity, such as parental preferences over one particular child, which is an individual effect. Dendir (2014) measured PPVT scores at adolescence (age 12 and 15), which increases the probability that this mea-sure of ability is contaminated by unobserved child characteristics and con-sequently biases the results, and therefore exogenous variation in cognitive ability is necessary for more plausible estimation.
While most of the existing literature reveals how parents respond to the difference in health within siblings, to the best of our knowledge, only the two studies discussed above (Ayalew, 2005; Frijters et al., 2013) have examined dif-ferences in cognitive ability, and both have limitations. As it is of interest to show the specific parental response to one dimension of human capital, one would ideally like to disentangle the effect of investment in that particular dimension of human capital. However, constrained by data, only a few em-pirical studies have specific measures of investment in different dimensions, while most of the existing studies use a general measure of parental invest-ment, such as time spent with the child. Yi et al. (2015)’s theory predicts that given the same early health shock, parents respond differently along different dimensions of human capital. The data they use contain detailed information on investment in family health and education. Yi et al. (2015) find mixed re-sults: while parents compensate for the harmful effect of an early health shock by devoting more health resources to the worse-health child, they reinforce
in the domain of cognition by allocating fewer educational resources to the disadvantaged child. Restrepo (2016) and Rosales-Rueda (2014) use the same dataset from the USA, the National Longitudinal Survey of Youth-Children 1979 (NLSY-C79), which gives information on inputs of time and goods in ei-ther cognitive or socio-emotional development. They suggest that parents tend to simultaneously reinforce the effect of low birth weight by providing less cognitive stimulation and emotional support to the low-birth-weight child. In our study, we measure direct cognitive investment using total expenditure on educational fees at the individual child level.
Most existing research attempts to examine parental responses to child en-dowments on average. Some sociological studies emphasise that in theory, socio-economic heterogeneity should be taken into account, specifically, the degree and direction of parental responses might vary by family socio-economic status (SES) (Lareau, 2011; Lynch and Brooks, 2013). Some consider that lower-class parents have difficulty in affording costly and risky investment in disad-vantaged children, and would be more likely to reinforce differences in ability. Higher-class parents tend to be averse to inequity so may compensate for a low ability outcome (Conley, 2008). On the contrary, others suggest that high-SES families may reinforce gaps in child ability by providing more educational in-vestment to the advantaged child, while offering direct transfers, such as gifts or bequests, to the disadvantaged child (Becker and Tomes, 1976; Becker, 1991). To date, only a small number of empirical studies have looked at variation in parental responses by SES, though these are all in a developed country con-text. Grätz and Torche (2016) find out that advantaged parents allocate more cognitive stimulation to higher-ability children, while disadvantaged parents behave indifferently to ability gaps. Yet, Halla and Zweimüller (2014) show
that families with low socio-economic status chose to give birth to fewer chil-dren when their chilchil-dren experienced the Chernobyl accident; similarly, fami-lies with high socio-economic status compensate their low-endowed children by supplying less maternal labour (and investing more in childcare). Hsin (2012) uses maternal educational level to measure family socio-economic sta-tus. On average, no compensating or reinforcing investment is found for low birth weight outcomes. However, low-educated mothers prefer reinforcing in-vestment by spending more time with heavier-birth-weight children at 6 years old, while high-educated mothers compensate low-birth-weight children by spending more time with them. Restrepo (2016) finds reinforcing behaviour on average, with low-SES families reinforcing the differences in birth weight with a greater amount of investment compared to high-SES families. None of these studies provide evidence in the context of developing countries, except Cabrera-Hernandez (2016) who finds that high-educated mothers in Mexico compensate for the low-birth-weight outcome by offering more school expen-diture to the disadvantaged child.
2.3
Data and measures
Young Lives is an international longitudinal study of 12,000 children grow-ing up in four developgrow-ing countries (Ethiopia, India, Peru and Vietnam) over 15 years (Barnett et al., 2012), examining the causes and consequences of child-hood poverty. The main cohort (2,000 children in each country) were born within 12 months of each other in 2001. An older cohort (1,000 children in each country) born seven years earlier is used as a comparison group. This pa-per uses data from four rounds of the Ethiopia survey, focusing on the Younger Cohort (YC) and their siblings. Round 1 was conducted in 2002 (when YC in-dex children were, on average, 1 year old), Round 2 in 2006 (approximately age
5), Round 3 in 2009 (approximately age 8) and Round 4 in 2013 (approximately age 12). In Rounds 3 and Round 4, one sibling, closest in age to the YC index child (either younger or older), was interviewed. This brings variation in that YC index children could be either born earlier or later in our analysis.8
To reduce heterogeneity in child activities and parental investment, we con-fine the sample of YC index children9 and their siblings to be aged from 7 to
14 in Round 4, being old enough to enter in primary school and young enough to stay in the primary school in Ethiopia. The sample is reduced to 701 sib-ling pairs (1,402 observations) in the sibsib-ling-difference specification, born from 1998 to 2006.
2.3.1
Rainfall
We use monthly rainfall data at community level additionally provided to us by Young Lives, which we merge with the survey data using birth year, birth month and birthplace (from Round 1 and Round 2 survey), in order to generate instrumental variables at the child-specific level. Annual rainfall is measured for each child from the 12 months prior to the birth month, so that the rainfall shock varies monthly and yearly. We use standardised annual rainfall fromin utero, the first, second and third year of the child’s life in the birthplace of the child as instrumental variable , following the literature arguing that this is the critical developmental period (Almond et al., 2018). During this period, ade-quate rainfall contributes to improved income for the household and therefore translates into a positive nutritional input for child ability (Maccini and Yang, 2009). The mean and standard deviation are calculated at the birth community level using rainfall from 1985 to 2008. In the context of Ethiopia, an extremely
8There are 610 YC index children older than their surveyed siblings, and 91 who are
younger. The average age difference in month is 27 months. See Table 2.1 for details.
drought-prone agricultural country, we hypothesise that higher the level of the rainfall during the critical developmental period, the better for the child’s ability (Dercon and Porter, 2014).
FIGURE2.1: Annual rainfall by community, 1998-2008
Since the sibling pairs in our sample are mainly born in the same commu-nity, the variation in the child-specific instrument variable relies on the time dimension, namely the birth month and birth year.10 As the sibling pairs in the
sample are born between 1998 and 2006, we check the distribution of annual rainfall in each community during the period from 1998 to 2008 (i.e. the sec-ond of year of life for a child born in 2006). Figure 2.1 shows that the rainfall in most of the communities is volatile, characterised by two severe droughts in 1999 and 2002 in Ethiopia. As 90% of the sibling pairs in our sample are born at least two years apart, the correlation of the rainfall instrumenting for
10Three percent of the sample were born in different communities due to migration, we
include these and controls for community fixed effects. The results are robust to excluding this 3%, shown in Table 2.6 row 7.
each child ability is arguably weak.11 Furthermore, we carry out a series of t
tests to examine the difference in rainfall that sibling pairs experience in their early life respectively and find that the annual rainfall during the critical devel-opmental period between index child and the sibling is statistically different. Specifically, the index child is reported to be exposed to a statistically lower level of rainfall as they are mostly born during 2001 and 2002, when drought hit Ethiopia.
2.3.2
PPVT scores as a measure of cognitive ability
To analyse the effect of children’s cognitive ability on within-household al-location of cognitive resources, our main independent variable of interest is the child’s cognitive ability in 2009 (Round 3). The Peabody Picture Vocabu-lary Test (PPVT) is a receptive vocabuVocabu-lary test designed by Dunn and Dunn (1997), a consistent test measuring cognition ability for both index children and siblings in Young Lives. Therefore we measure the child’s cognitive abil-ity using this metric.12 The PPVT is a widely used test to measure verbal
abil-ity and general cognitive development (see Crookston et al. (2013); Paxson and Schady (2007)), and the PPVT test score is positively correlated with other common measures of intelligence such as the Wechsler and McCarthy Scales (Campbell, 1998). Given that Round 3 is the first round that has information on siblings, our analysis only uses the latter two available rounds of the Young Lives data.
11We acknowledge that as a cohort study, half of the index children in our sample are born
within twelve months of one another, and therefore if any policy or other shock which is correlated with rainfall happened during the birth period, then results may be influenced by such an unobserved cohort effect. However, examining the community datafiles from the Young Lives survey we did not find any such events.
12In the Young Lives study, there are two other cognitive tests, the Early Grade Reading
Assessment (EGRA) and a maths test. However, they are only available for index children, not for siblings.
FIGURE2.2: IRT PPVT scores by language, 2009
Given the difficulty of comparing raw PPVT scores across different rounds of data collection as children age, we employ item response theory (IRT) to standardise cognitive measures by language, following Leon and Singh (2017).13 Figure 2.2 shows that the IRT PPVT scores increase along with the age, yet the means of IRT PPVT scores vary by language, consistent with findings of (Leon and Singh, 2017) (Tigrigna is the highest, followed by Amarigna and Oramifa). To ease the interpretation of subsequent estimation results, and given that is is not advisable to compare across languages (Cueto and Leon, 2012) the IRT scores have been standardised by language as our measure of cognitive ability, with a mean of 0 and a standard deviation of 1.
2.3.3
Total educational fees as a measure of cognitive resources
Our dependent variable is the allocation of parental cognitive resources, measured by the total education fees paid in 2013 (Round 4) per child. As
13See Leon and Singh (2017) for further details. We exploit the item parameters for each
language calculated by (Leon and Singh, 2017) to generate IRT scores of children in Round 3. We use Stata commandopenirtprogrammed by Tristan Zajonc.
FIGURE2.3: Young Lives Survey timings
Figure 2.3 shows, an advantage of our panel data is that it leaves a longer pe-riod of time (four years between Round 3 and Round 4) to measure potential parental responses after children are assessed by PPVT in Round 3, while prior research mostly relies on the parental involvement measured quite soon after child ability is observed. The total educational fees are the sum of school fees and private tuition fees, serving as a direct measurement of cognitive invest-ment.
To alleviate the concern that public educational investment and private tu-ition investment are substitute goods, we use Pearson’s correlation14to test the
strength and direction of the association between these two continuous vari-ables. While the Pearson correlation coefficient between the school fees and tu-ition fees,r= 0.732at 95% confidence level, suggests that in the pooled sample higher school fees are related to higher tuition fees, the correlation coefficient estimating the association between school fees and tuition fees within-family (r = −0.020) is statistically non-significant at 95% confidence level. This lack of correlation leads us to use total educational fees as the dependent variable of our main analysis.15
14We use Stata commandpwcorrto carry out Pearson’s correlation test.
15We provide analysis using private tuition fees as the dependent variable in the robustness
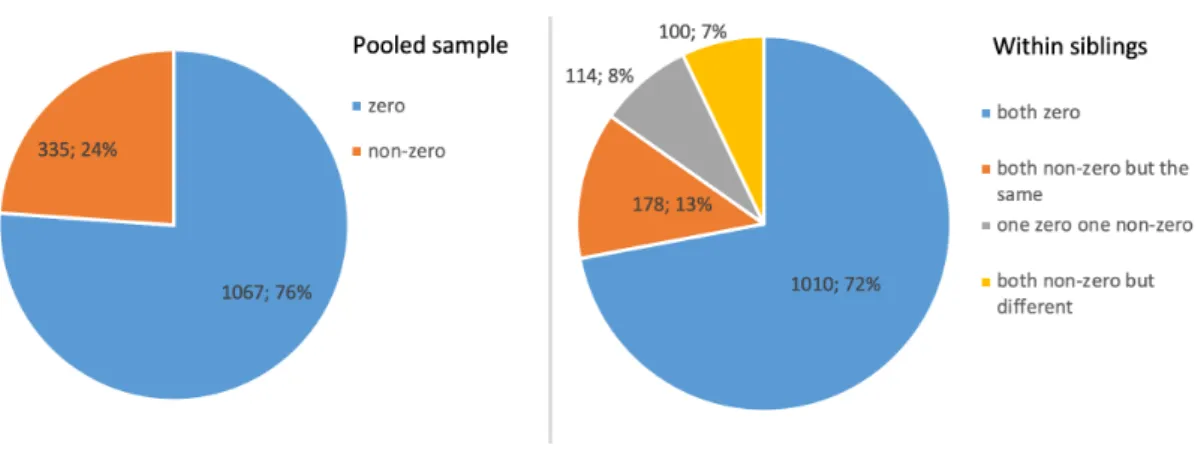
FIGURE2.4: Total educational fees
Figure 2.4 shows how total educational fees are reported. In the pooled sample, shown by the left-hand chart, 76% of parents report zero total edu-cational fees in Ethiopia, while 24% report non-zero eduedu-cational fees.16
Look-ing at the allocation between siblLook-ings, indicated by the right-hand chart, 16% of parents differentiate their financial educational resources among their chil-dren, while 13% of parents allocate financial resources in child education and adopt no differentiating strategy in investing their children. Our interest is to find out whether the parental investing strategy of those who invest financial resources in their children is responsive to the difference in cognitive ability.
School fees and private tuition fees as a proxy of cognitive resources are specifically documented in parents’ answers to the questions such as ‘how much you spend on school (private tuition) fees per year?’. For the sake of interpretation, we standardise the total educational fees for the analysis.
To understand whether parents report a higher level of investment for the index children, we perform attest on the total educational fees between index
16Our sample also includes those who are at school age but not enrolled currently, 121
chil-dren. We assign zero educational fees to them. The high percentage of zero educational fees is also due to the abolition of school fees in public schools for Grades 1 to 10 in Ethiopia in 1994. However, hidden costs remain (Oumer, 2009). UNICEF (2009) find that there were still payments in various forms in government schools after the policy of abolishing school fees. According to the Policy and Human Resource Development (PHRD) study, on average, a gov-ernment school was levying about Birr 10 to 15 per year per student.
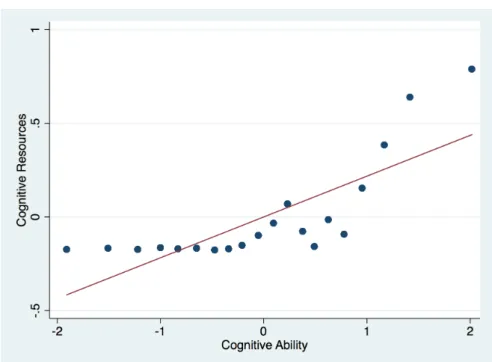
FIGURE 2.5: Mean cognitive resources and cognitive ability for each fifth percentile of the cognitive ability distribution
children and their siblings. Thetstatistics (= 0.132) shows that the difference in investment between two children is not statistically different, suggesting that parents do not deliberately report a higher investment for the index children.
Figure 2.5 shows the raw correlation between mean cognitive ability and mean cognitive resources for each 5 percentile for the included sample. De-spite the flat relationship on the left tail of the distribution, the aggregate cor-relation between ability and parental investment is positive in the cross-section OLS estimation. Our interest is to find out whether this plausible positive rela-tionship continues to hold when we apply our empirical methods accounting for child observable and unobservable factors.
Therefore, we include a series of child observable characteristics as con-founding factors. First, to alleviate the concern that the cognitive investments are age-related, we control for several age-related factors in the regression analysis. We make use of age in months, together with square and cube of age in months and dummies of birth year. Then, since evidence suggests that
children born earlier receive the greater investment (Price, 2008; Buckles and Kolka, 2014), we control for birth order. Other child-level differences which might contribute to investment variation are also controlled for in the regres-sion analysis. Specifically, maternal age at birth, Height-for-age Z-score (HAZ) in Round 3, birthplace, birth quarter, and type of siblings (e.g., born as an older brother with a younger sister, or born as an older sister with a younger brother) are taken into account.17 See Table 2.1 for summary statistics.
2.3.4
Socio-economic status (SES)
To understand whether educational investment varies by socio-economic status (SES), we carry out several exploratory ttests and find that families in-vesting in education are indeed the high-SES families. The families who make positive investments in child education are significantly richer (t= -12.253), with a significantly better educated mother (t= -9.749) and smaller size (t =-3.991). In order to further investigate whether these better-off families who invest in education differentiate their investment based on the ability gap be-tween their children, we stratify our analysis on parental responses. Specifi-cally, we employ several household characteristics (maternal education, family wealth, and household size) as indicators of family SES, while we dichotomise each indicator generating a high-SES group and a low-SES group following Grätz and Torche (2016). With regard to maternal education, in fact, half of the mothers in our sample are not educated at all, so that we distinguish between families by having an educated mother or a non-educated mother. In the case
17There are eight factor variables to denote the type of siblings: born as an older brother
with a younger sister, born as younger sister with a older brother, born as an older sister with a younger brother, born as a younger brother with a older sister, born as an older brother with a younger brother, born as younger brother with a older brother, born as an older sister with a younger sister, and born as a younger sister with a older sister. When we use our fixed-effects strategy, many are dropped due to their multicollinear relationship when the information of index children is deducted by their siblings’. Note that we only include time-varying house-hold characteristics due to our sibling difference specification
TABLE2.1: Summary statistics
Variable Mean SD Mean SD
(within) (within)
Cognitive resources
Total educational fees (standardised) 0.000 1.000 -0.007 0.054
Cognitive ability
PPVT scores (standardised) 0.000 1.000 -0.867 0.891
Child characteristics
Age in months 131.758 21.263 -26.765 23.184
Maternal age in months at birth 27.370 6.064 2.215 1.952
Birth order 3.490 1.858 0.743 0.682
Born as an older sister with a younger brother (dv) 0.118 0.322 -0.173 0.454 Born as an older brother with a younger sister (dv) 0.135 0.342 -0.218 0.471 Born as an older brother with a younger brother (dv) 0.130 0.336 -0.211 0.464 Born as an older sister with a younger sister (dv) 0.118 0.322 -0.138 0.465 Born as a younger brother with an older sister (dv) 0.130 0.336 0.211 0.464 Born as a younger sister with an older brother (dv) 0.118 0.322 0.138 0.465 Born as a younger brother with an older brother (dv) 0.118 0.322 0.173 0.454 Born as a younger sister with an older sister (dv) 0.135 0.342 0.218 0.471
HAZ in Round 3 -1.359 1.129 -0.141 1.233
Birth quarter 1 (dv) 0.213 0.410 0.013 0.577
Birth quarter 2 (dv) 0.295 0.456 -0.054 0.646
Birth quarter 3 (dv) 0.216 0.412 0.021 0.608
Birth quarter 4 (dv) 0.275 0.447 0.020 0.618
Rainfallin utero(standardised) 0.075 0.901 -0.497 1.210
Rainfall at birth (standardised) -0.449 1.039 1.225 1.440
Rainfall in year 1 (standardised) -0.155 0.796 0.924 0.997
Rainfall in year 2 (standardised) -0.055 0.704 0.307 0.956
Household characteristics
Wealth index 0.348 0.164 0.000 0.000
Mother with education (dv) 0.459 0.499 0.000 0.000
Household size 6.522 1.646 0.000 0.000
N 1402
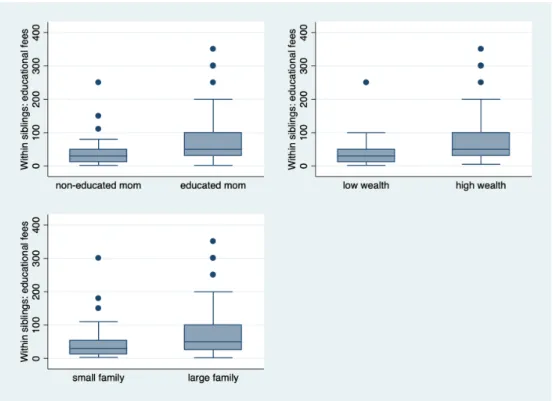
FIGURE 2.6: Intra-household difference in total educational fees by SES
of family wealth and household size, we dichotomise them using the median of wealth index and size of the family.18
Figure 2.6 shows the intra-household difference in total educational fees by SES. The distributions of within-sibling difference in educational fees are sim-ilar across three indicators. In general, the high-SES families have bigger dif-ferences in allocating educational resources among their offspring. The mean of the difference in total educational fees in low-SES families is small but non-zero.
2.4
Econometric strategy
To identify the causal effect of cognitive ability on parental investment, the analysis is based on an IV-FE model, targeting three main endogeneity threats.
18The wealth index is the average of housing quality index, consumer durable index and
First, this approach relates within-sibling pair differences in ability in 2009 (Round 3) with within-sibling pair differences in parental cognitive investment four years later in 2013 (Round 4) to address the threat of reverse causality. Sec-ond, the sibling fixed-effects (FE) models control for unobserved heterogeneity at the household level, following most existing empirical work. Third, we use instrumental variables to isolate the exogenous variation in child ability, ad-dressing endogeneity resulting from unobserved child heterogeneity.
The sibling fixed-effects structural model can be written as follows:
∆Ih =β∆CAh+ ∆XhΛ + ∆h (2.1)
where ∆Ih is the difference in cognitive investment between siblings in
fam-ily hin Round 4 (i.e., total educational fees),∆CAh is the difference in ability
between siblings in Round 3,∆Xh is a vector of differences in other
character-istics between siblings (e.g. child’s age, maternal age at birth, height-for-age in Round 3, birthplace, birth quarter, birth year, birth order, type of sibling pairs - gender of older and younger child), and∆his the difference of the
idiosyn-cratic error term between siblings. In this estimation, time-invariant household observable characteristics and household unobservable confounding factors are purged from the specification, but unobserved child heterogeneity, such as personality, remains.
As noted above we overcome endogeneity bias resulting from unobserved child heterogeneity, with an instrumental variables (IV) estimation procedure. The first stage equation is:
∆CAh =σ∆Rh+ ∆XhΩ + ∆µh (2.2)
years of child’s life between siblings as a source of exogenous variation in nu-tritional inputs experienced by the siblings, and∆µh is a random error term in
the first stage.
IV approach is also helpful in the sense of overcoming attenuation bias re-lated to measurement error in cognitive ability. Even if we consider the PPVT test score a good proxy for ability observed by parents, there is still likely to be measurement error in the test, and in its relation to parental perception of abil-ity. For example, parents may have some other perception of their children’s cognitive ability than the PPVT score. This potential problem of measurement error can be solved by our IV approach if it is classical. Indeed, in a sibling FE model, attenuation bias caused by measurement error is augmented if one’s analysis moves from a cross-sectional setting to a FE setting (Bound and Solon, 1999).
The sibling FE model coupled with the IV strategy helps us to interpretβ
as the Local Average Treatment Effect of change in parental cognitive invest-ment caused by the variation in child cognitive ability, which is driven by the exogenous variation in rainfall during the critical developmental period of the two children. We note that the monotonicity assumption applies to LATE esti-mates (Angrist and Pischke, 2008), that for an change in rainfall, there should be a monotonic increase in “treatment” intensity. If β > 0, parental invest-ment increases with relative ability. Parents reinforce the differences in ability by allocating more resources to the high-ability child. If β < 0, it means par-ents compensate for the difference in ability, allocating more resources to the low-ability child.
Under the assumption of higher marginal returns to investment in higher-ability children, the case ofβ >0also implies that parents are concerned more with the efficiency of investment and try to maximise their children’s total fu-ture wealth. The case of β < 0, on the other hand, implies that when equity
outweighs efficiency, parents forgo maximising returns from educational in-vestment, trying to achieve higher equity among children. Del Bono et al. (2012) note also that there may also be a “pure endowment effect”, whereby if marginal utility of parents with respect to any individual child’s ability is positive but decreasing (i.e., the second derivative of the utility function is negative), then higher endowment of that child effectively increases family re-sources, but these can only be released by decreasing investment in that child. This effect is then expected to operate in the same direction as the equity effect. We report two types of standard errors, one robust to general heteroskadas-ticity and the other one robust to within community dependence.19
2.5
Results
In order to test the relationship between cognitive ability and deployed cog-nitive resources, we regress parental cogcog-nitive resource allocation in primary school on cognitive ability observed one period earlier. In all of the estima-tion results, total educaestima-tional fees paid for each child is the proxy for cognitive resources, while PPVT scores are the proxy for cognitive ability.
For each specification we use the sample of children who have a surveyed sibling and the information for both siblings is available. Furthermore, we have restricted the sibling-pairs to be at primary school age and use the same language in PPVT test. A set of child-level covariates are included in all mod-els, such as age in months, maternal age at birth, height-for-age in Round 3, birthplace, birth quarter, birth order, type of sibling pairs and birth year.
2.5.1
Preliminary results
Table 2.2 presents the preliminary results from the OLS models and FE model. The inconsistency of the estimates from these models is evident, the magnitudes and signs of which are not stable as we add additional controls, suggesting severe endogeneity of the variable of interest. For example, the cross-sectional OLS estimate reported in column 1, when only child-level con-trols are included in the model, suggests a positive relationship between ability and total educational fees. However, when we include household-level traits, maternal educational background and regional fixed-effects in the model, the point estimate decreases from0.133to0.059.
However, the OLS estimate is still likely to be biased due to unobserved characteristics within the family, such as genetically innate ability, parental preferences for child quality, and budget constraints. Hence, we exploit the sibling-FE model, using a similar strategy to Bharadwaj et al. (2018), Datar et al. (2010) and Hsin (2012) studying parental responses to birth-weight, con-trolling for unobserved household-level characteristics. In column 5 of Table 2.2, the FE estimate suggests a negative association between ability and invest-ment, although it is not statistically significant. Aside from this, endogeneity bias might still persist since the cognitive ability is postnatal and time-varying, which allows after-birth ability to embody a significant component of prior parental investment.
To address the bias, we isolate the exogenous variation in cognitive ability using quasi-exogenous variation in rainfall during the critical developmental period. Thus we apply instrumental variable methods to the sibling fixed-effects approach (IV-FE), a similar approach to Frijters et al. (2013) and Leight (2017), who use the same strategy but different instruments to ours.
TABLE2.2: Preliminary regression models
DEPENDENTVARIABLE: OLS OLS OLS OLS FE
TOTAL EDUCATIONAL FEES (1) (2) (3) (4) (5)
Cognitive Ability 0.133** 0.076* 0.064** 0.059** -0.002 (0.060) (0.041) (0.032) (0.029) (0.004) Child-level controls Yes Yes Yes Yes Yes Household-level controls - Yes Yes Yes Yes Mother-level controls - - Yes Yes Yes Region fixed-effects - - - Yes Yes
Sibling fixed-effects - - - - Yes
Observations 1402 1402 1402 1402 1402
Note: Community clustered standard errors are in parentheses. * p < 0.10, **
p <0.05, ***p < 0.01. The dependent variable is total educational fees. Children controls are age in months, square of age in months, cubic of age in months, ma-ternal age at birth, gender, birth place, birth quarter, birth order, birth year, height-for-age Z-score, language of tests, and the type of sibling. Household-level controls are type of residential site, household size, wealth index, and gender of household head. Mother-level controls are a series of levels of maternal education.
2.5.2
Main results
2.5.2.1 IV-FE models: First-stage results and diagnostics
Before presenting our main IV-FE results, we discuss the first-stage results, as well as the underidentification and weak identification tests in Table 2.3. Specifically, in the first-stage estimations endogenous cognitive ability is re-gressed on the exogenous regressors and excluded instruments (i.e., the rain-fall during critical developmental period). We find that children who experi-enced relatively good rainfall aged 0-24 months have significantly higher test scores than their siblings in their early childhood; rainfall during infancy is
relevantto cognitive ability as proxied by receptive vocabulary.
Shown in column 1 to 4 in Table 2.3, we regress ability in childhood on annual rainfall from in utero to the first three years of child life respectively. We find that annual rainfall during 0 to 12 months of life and 13 to 24 months of life are significant. Therefore, we construct an IV using the average rainfall during 0 to 24 months of life and report the result in column 5. The estimate is positive and statistically significant, with atstatistic of 5.70, suggesting that an increase of one standard deviation in rainfall during the first two years of life is correlated with an increase of 15.6% of one standard deviation in cognitive ability in early childhood. In column 6, when we include both the rainfall during the first year and the second year of life as IVs into the IV-FE model, both of the estimates are positive and statistically significant.
With regards to the underidentification tests20, thep-values for the
specifi-cations 2, 3, 5, and 6 all reject the hypothesis that the IV models are underiden-tified respectively, though not specifications 1 and 4, suggesting that the IV models are likely to be underidentified using either rainfall in utero (column
20The underidentification test is an LM version of the Kleibergen and Paap (2006), which
T A B L E 2 .3 : First stage regr essions: Results and tests of underidentification and weak identification Cognitive Ability (1) (2) (3) (4) (5) (6) Rainfall in Uter o -0.038 (0.027) [0.028] Rainfall at Birth 0.102 0.069 (0.020)*** (0.023)*** [0.028]*** [0.029]** Rainfall in Y ear 1 0.144 0.091 (0.029)*** (0.033)*** [0.042]*** [0.044]** Rainfall in Y ear 2 0.047 (0.034) [0.034] A verage Rain at Birth and Y ear 1 0.156 (0.027)*** [0.038]*** Underidentification test: χ (1) 2 = 2 . 092 χ (1) 2 = 24 . 543 χ (1) 2 = 24 . 472 χ (1) 2 = 2 . 011 χ (1) 2 = 30 . 805 χ (2) 2 = 31 . 132 p value 0.148 0.000 0.000 0.156 0.000 0.000 W eak instrument test: Montiel-Pflueger (MP) ef fective F stat 2.012 25.582 24.716 1.958 32.539 17.169 Montiel-Pflueger critical values: 5% of worst case bias 37.418 37.418 37.418 37.418 37.418 5.808 10% of worst case bias 23.109 23.109 23.109 23.109 23.109 4.550 20% of worst case bias 15.062 15.062 15.062 15.062 15.062 3.828 Observations 1402 1402 1402 1402 1402 1402 Note : W ithin-household fixed ef fe cts estimates. Robust standar d err ors in par entheses. Cluster ed standar d err ors by community in brackets. * p < 0 . 10 ,** p < 0 . 05 ,*** p < 0 . 01 . Child contr ols include age in months, squar e of age in months, cubic of age in months, maternal age at birth, birth or der , height-for -age Z-scor e in round 3, b irthplace, birth quarter , birth year , and the type of sibling (such as born as an older sister and pair ed with a younger br other). Both the underidentification test and weak instr ument test ar e robust to heter oskedasticity . The Montiel-Pflueger (MP) F statistics ar e very similar to Kleiber gen-Paap rk W ald F statistics in weak instr ument test. The MP weak instr ument test of fers valid critical values at 95% confidence level and test statistics in the absence of assumption of i.i.d. data.