econ
stor
www.econstor.eu
Der Open-Access-Publikationsserver der ZBW – Leibniz-Informationszentrum Wirtschaft
The Open Access Publication Server of the ZBW – Leibniz Information Centre for Economics
Nutzungsbedingungen:
Die ZBW räumt Ihnen als Nutzerin/Nutzer das unentgeltliche, räumlich unbeschränkte und zeitlich auf die Dauer des Schutzrechts beschränkte einfache Recht ein, das ausgewählte Werk im Rahmen der unter
→ http://www.econstor.eu/dspace/Nutzungsbedingungen nachzulesenden vollständigen Nutzungsbedingungen zu vervielfältigen, mit denen die Nutzerin/der Nutzer sich durch die erste Nutzung einverstanden erklärt.
Terms of use:
The ZBW grants you, the user, the non-exclusive right to use the selected work free of charge, territorially unrestricted and within the time limit of the term of the property rights according to the terms specified at
→ http://www.econstor.eu/dspace/Nutzungsbedingungen By the first use of the selected work the user agrees and declares to comply with these terms of use.
zbw
Leibniz-Informationszentrum Wirtschaft Leibniz Information Centre for Economics Zibrowius, MichaelWorking Paper
Convergence or divergence? Immigrant
wage assimilation patterns in Germany
IWQW discussion paper series, No. 03/2011Provided in cooperation with:
Friedrich-Alexander-Universität Erlangen-Nürnberg (FAU)
Suggested citation: Zibrowius, Michael (2011) : Convergence or divergence? Immigrant wage assimilation patterns in Germany, IWQW discussion paper series, No. 03/2011, http:// hdl.handle.net/10419/44399
_____________________________________________________________________
Friedrich-Alexander-Universität
IWQW
IWQW
Institut für Wirtschaftspolitik und Quantitative
Wirtschaftsforschung
Diskussionspapier
Discussion Papers
No. 03/2011
Convergence or divergence?
Immigrant wage assimilation patterns in Germany
Michael Zibrowius
University of Erlangen-Nuremberg
Convergence or divergence?
Immigrant wage assimilation patterns in Germany
Michael Zibrowius
January 2011
Abstract
Using a rich German panel data set, I estimate wage assimilation patterns for immigrants in Germany. This study contributes to the literature by performing separate estimations by skill groups and controlling for a wide range of socio-economic background variables. It aims to answer the question whether Germany can be considered an attractive host country from an immigrant’s perspective. Comparisons with similar natives reveal that immigrants’ experience earnings profiles are flatter on average, although clear differences show up among skill groups. The effect of time spent in the host country is significantly positive for all skill groups and thus partly offsetting the diverging trend in the experience earnings profiles. Still, wage differences between natives and immigrants remain. They are particularly noticeable for highly skilled immigrants, the group needed most in Germany’s skill intensive labor market. Separate estimations for immigrant subgroups confirm the general validity of the results.
JEL Codes: F22; J31; J61
Key Words: International migration; wage differentials; assimilation; longitudinal data
Correspondence to: Michael Zibrowius Economics Department Univ. of Erlangen-Nuremberg Lange Gasse 20 D-90403 Nuremberg Germany Email: [email protected]
Helpful comments by Regina T. Riphahn, Barbara Hanel, David Kiss, Steffen Müller, Robert Orlowski, and Christoph Wunder on earlier versions of this paper are gratefully acknowledged. I wish to thank the participants of the 16th annual Young Academics Workshop of the German Statistical Association for additional insights.
1
1.
Introduction
The assimilation of immigrants with respect to the social, cultural, and economic conditions in their host countries lies in the center of the debate of immigration policy in Europe. Kahanec and Zimmermann (2010) note that the “proper management of high-skilled immigration is of key importance for Europe”, and the OECD (2010a, 2010b) emphasizes the importance of policy reforms in order to clause the prevalent employment gap especially in the high skilled manufacturing sector particularly in Germany. There, politicians from all sides vow to increase immigration of high skilled labor. However, the question of whether Germany is in fact an attractive host-country for labor immigrants in the long run is open: what are the earnings opportunities of immigrants as compared to those of natives? Is there a catching-up process with additional time spent in Germany (as found for the United States by Chiswick (1978)) or are immigrants faced with persistent earnings disadvantages? Are there differences among various skill groups, i.e. do highly skilled immigrants suffer greater wage penalties than low skilled immigrants as compared to their native counterparts? Moreover, do highly skilled immigrants face sufficiently dispersed returns to skills that make it attractive for them to come to Germany? The answers to these questions are particularly relevant in light of the ongoing global “Battle for Brains” (Bertoli et al. (2009)) in which Germany with its highly skilled workforce is engaged.
I study how newly arrived immigrants adjust to natives in terms of wages. I identify the effect of time spent in the host country on hourly wages, i.e. the manner in which years since migration influence the wage assimilation of immigrants in Germany. Furthermore, I look at how differences in returns to experience between natives and immigrants affect the assimilation process of immigrants. As it is a political and economic objective to attract full time working immigrants, I restrict my analysis to the group of full time working first generation immigrants and examine whether they assimilate in terms of wages.
2
The assimilation of immigrants to Germany has been investigated mainly on the basis of the German Socio-Economic Panel (GSOEP)1 (see, among others, Aldashev et al. (2009), Constant and Massey (2003, 2005), Schmidt (1997), and Zeager (1999)). The results and methods used to obtain the effect of time spent in Germany (ysm) on wages vary considerably: while some researchers report no significant ysm-effect (Schmidt (1997), Zeager (1999)), others find a concave effect as reported in Chiswick (1978) (i.e. Aldashev et al. (2009)) or even a slightly convex effect (as documented in Constant and Massey (2003)).
This study contributes to the literature by looking not only at immigrants and natives in general but by doing separate analyses for high, medium, and low skilled workers. Also, in contrast to previous work on the field that omits important variables such as occupational and industry information or does not control for age at migration (Chiswick and Miller (2003), Adsera and Chiswick (2007)), I control for an extensive array of socio-economic background information.
I present evidence that the assimilation pattern as measured by the effect of time spent in the host country is generally significant in Germany. Nevertheless, there are substantial differences in the extent of wage convergence between immigrants and natives over their working lives, especially with respect to their skill level. These differences are partly driven by disparities in the returns to experience. At low values of work experience, additional work experience yields lower returns for immigrants than for natives. After 19 years of work experience, returns to additional experience are higher for immigrants than for natives. However, the earnings gap has by that time already widened too far, such that wage convergence cannot be achieved. Results also differ by skill groups: immigrants are able to catch up with their native counterparts if they are low skilled and face wage divergence if they are highly skilled. This finding partly confirms that Duleep and Regets’ (1996) U.S. result is
1
3
also valid in Germany, i.e. that there exists an inverse relationship between initial earnings and subsequent earnings growth for immigrants.
2.
Theoretical background
Theoretical explanations for wage differences between immigrants and natives as well as the subsequent convergence or divergence of wage levels for both groups are diverse and lack a single coherent superstructure. I present three main conceptual approaches and derive their implications for the earnings path of immigrants over time relative to that of natives.
The most widely used departure point in dealing with differences in earnings is human capital theory (Becker (1975), Mincer (1974)). Existing inequalities in earnings are traced back to differences in skills, which in turn lead to differences in productivity and thus different wages. Immigrants who arrive in their new host country often lack country-specific human capital – such as information about customs and traditions, or information about labor market institutions – irrespective of whether or not their formal educational qualification is the same as that of natives. The lack of these country-specific skills may lead to lower starting wages of immigrants as compared to natives. By upgrading their level of skills (i.e. by investments in their human capital), immigrants should be able to increase their productivity and catch up with natives, ceteris paribus. Thus, we would assume that the time spent in the host country which is used to invest in host country-specific skills should have a positive effect on immigrants’ wages. The effect of years since migration could therefore be positive, given such investments in host country-specific human capital occur.
To account for an initial earnings gap between immigrants and natives, we can also refer to theories of discrimination. According to Becker (1957), discrimination arises when members of one group (e.g. immigrants) are treated differently (i.e. are paid less or are less likely to be promoted) than the members of a different group (e.g. natives), even though both
4
groups may dispose of the same observable characteristics. The earnings gap may arise because of statistical discrimination or stereotypical thinking of employers or only pure preference-based discrimination (cf. Arrow (1973), Brekke and Mastekaasa (2008), and Quillian (2006), among others). Discrimination in the form of lower wages for immigrants may also be rational for employers, if immigrants’ reservation wages are below those of natives when faced with the same job offer. The relevance of discrimination may even increase over immigrants’ working careers since job promotion usually goes along with higher earnings. As work experience increases, the earnings differential between immigrants and natives may be widening if “glass ceilings” prevent immigrants to reach certain positions and the earnings associated with them (cf. Cotter et al. (2001), Pendakur and Woodcock (2010)).
The idea of increasing inequalities between immigrants and natives regarding their wages is likewise employed in the theory of cumulative advantages dating back to Merton (1968). Tomaskovic-Devey et al. (2005) and Brekke and Mastekaasa (2008) adopt this theory in the context of human capital acquisition and immigration. If the production of human capital is at least in part endogenously determined by the kind of an individual’s job or work, then those employees with a “good” first job that offers sufficient possibilities for training and learning, will also have a higher probability of obtaining a better second job afterwards; a good second job will lead to a good third job and so on. If immigrants have in general a worse starting position than natives (e.g. because they lack country-specific human capital, or are discriminated against) they (i) will have lower observed returns to experience and (ii) may not be able to catch up with natives even if the returns to years since migration are positive.
These three theoretical approaches used to explain the path of earnings convergence or divergence between immigrants and natives are by no means exhaustive. Their predictions are partly ambiguous and unobserved aspects play an important role. In the remainder, however, I
5
will concentrate on testing the following hypotheses in order to find answers to the three questions stated in the first Section.
Hypothesis 1: A positive effect on earnings is expected for additional country-specific human capital given that immigrants start acquiring such host country-specific human capital once they arrive. Immigrants are thus expected to catch up with natives in terms of earnings with additional years since migration.
Hypothesis 2: As natives may be able to move up the career ladder faster than immigrants, the returns to work experience are expected to be ceteris paribus higher for natives than for immigrants with otherwise comparable characteristics. The experience earnings profiles of immigrants are therefore expected to be flatter than those of natives, and wages of immigrants and natives will thus diverge.
Hypothesis 3: Differences in the effect of work experience are expected to be more pronounced in case of high skilled as compared to low skilled individuals. The productivity of high skilled individuals is more closely tied to their level of experience, as they are typically employed in more complex working environments (see Constant and Massey (2005)). For high skilled immigrants, the “glass ceiling” effect should thus be of greater importance. The cumulative advantages of natives may lead to greater discrepancies in the returns to experience than is the case for the low skilled, especially during the early years of the working career. I therefore assume the difference in the returns to experience to be the largest for high skilled and the smallest for low skilled individuals.
3.
Data and method
3.1 Data, sample, and descriptive statistics
I use data from the 1984 to 2009 waves of the German Socio-Economic Panel (GSOEP). The GSOEP is a nationally representative longitudinal survey covering
6
approximately 11,000 households and more than 20,000 individuals. In contrast to administrative data, it offers not only gross earnings and work related information, but also a wide variety of socio-economic and family background variables. Since immigrants are oversampled, the data contain a sufficiently large number of observations. I consider first generation immigrants, defined as those immigrants born outside of Germany with a definite own migration experience. Natives are made up of individuals born in Germany and having German citizenship since birth. Second generation immigrants are thus not included in the analysis.2
The sample contains male, full time workers aged 18-65 for whom information is available about the dependent variable, i.e. the logarithm of gross hourly earnings (in 2006 prices), and all other background variables described below.3 Military personnel (ISCO code 0) are excluded from the analysis. As there are only few immigrants living and working in East Germany I only use individuals residing in West Germany.4 To exclude potential outliers the top and bottom one percent of observations with respect to hourly wages are dropped.5 After these adjustments the sample consists of 56,991 person-year observations for natives and 16,810 for immigrants based on 8,160 and 2,444 individuals, respectively.
For both immigrants and natives the analysis further separates by skill group which I define referring to the International Standard Classification of Education (ISCED-97). A person is considered as low skilled if he has completed only primary or lower secondary education (ISCED 1-2). Individuals are referred to as medium skilled if they have achieved some sort of upper secondary schooling and/or post-secondary, non tertiary education such as
2
I drop those individuals who (i) are born in Germany and do not have German citizenship or who (ii) are born in Germany and acquired German citizenship only later in their lives. As more than 60 percent of all respondents have missing values for their parent’s nationality, I restrain myself to this distinction.
3
The situation of immigrant women is not considered. The sample restrictions applied would lead to an insufficient number of observations in the respective cells because of low full time work participation of women.
4
Only 1.85 percent of all migrants sampled in the GSOEP reside in East Germany.
5
This was done separately for immigrants and natives to account for differences in the earnings distributions of both groups.
7
vocational training6 (ISCED 3-4). In the German educational system, this group includes individuals whose highest educational degree is the Abitur. High skilled individuals are those who have received advanced vocational training or attained a tertiary educational degree from college or university (ISCED 5-6).
Table 1 presents summary statistics for natives (columns I-IV) and immigrants (columns V-VIII). In the pooled samples for natives and immigrants (columns I and V), outcomes are similar for many variables such as actual work experience or age. However, we find clear differences in average gross hourly wages (in 2006 Euros), where the wages of immigrants are 21 percent below those of natives (not adjusted for differences in skills). The skill distributions of immigrants and natives also differ substantially: while only 10 percent of the immigrants are high skilled and 40 percent have no secondary educational degree, these numbers are almost reversed in case of the natives, where 33 percent are high skilled and only 12 percent are in the low skill category.
Table 1 about here
I find sizeable differences in the distributions of natives and immigrants with respect to occupations and sectors (cf. Table 1). Because of these inequalities, outcomes are also regarded separately for the main professional groups (see Section 5).
The observed immigrant-native differences in average characteristics are similar within skill groups. The highest wage gap is found for high skilled individuals with a 19 percent disadvantage for immigrants.
Table 2 sheds light on immigrant specific individual characteristics. Most immigrants in the GSOEP have already spent a considerable amount of time in Germany (the median is
6
ISCED level 4 programs are designed to prepare students for studies at ISCED level 5 who, although having completed ISCED level 3 (upper secondary education), did not follow a curriculum which would allow direct entry to level 5. Typical examples are pre-degree foundation courses or short vocational programs (technical schools, evening courses etc.).
8
19 years, the average value 19.4 years) and a majority of them, especially the predominantly low skilled guest workers (Gastarbeiter) arrived in Germany before 1973. We observe high shares of immigrants from the typical recruitment countries for guest workers (Pischke and Velling (1997)) – namely Turkey, Greece, Italy, and former Yugoslavia. High skilled immigrants, most of whom arrived in Germany after 1973, have to a larger extent Eastern European roots or come from other Western countries. 50 percent of the high skilled immigrants are German citizens, whereas this is the case for only 7 percent of the low skilled.
Table 2 about here
3.2 Empirical Method
In this section I examine how individual characteristics affect hourly wages and test whether immigrants’ earnings converge to those of natives with additional time spent in the host country. I consider how differences in hourly wages evolve over time by looking at the effects of additional work experience and years since migration to test hypotheses 1-3.
Chiswick (1978) as well as Borjas (1985) consider U.S. census data and use standard OLS estimators to identify the ysm effect. Regarding the European case, this has also been the most prominent approach (see e.g. Zimmermann (2005) for an overview of existing evidence). For this analysis I also turn to OLS and use clustered standard errors to allow for individual error term correlation. As endogeneity is of concern when estimating earnings equations including measures of experience and tenure, the estimated coefficients should be regarded as describing correlations rather than distinct causal effects. Return migration, which may lead to positive selection in the group of immigrants staying in Germany because of non
9
random panel attrition, might be a further issue. Yet, using data from the GSOEP as well (years 1984-1993), Dustmann and van Soest (2002) show that no such effect is observable.7
An important issue when dealing with earnings equations is the disentanglement of period, cohort, and time effects that are perfectly multicollinear. In the context of such an earnings equation, controlling for arrival cohorts, years since migration, and calendar year dummies would lead to unidentifiable coefficients. I circumvent this problem by using a very broad definition of immigration cohorts (i.e. I distinguish only between immigrants having arrived prior to 1973, between 1974 and 1988, and after 1989) as well as by following the suggestion of Heckman and Robb (1985) in using the average yearly West German unemployment rate instead of calendar year dummies as a proxy for general business cycle effects.
Years since migration and actual work experience are both significantly positively correlated with the logarithmized hourly wage of immigrants. Given a likewise significant positive correlation between these two variables8, omitting either experience or ysm in the regression equation would lead to a distinct upward bias in the estimated effect of the included variable. Comparisons between models using only ysm, only experience, or both variables as third degree polynomials for immigrants (in addition to the vectors of socio-demographic control variables X and Z, see below) indicate significant differences in the estimated effects of these variables.9 Hence, both ysm and experience are included jointly.
The framework for the analysis is a standard wage model of the following form:
7
They note, however, that in case of the existence of selective return migration, the estimated effects of language fluency and other variables should be considered as lower bounds of the real effects.
8
For immigrants, the correlation coefficient between work experience and log(hourly wage) is .16, between ysm and log(hourly wage) .29, and between work experience and ysm .47.
9
STATA’s suest (seemingly unrelated estimation) command allows for testing cross-model hypotheses, e.g. regarding significant differences in the effect of particular variables in two or more different model specifications, which is what is done here.
10
log _ ² ³ ′
for natives, and
log _ ² ³ ′
′
for immigrants.
To facilitate inference, the two equations are jointly estimated in a fully interacted model.10 The dependent variable is the logarithm of gross hourly wages in 2006 prices. Experience (exper) is measured by an individual’s actual work experience instead of some measure of potential work experience. X represents a vector of individual characteristics such as tenure in linear, quadratic, and cubic form, number of children in the household, dummy variables for region of residence, community size, marital status, self-employment, occupation and sector, and a constant. Z includes immigrant specific information in terms of language skill indicators (spoken and written), arrival cohort, age at migration, and country of origin. and measure the effect of the average yearly unemployment rate for West Germany (ur)11 (this is the proxy I use to capture general business cycle effects also affecting wages). stands for a normally distributed error term. Subscripts n and m refer to natives and immigrants, where immigrant coefficients refer to the interaction term between an immigrant-dummy and the corresponding variable. Models omitting regional information and not controlling for industry and occupation, as well as models excluding immigrant specific
10
Results from models using only squared terms of experience, tenure and ysm do not differ qualitatively from the models presented here and are available from the author upon request. As the cubic terms are all jointly significant, they are included to improve explanatory power (cf. Murphy and Welsh (1990)). Additionally, they allow for modeling the marginal effects of work experience and ysm as 2nd degree polynomials instead of imposing the same slope over the entire range.
11
The unemployment rate was obtained from official tables of the German Federal Employment Agency, see http://www.pub.arbeitsagentur.de/hst/services/statistik/detail/z.html?call=r.
11
characteristics were estimated separately to verify the robustness of the results. An overview is given in Appendix Table A1. The model presented above, incorporating all available information, is chosen due to the highest explanatory power in terms of the adjusted R².
4.
Results and discussion
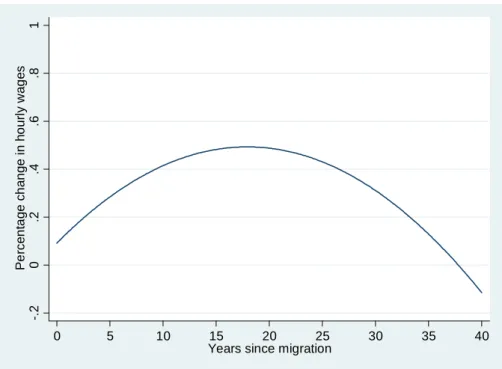
A full overview of the OLS results for the pooled sample as well as separately by skill group is presented in Appendix Tables A2-A5. The estimation results for the coefficients of experience and ysm of the full sample are presented in Table 3. There is a clear effect of the duration of residence in Germany: while the ysm terms are all individually insignificant, they are highly significant when tested jointly. The result confirms human capital theory, i.e. country-specific human capital acquired in the years after migration positively influences earnings (see Figure 1). Also, the coefficients of German language proficiency (spoken and written) are both positive and significant (see Appendix Table A2). Nonetheless, there appear to be other factors apart from language proficiency – attributable e.g. to getting accustomed to the host country’s labor market institutions and working culture – that seem to have a significant positive effect on earnings. The effect of years since migration captures this acquisition of host country-specific human capital. As it is jointly significant and positive for all values from 0 to 40, hypothesis 1 is thereby not rejected.
Table 3, Figure 1 about here
For natives, an additional year of experience (measured at the mean of experience) is associated with an increase in hourly wages by ceteris paribus.24 percent, whereas the comparable effect for immigrants is .22 percent. The result suggests that there is hardly any difference between the two groups when considering the returns to experience. However, when looking at the predicted experience earnings profiles (Figure 2) of immigrants and
12
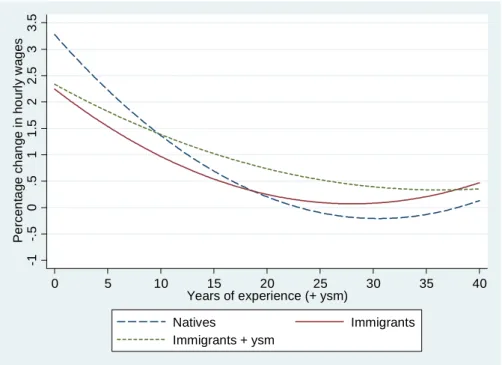
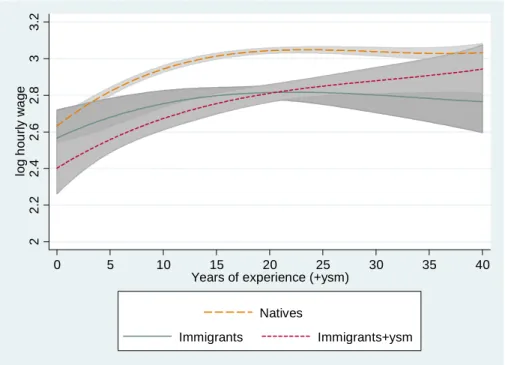
natives,12 it becomes evident that immigrants’ earnings at low values of experience, i.e. at the beginning of their working careers, are considerably below those of natives. Moreover, one can infer from Figure 3 that the effect of work experience is greater for natives than for immigrants: holding ysm constant, at a level of work experience of one year an additional year of work experience is associated with an increase of hourly wages for natives by 3.1 percent as compared to an increase of 2.1 percent for immigrants. At 5 years of experience, the effect is 2.2 percent for natives and 1.5 percent for immigrants. It is not until they have reached 19 years of work experience that immigrants receive the same returns to an additional year of work experience (see Figure 3). By that time, the average differences in the hourly wage rates are already considerable. Even though Figure 3 provides some evidence for converging wages at higher values of experience – i.e. higher returns to experience for immigrants than for natives –, the initial divergence cannot be fully overcome. However, when looking at the combined effect of additional years of work experience going along with additional time spent in Germany (see Figure 3), the picture becomes different. In this extreme case, where all of an immigrant’s work experience is obtained in Germany, equality in the effect of experience is already reached after 10 years. Still, the results deliver overall evidence in favor of hypothesis 2, i.e. higher initial wage growth for natives with additional work experience (cf. Figures 2 and 3).13
Figures 2 and 3 about here
As the observations described above refer to the average outcome of all persons and differences in skills are controlled for only by changes in the intercept, I present separate estimations for high, medium, and low skilled workers in order to test hypothesis 3. Table 4 offers selected results for the different skill groups.
12
The experience earnings profiles were calculated by setting the variables of immigrants and natives at their respective means and varying experience, holding constant tenure and ysm. This was done using STATA’s
adjust command.
13
13
When considering the effect of ysm on hourly wages for immigrants, we observe positive marginal effects for all skill groups, although joint significance for the ysm terms is given only for medium and low skilled immigrants (see Table 4, Figure 4). Still, these results seem to confirm the validity of hypothesis 1.
Table 4, Figure 4 about here
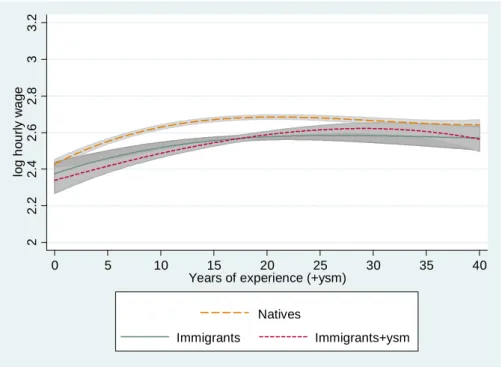
Hypothesis 2, which suggests higher wage growth for natives with additional work experience, is also not rejected. Immigrants ceteris paribus reach parity in the marginal effect of additional work experience after 13 (medium skilled) to 27 (high skilled) years, when natives have already reached higher hourly wages than their immigrant peers. In general, immigrants’ predicted experience earnings profiles are flatter than those of natives (see Figures A1, A3, and A5 in the appendix). Again, combining the marginal effect of experience and ysm for immigrants leads to earlier intersects of the curves depicting the returns to experience for immigrants and natives (cf. Tables A2, A4, and A6 in the appendix). Here, we even observe that wages grow at a stronger rate for immigrants than for natives for the low skilled at all levels of experience.
Having investigated the skill groups separately we can now test whether the difference in the returns to experience is the largest for the high skilled and the smallest for the low skilled. I compare the differences in the returns to experience between immigrants and natives. Significant differences in the marginal effects of one additional year of work experience after 1 and 5 years of experience are found between the high skill and low skill subgroups, whereas the differences between the high and medium skill subgroups are only significant after 5 years.14 Overall, I interpret the finding as strong evidence in favor of hypothesis 3: low skilled immigrants profit from additional work experience to the same
14
Bearing in mind the relatively small sample size of high skilled immigrants which may account for high standard errors, it should not be surprising to find insignificant differences in some cases. The p-value for the test of difference in the returns after 1 year is .07 and thereby not too far off the 5 percent threshold.
14
extent than natives, but high skilled natives have significantly higher returns to experience than immigrants (at least at low levels of experience).
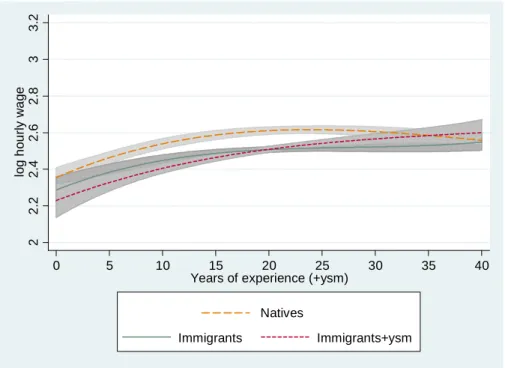
As a last point, I compare the predicted experience earnings profiles for high, medium, and low skilled immigrants (based on the estimation results from Table 4) to see whether there is sufficient dispersion in the returns to skills between the groups to make it attractive for highly skilled immigrants to consider Germany an attractive host country (cf. Borjas, 1999).15 Figure 5 shows that highly skilled immigrants fare considerably better than their peers with lower skills. Further information about the returns to skills in the respective home countries of immigrants would be needed to identify from which countries high skilled migration is most likely to occur. Still, the result indicates that there is a considerable dispersion in the returns to skill in Germany to make it more likely and more worthwhile for higher skilled individuals to immigrate there in general as were the case in the absence of such a difference in the returns to skills.
Figure 5 about here
5.
Results for different immigrant subgroups
To test whether the results obtained above hold in different contexts, I repeat the estimations for selected immigrant subgroups. Specifically, I consider immigrants who arrived in Germany before vs. after 1973 (the time of the first oil price shock that marks the end of Germany’s active guest worker recruitment), as well as those entering Germany after the collapse of the Socialist Regime in Eastern Europe after 1989 (as they reflect the increasing share of immigrants from Eastern European countries, cf. Table 2). I also
15
Borjas argues that host countries are more attractive for highly skilled immigrants the higher the wage dispersion in the host country as compared to the home country. In Germany, the average wage premium for highly skilled immigrants with respect to their medium (low) skilled peers is 29 (37) percent.
15
separately look at immigrants aged 18 or older (as they were presumably not exposed to the German educational system). Detailed results are available from the author upon request.
Considering these subgroups, only small differences compared with the full sample are observable. Years since migration enter significantly in all cases, a result that holds also when skill groups are considered separately except for highly skilled immigrants. Similar results are valid for the experience interactions, where significant differences in the effect of work experience is found in all subgroups (although not in all skill groups therein). The general picture of flatter predicted experience earnings profiles for natives also holds for all subgroups. Only in isolated cases their profiles are steeper (low skilled individuals having arrived after 1989) or even flatter (immigrants having arrived in Germany at age 18 or above).
Since the distribution of immigrants and natives across industries differs, I also consider possible differences in the effects of ysm and experience by industries (cf. Table 1). The estimated coefficients of the ysm polynomial are jointly significant in manufacturing and construction. Significant differences immigrants and natives in the effect of experience are observed in manufacturing and in public administration and services. Even though the effect of ysm and additional work experience is not significant in all industries, the predicted experience earnings profiles confirm the general findings obtained before, especially the steeper experience earnings profiles for natives compared to immigrants at low values of experience. It is, however, noteworthy to mention that it is the industries with the greatest differences in terms the share of immigrants and natives working there that show significant differences in the estimated effects. In industries, where the share is relatively similar (cf. Table 1), the differences are generally insignificant. However, these industries also tend to be smaller, such that the lack of significance may simply be a result of a small number of observations in these industries.
16
6.
Conclusion
Several remarkable features in the economic assimilation process of immigrants in Germany can be observed based on the results from the analyses carried out in this work.
First, the time immigrants spend in their new host country does indeed have a significant and positive effect on their wages. This result confirms classic human capital theory which suggests that immigrants acquire host country-specific human capital over time. Taken by itself, the result of a – ceteris paribus – positive effect of years since migration on hourly wages might be considered as evidence for wage assimilation, i.e. a catching-up of immigrant earnings compared to natives. Second, compared to natives with the same observable work, regional, and family characteristics, immigrants earn on average lower hourly wages at all levels of experience. Especially for low values of work experience, natives receive higher returns for additional experience than immigrants. Even when the effects of experience and years since migration are combined, immigrants are only able to reach the wage level of natives in the low (and partly the medium) skill group. Third, it appears that for the high skilled, issues such as cumulative advantages of natives, along with possible discrimination with respect to employment opportunities and earnings (glass ceilings) may be of particular relevance as for immigrant in this skill group, the difference in the returns to additional work experience is the greatest. It remains for further research to quantify the precise extent to which early employment prospects affect immigrants’ labor market outcomes differently from those of natives.
Summarizing the above findings we see that except for the low skilled, immigrants in Germany do generally not seem to be able to catch up with comparable natives with respect to wages. Even when the returns to additional work experience are higher for immigrants (especially when combined with the positive effect of years since migration) than for natives
17
at high values of work experience, the initial divergence cannot be entirely overcome except in case of the low skilled immigrants. Especially for high skilled immigrants (i.e. those immigrants needed to close the employment gap in Germany’s knowledge society) the long term prospects are rather discouraging as the earnings gap between them and their native counterparts is not decreasing over the course of their professional careers – a fact that may repel potential immigrants when they look for a permanent new home and hope for full assimilation and immigration even given the fact that their appears to be sufficient dispersion in the returns to skills among immigrants.
If Germany is to adapt a policy of focusing on high skilled immigrants as currently discussed in the political debate, extensive efforts need to be made by politicians as well as employers in order not to discourage these highly skilled immigrants direly needed at the German labor market. Hence, anti discrimination and equal opportunity laws need to be further enforced and employers need to offer their employees full access to all positions within a firm eventually in order not to lose the “Battle for Brains”.
References
Adsera, Alicia and Barry R. Chiswick, 2007, Are there gender and country of origin differences in immigrant labor market outcomes across European destinations?, Journal of Population Economics, 20(3), 495-526.
Aldashev, Alisher, Gernandt, Johannes and Stephan L. Thomsen, 2009, Language usage, participation, employment and earnings: Evidence for foreigners in West Germany with multiple sources of selection, Labour Economics, 16(3), 330-341.
Arrow, Kenneth J., 1973, The Theory of Discrimination, in: O. Ashenfelter and A. Rees (eds.), 1973, Discrimination in Labor Markets, Princeton University Press, Princeton, 3-33.
18
Becker, Gary S., 1957, The economics of discrimination, 2nd Edition, University of Chicago Press, Chicago IL.
Becker, Gary S., 1975, Human Capital: A Theoretical and Empirical Analysis, with Special Reference to Education, 2nd Edition, Columbia University Press, New York.
Bertoli, Simone, Brücker, Herbert, Facchini, Giovanni, Mayda, Anna Maria, and Giovanni Peri, 2009, The Battle for Brains: How to Attract Talent, Report presented at the Fondazione Rodolfo de Benedetti, XI European Conference on “Brain drain and brain gain", Pisa.
Borjas, George J., 1985, Assimilation, Changes in Cohort Quality, and the Earnings of Immigrants, Journal of Labor Economics, 3(4), 463-489.
Borjas, George J., 1999, The Economic Analysis of Immigration, in: O. Ashenfelter and D. Card (eds.), 1999, Handbook of Labor Economics, Vol. 3A, Elsevier, Amsterdam, 1697-1760. Brekke, Idunn and Arne Mastekaasa, 2008, Highly educated immigrants in the Norwegian labour market: permanent disadvantage?, Work, employment and society, 22(3), 507-526. Chiswick, Barry R., 1978, The Effect of Americanization on the Earnings of Foreign-born Men, Journal of Political Economy, 86(5), 897-921.
Chiswick, Barry R. and Paul W. Miller, 2003, The complementary of language and other human capital: immigrant earnings in Canada, Economics of Education Review, 22(5), 469-480.
Constant, Amelie and Douglas S. Massey, 2003, Self-selection, earnings, and out-migration: A longitudinal study of immigrants to Germany, Journal of Population Economics, 16(4), 631-653.
Constant, Amelie and Douglas S. Massey, 2005, Labor Market Segmentation and the Earnings of German Guestworkers, Population Research and Policy Review, 24(5), 489-512. Cotter, David A., Hermsen, Joan M., Ovadia, Seth and Reeve Wanneman, 2001, The Glass Ceiling Effect, Social Forces, 80(2), 655-681.
Duleep, Harriet O. and Mark C. Regets, 1996, Earnings convergence: does it matter where immigrants come from or why?, Canadian Journal of Economics, 29(2), S130-S134.
Dustmann, Christian and Arthur van Soest, 2002, Language and the earnings of immigrants, Industrial and Labor Relations Review, 55(3), 473–492.
Haisken-DeNew, John P. and Joachim R. Frick (eds.), 2005, Desktop Companion to the German Socio-Economic Panel (SOEP), Berlin, DIW.
Heckman, James J. and Richard Robb, 1985, Using Longitudinal Data to Estimate Age, Period and Cohort Effects in Earnings Equations, in: William M. Mason and Stephen E. Fienberg (Eds.), 1985, Cohort Analysis in Social Research, Springer, New York, 137-150.
19
Kahanec, Martin and Klaus F. Zimmermann, 2010, High-Skilled Immigration Policy in Europe, IZA Discussion Paper No. 5399, Bonn, Germany.
Merton, Robert K., 1968, The Matthew Effect in Science, in: N.W. Storer (ed.), 1973, The Sociology of Science, University of Chicago Press, Chicago IL, 439-459.
Mincer, Jacob, 1974, Schooling, experiences, and earnings, National Bureau of Economic Research, New York.
Murphy, Kevin M. and Finis Welsh, 1990, Empirical Age-Earnings Profiles, Journal of Labor Economics, 8(2), 202-229.
OECD, 2010a, OECD Economic Outlook, 2010(2), Paris and Washington, D.C., Organisation for Economic Co-operation and Development.
OECD, 2010b, OECD International Migration Outlook: SOPEMI 2010, Paris and Washington, D.C., Organisation for Economic Co-operation and Development.
Pendakur, Krishna and Simon Woodcock, 2010, Glass Ceilings or Glass Doors? Wage Disparity Within and Between Firms, Journal of Business & Economic Statistics, 28(1), 181-189.
Pischke, Jorn-Steffen and Johannes Velling, 1997, Employment Effects of Immigration to Germany: An Analysis Based on Local Labor Markets, Review of Economics and Statistics, 79(4), 594-604.
Quillian, Lincoln, 2006, New Approaches to Understanding Racial Prejudice and Discrimination, Annual Review of Sociology, 32(1), 299-328.
Schmidt, Christoph M., 1997, Immigrant Performance in Germany: Labor Earnings of Ethnic German Migrants and Foreign Guest-Workers, Quarterly Review of Economics and Finance, 37(1) (Special Issue), 379-397.
Tomaskovic-Devey, Donald, Thomas, Melvin and Kecia Johnson, 2005, Race and the Accumulation of Human Capital Across the Career: A Theoretical Model and Fixed Effects Application, American Journal of Sociology, 111(1), 58-89.
Wagner, Gert G., Frick, Joachim R. and Jürgen Schupp, 2007, The German Socio-Economic Panel Study (SOEP) – Evolution, Scope and Enhancements, Schmollers Jahrbuch (Journal of Applied Social Science Studies), 127(1), 139-169.
Zeager, Lester A., 1999, Earnings Growth for Foreign Guest Workers and West Germans: Cross-Section and Panel Estimates, Vierteljahrshefte zur Wirtschaftsforschung, 68(2), 308-312.
Zimmermann, Klaus F. (ed.), 2005, European Migration: What Do We Know?, Oxford University Press, Oxford.
20
Tables
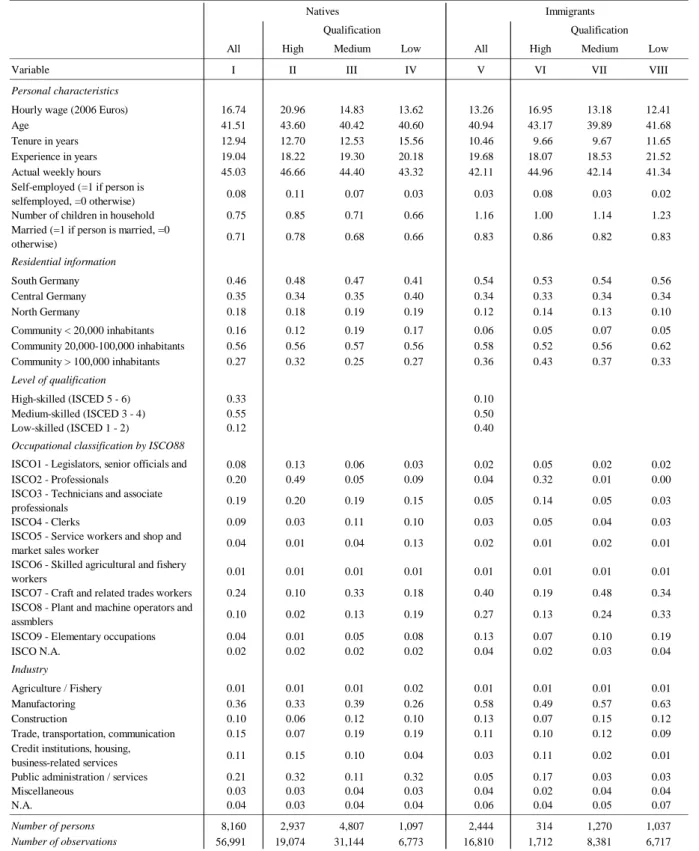
Table 1: Descriptive statistics – personal and residential background, occupations and industries, means
All High Medium Low All High Medium Low
Variable I II III IV V VI VII VIII
Personal characteristics
Hourly wage (2006 Euros) 16.74 20.96 14.83 13.62 13.26 16.95 13.18 12.41 Age 41.51 43.60 40.42 40.60 40.94 43.17 39.89 41.68 Tenure in years 12.94 12.70 12.53 15.56 10.46 9.66 9.67 11.65 Experience in years 19.04 18.22 19.30 20.18 19.68 18.07 18.53 21.52 Actual weekly hours 45.03 46.66 44.40 43.32 42.11 44.96 42.14 41.34 Self-employed (=1 if person is
selfemployed, =0 otherwise) 0.08 0.11 0.07 0.03 0.03 0.08 0.03 0.02 Number of children in household 0.75 0.85 0.71 0.66 1.16 1.00 1.14 1.23 Married (=1 if person is married, =0
otherwise) 0.71 0.78 0.68 0.66 0.83 0.86 0.82 0.83 Residential information South Germany 0.46 0.48 0.47 0.41 0.54 0.53 0.54 0.56 Central Germany 0.35 0.34 0.35 0.40 0.34 0.33 0.34 0.34 North Germany 0.18 0.18 0.19 0.19 0.12 0.14 0.13 0.10 Community < 20,000 inhabitants 0.16 0.12 0.19 0.17 0.06 0.05 0.07 0.05 Community 20,000-100,000 inhabitants 0.56 0.56 0.57 0.56 0.58 0.52 0.56 0.62 Community > 100,000 inhabitants 0.27 0.32 0.25 0.27 0.36 0.43 0.37 0.33 Level of qualification High-skilled (ISCED 5 - 6) 0.33 0.10 Medium-skilled (ISCED 3 - 4) 0.55 0.50 Low-skilled (ISCED 1 - 2) 0.12 0.40
Occupational classification by ISCO88
ISCO1 - Legislators, senior officials and 0.08 0.13 0.06 0.03 0.02 0.05 0.02 0.02 ISCO2 - Professionals 0.20 0.49 0.05 0.09 0.04 0.32 0.01 0.00 ISCO3 - Technicians and associate
professionals 0.19 0.20 0.19 0.15 0.05 0.14 0.05 0.03 ISCO4 - Clerks 0.09 0.03 0.11 0.10 0.03 0.05 0.04 0.03 ISCO5 - Service workers and shop and
market sales worker 0.04 0.01 0.04 0.13 0.02 0.01 0.02 0.01 ISCO6 - Skilled agricultural and fishery
workers 0.01 0.01 0.01 0.01 0.01 0.01 0.01 0.01 ISCO7 - Craft and related trades workers 0.24 0.10 0.33 0.18 0.40 0.19 0.48 0.34 ISCO8 - Plant and machine operators and
assmblers 0.10 0.02 0.13 0.19 0.27 0.13 0.24 0.33 ISCO9 - Elementary occupations 0.04 0.01 0.05 0.08 0.13 0.07 0.10 0.19 ISCO N.A. 0.02 0.02 0.02 0.02 0.04 0.02 0.03 0.04
Industry
Agriculture / Fishery 0.01 0.01 0.01 0.02 0.01 0.01 0.01 0.01 Manufactoring 0.36 0.33 0.39 0.26 0.58 0.49 0.57 0.63 Construction 0.10 0.06 0.12 0.10 0.13 0.07 0.15 0.12 Trade, transportation, communication 0.15 0.07 0.19 0.19 0.11 0.10 0.12 0.09 Credit institutions, housing,
business-related services 0.11 0.15 0.10 0.04 0.03 0.11 0.02 0.01 Public administration / services 0.21 0.32 0.11 0.32 0.05 0.17 0.03 0.03 Miscellaneous 0.03 0.03 0.04 0.03 0.04 0.02 0.04 0.04 N.A. 0.04 0.03 0.04 0.04 0.06 0.04 0.05 0.07 Number of persons 8,160 2,937 4,807 1,097 2,444 314 1,270 1,037 Number of observations 56,991 19,074 31,144 6,773 16,810 1,712 8,381 6,717 Natives Immigrants Qualification Qualification
21
Table 2: Descriptive statistics – immigrant background, means
All High Medium Low Immigrant-specific characteristics
Years since migration (YSM) 19.44 19.99 18.95 19.91 Immigration cohort pre 1973 0.57 0.37 0.51 0.71 1974 - 1988 0.25 0.31 0.26 0.21 1989 - 0.18 0.32 0.23 0.08 Age at migration 21.50 23.17 20.94 21.77 Language skills
Spoken German (very) good 0.49 0.48 0.53 0.44 Spoken German missing 0.15 0.37 0.19 0.05 Written German (very) good 0.29 0.42 0.33 0.20 Written German missing 0.15 0.37 0.19 0.05 German citizenship 0.22 0.50 0.30 0.07 Country of origin Turkey 0.28 0.15 0.25 0.35 Former Yugoslavia 0.15 0.09 0.18 0.14 Greece 0.09 0.07 0.06 0.14 Italy 0.16 0.04 0.13 0.22 Spain / Portugal 0.08 0.05 0.07 0.10 Other Western 0.04 0.13 0.04 0.01 Eastern European 0.14 0.29 0.20 0.03 Asia 0.05 0.08 0.07 0.02 Other 0.02 0.10 0.02 0.00 Number of persons 2,444 314 1,270 1,037 Number of observations 16,810 1,712 8,381 6,717 Qualification
22
Table 3: Estimation results, all skill groups
Coefficient Standard error Coefficient Standard error Experience/10 0.3277 *** (0.0192) -0.1033 *** (0.0342) Experience squared/100 -0.1143 *** (0.0106) 0.0368 ** (0.0174) Experience cubic/1000 0.0121 *** (0.0017) -0.0033 (0.0027) Immigrant-specific characteristics
Years since migration/10 0.0092 (0.0353)
Years since migration squared/100 0.0224 (0.0161)
Years since migration cubic/1000 -0.0042 * (0.0024)
Years since migration jointly† 6.39 ***
Observations 73,801
Persons 10,604
R² 0.4518 ***
Note: Dependent variable log real gross hourly wage. Regression controls for a third degree polynomial in tenure, marital status, self-employment, number of children in household, average yearly unemployment rate, occupations and industries, geographical and community background. For immigrants, controls for citizenship, arrival cohort, age at migration, country of origin, and language skills were included in addition to the ysm polynomial. Coefficients for immigrants refer to interactions with an immigrant dummy variable. Clustered standard errors (by person) in parentheses. ***/**/* refer to statistical significance at the 1%/5%/10% level. See Appendix Table A2 for details.
†: Value of the F-statistic. ***/**/* refer to statistical significance at the 1%/5%/10% level. Source: Own calculations based on GSOEP, years 1984-2009.
23
Table 4: Estimation results by skill group
High skilled Medium skilled Low skilled
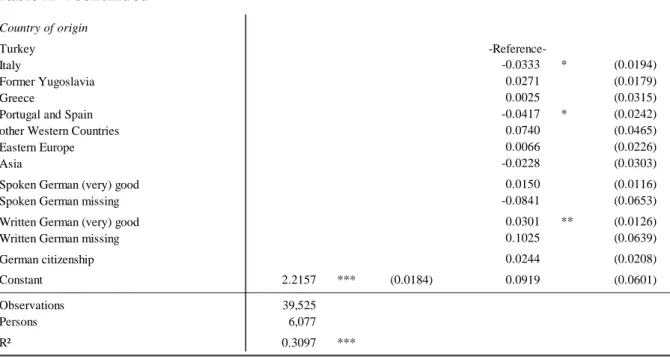
Natives Experience/10 0.4519 *** 0.2981 *** 0.2523 *** (0.0392) (0.0242) (0.0479) Experience squared/100 -0.1582 *** -0.1086 *** -0.0738 *** (0.0217) (0.0136) (0.0252) Experience cubic/1000 0.0176 *** 0.0119 *** 0.0059 (0.0035) (0.0022) (0.0038) Immigrant interactions Experience/10 -0.1831 * -0.1013 ** -0.0213 (0.1029) (0.0459) (0.0643) Experience squared/100 0.0686 0.0498 ** -0.0054 (0.0547) (0.0237) (0.0320) Experience cubic/1000 -0.0089 -0.0064 * 0.0036 (0.0087) (0.0037) (0.0047) Years since migration/10 0.0897 -0.0338 -0.0106 (0.0932) (0.0538) (0.0642) Years since migration squared/100 -0.0087 0.0473 * 0.0307 (0.0444) (0.0264) (0.0295) Years since migration cubic/1000 0.0019 -0.0092 ** -0.0053 (0.0061) (0.0041) (0.0042) Years since migration jointly† 1.60 3.72 ** 3.03 ** Observations 20,786 39,525 13,490 Persons 3,251 6,077 2,134 R² 0.3679 *** 0.3097 *** 0.3572 *** Note: Dependent variable log real gross hourly wage. Regression controls for a third degree polynomial in tenure, marital status, self-employment, number of children in household, average yearly unemployment rate, occupations and industries, geographical and community background. For immigrants, controls for citizenship, arrival cohort, age at migration, country of origin, and language skills were included in addition to the ysm polynomial. Coefficients for immigrants refer to interactions with an immigrant dummy variable. Clustered standard errors (by person) in parentheses. ***/**/* refer to statistical significance at the 1%/5%/10% level. See Appendix Tables A3-A5 for details.
†: Value of the F-statistic. ***/**/* refer to statistical significance at the 1%/5%/10% level. Source: Own calculations based on GSOEP, years 1984-2009.
24
Figures
Figure 1: Marginal effect of years since migration, all immigrants
Note: Ceteris paribus effect of ysm on log hourly wages, based on Table 3. Source: Own calculations based on GSOEP, years 1984-2009.
Figure 2: Predicted experience earnings profiles, all skill groups
Note: Personal characteristics for immigrants and natives were set to their respective means. “Immigrants+ysm” refers to the predicted log hourly wage of immigrants for whom experience and ysm go hand in hand, i.e. all experience is acquired in Germany as soon as the immigrant arrives. The shaded areas represent 95% confidence intervals.
Source: Own calculations based on GSOEP, years 1984-2009.
-. 2 0 .2 .4 .6 .8 1 P e rc en ta g e c h an g e i n ho u rl y w a g e s 0 5 10 15 20 25 30 35 40
Years since migration
2 2. 2 2. 4 2. 6 2. 8 3 3. 2 lo g ho ur ly w a g e 0 5 10 15 20 25 30 35 40
Years of experience (+ysm) Natives
25
Figure 3: Marginal effect of experience and experience + ysm, all skill groups
Source: Own calculations based on GSOEP, years 1984-2009. Results based on Table 3.
Figure 4: Marginal effect of years since migration for high, medium, and low skilled immigrants
Note: Ceteris paribus effect of ysm on log hourly wages, based on Table 4. Source: Own calculations based on GSOEP, years 1984-2009.
-1 -. 5 0 .5 1 1. 5 2 2. 5 3 3. 5 P e rc en ta ge c h an ge i n ho u rl y w a g e s 0 5 10 15 20 25 30 35 40
Years of experience (+ ysm)
Natives Immigrants Immigrants + ysm -1 -. 8 -. 6 -. 4 -.2 0 .2 .4 .6 .8 1 Pe rc en ta g e c h an g e i n ho u rl y w a g e s 0 5 10 15 20 25 30 35 40
Years since migration
High skilled Medium skilled
26
Figure 5: Comparison of the predicted experience earnings profiles of high, medium, and low skilled immigrants
Note: Values of the explanatory variables for high, medium, and low skilled immigrants are set to their respective means. Ysm is held constant. See Tables A2-A4 for details. The shaded areas represent 95% confidence intervals.
Source: Own calculations based on GSOEP, years 1984-2009.
2 2. 2 2. 4 2. 6 2. 8 3 lo g ho ur ly w a g e 0 5 10 15 20 25 30 35 40 Years of experience High skilled
27
Appendix
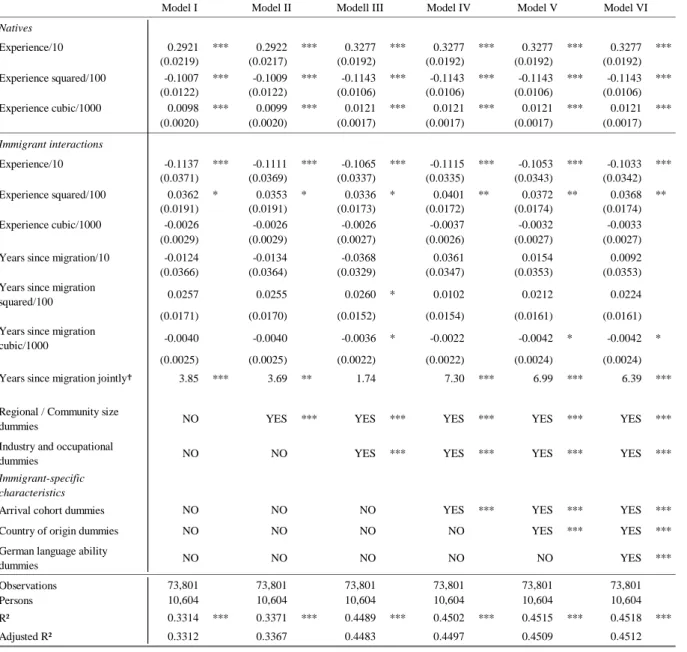
Table A 1: Model comparison, alternative specifications
Model I Model II Modell III Model IV Model V Model VI
Natives Experience/10 0.2921 *** 0.2922 *** 0.3277 *** 0.3277 *** 0.3277 *** 0.3277 *** (0.0219) (0.0217) (0.0192) (0.0192) (0.0192) (0.0192) Experience squared/100 -0.1007 *** -0.1009 *** -0.1143 *** -0.1143 *** -0.1143 *** -0.1143 *** (0.0122) (0.0122) (0.0106) (0.0106) (0.0106) (0.0106) Experience cubic/1000 0.0098 *** 0.0099 *** 0.0121 *** 0.0121 *** 0.0121 *** 0.0121 *** (0.0020) (0.0020) (0.0017) (0.0017) (0.0017) (0.0017) Immigrant interactions Experience/10 -0.1137 *** -0.1111 *** -0.1065 *** -0.1115 *** -0.1053 *** -0.1033 *** (0.0371) (0.0369) (0.0337) (0.0335) (0.0343) (0.0342) Experience squared/100 0.0362 * 0.0353 * 0.0336 * 0.0401 ** 0.0372 ** 0.0368 ** (0.0191) (0.0191) (0.0173) (0.0172) (0.0174) (0.0174) Experience cubic/1000 -0.0026 -0.0026 -0.0026 -0.0037 -0.0032 -0.0033 (0.0029) (0.0029) (0.0027) (0.0026) (0.0027) (0.0027) Years since migration/10 -0.0124 -0.0134 -0.0368 0.0361 0.0154 0.0092 (0.0366) (0.0364) (0.0329) (0.0347) (0.0353) (0.0353) Years since migration
squared/100 0.0257 0.0255 0.0260 * 0.0102 0.0212 0.0224 (0.0171) (0.0170) (0.0152) (0.0154) (0.0161) (0.0161) Years since migration
cubic/1000 -0.0040 -0.0040 -0.0036 * -0.0022 -0.0042 * -0.0042 * (0.0025) (0.0025) (0.0022) (0.0022) (0.0024) (0.0024) Years since migration jointly† 3.85 *** 3.69 ** 1.74 7.30 *** 6.99 *** 6.39 ***
Regional / Community size
dummies NO YES *** YES *** YES *** YES *** YES *** Industry and occupational
dummies NO NO YES *** YES *** YES *** YES ***
Immigrant-specific characteristics
Arrival cohort dummies NO NO NO YES *** YES *** YES *** Country of origin dummies NO NO NO NO YES *** YES *** German language ability
dummies NO NO NO NO NO YES ***
Observations 73,801 73,801 73,801 73,801 73,801 73,801 Persons 10,604 10,604 10,604 10,604 10,604 10,604 R² 0.3314 *** 0.3371 *** 0.4489 *** 0.4502 *** 0.4515 *** 0.4518 *** Adjusted R² 0.3312 0.3367 0.4483 0.4497 0.4509 0.4512 Note: Dependent variable log real gross hourly wage. Regression controls for a third degree polynomial in tenure, marital status, self-employment, number of children in household, and average yearly unemployment rate. For immigrants, controls for citizenship and age at migration were added in addition to the ysm polynomial. Coefficients for immigrants refer to interactions with an immigrant dummy variable. Clustered standard errors (by person) in parentheses. ***/**/* refer to statistical significance at the 1%/5%/10% level.
†: Value of the F-statistic. ***/**/* refer to statistical significance at the 1%/5%/10% level. Source: Own calculations based on GSOEP, years 1984-2009.
28
Table A 2: Full OLS estimation results, all skill groups
Coefficient Standard error Coefficient Standard error Personal characteristics Experience/10 0.0328 *** (0.0019) -0.0103 *** (0.0034) Experience squared/100 -0.0011 *** (0.0001) 0.0004 ** (0.0002) Experience cubic/1000 0.0000 *** (0.0000) 0.0000 (0.0000) Tenure/10 0.0177 *** (0.0016) 0.0073 ** (0.0030) Tenure squared/100 -0.0006 *** (0.0001) -0.0006 *** (0.0002) Tenure cubic/1000 0.0000 *** (0.0000) 0.0000 *** (0.0000)
Self-employed (=1 if person is self-employed,
=0 otherwise) -0.0471 *** (0.0163) -0.0054 (0.0130)
Married (=1 if person is married, =0 otherwise) 0.0406 *** (0.0069) 0.0730 * (0.0391)
Number of children in household 0.0120 *** (0.0031) -0.0060 (0.0045)
average yearly unemployment rate 0.0049 *** (0.0011) -0.0124 *** (0.0021) Residence-Dummies
South Germany 0.0130 * (0.0067) 0.0041 (0.0112)
Central Germany -Reference-
-Reference-North Germany -0.0180 ** (0.0086) 0.0143 (0.0174)
Community < 20,000 inhabitants -0.0273 *** (0.0080) 0.0295 (0.0192)
Community 20,000-100,000 inhabitants -Reference-
-Reference-Community > 100,000 inhabitants 0.0181 *** (0.0069) 0.0048 (0.0109)
Qualification level
High-skilled (ISCED 5 - 6) 0.1651 *** (0.0086) -0.0642 *** (0.0205)
Medium-skilled (ISCED 3 - 4) -Reference-
-Reference-Low-skilled (ISCED 1 - 2) -0.0532 *** (0.0082) 0.0190 (0.0118)
Occupation
ISCO1 - Legislators, senior officials and
managers 0.2785 *** (0.0131) -0.2361 *** (0.0396)
ISCO2 - Professionals 0.3222 *** (0.0106) -0.0474 (0.0296)
ISCO3 - Technicians and associate professionals 0.1727 *** (0.0091) -0.0852 *** (0.0202)
ISCO4 - Clerks 0.0861 *** (0.0119) -0.1033 *** (0.0252)
ISCO5 - Service workers and shop and market
sales worker -0.0281 ** (0.0140) -0.1446 *** (0.0410)
ISCO6 - Skilled agricultural and fishery workers -0.0680 * (0.0376) 0.0640 (0.0653) ISCO7 - Craft and related trades workers -Reference-
-Reference-ISCO8 - Plant and machine operators and
assmblers -0.0443 *** (0.0100) 0.0113 (0.0133)
ISCO9 - Elementary occupations -0.0685 *** (0.0126) -0.0084 (0.0162)
ISCO N.A. 0.0869 *** (0.0162) -0.1148 *** (0.0231)
Industry
Manufactoring -Reference-
-Reference-Agriculture / Fishery -0.2805 *** (0.0272) 0.1074 ** (0.0498)
Construction -0.0728 *** (0.0090) 0.0172 (0.0133)
Trade, transportation, communication -0.1485 *** (0.0091) 0.0454 *** (0.0158) Credit institutions, housing,
business-related services 0.0682 *** (0.0111) -0.0663 ** (0.0288)
Public administration / services -0.1331 *** (0.0082) 0.0551 *** (0.0212)
Miscellaneous -0.0734 *** (0.0175) -0.0531 * (0.0319)
N.A. -0.1176 *** (0.0135) 0.0770 *** (0.0184)
Immigrant-specific characteristics
Years since migration/10 0.0009 (0.0035)
Years since migration squared/100 0.0002 (0.0002)
Years since migration cubic/1000 0.0000 * (0.0000)
Age at migration -0.0047 *** (0.0009)
29
Table A 2 continued
Table A 3: Full estimation results, high skilled
Immigration cohorts
1973 and before
-Reference-1974-1988 0.0610 *** (0.0122) 1989 and after 0.1174 *** (0.0181) Country of origin Turkey -Reference-Italy -0.0346 *** (0.0131) Former Yugoslavia 0.0206 (0.0134) Greece 0.0071 (0.0178)
Portugal and Spain -0.0040 (0.0158)
other Western Countries 0.1142 *** (0.0346)
Eastern Europe 0.0054 (0.0196)
Asia -0.0445 * (0.0242)
Spoken German (very) good 0.0146 * (0.0078)
Spoken German missing -0.0095 (0.0380)
Written German (very) good 0.0290 *** (0.0091)
Written German missing 0.0277 (0.0368)
German citizenship 0.0092 (0.0171)
Constant 2.1875 *** (0.0143) 0.0809 * (0.0433)
Observations 73,801
Persons 10,604
R² 0.4518 ***
Note: Dependent variable log real gross hourly wage. Coefficients for immigrants refer to interactions with an immigrant indicator variable. Clustered standard errors (by person) in parentheses. ***/**/* refer to statistical significance at the 1%/5%/10% level. Source: Own calculations based on GSOEP, years 1984-2009.
Coefficient Standard error Coefficient Standard error Personal characteristics Experience/10 0.4519 *** (0.0392) -0.1831 * (0.1029) Experience squared/100 -0.1582 *** (0.0217) 0.0686 (0.0547) Experience cubic/1000 0.0176 *** (0.0035) -0.0089 (0.0087) Tenure/10 0.1529 *** (0.0294) -0.0446 (0.0806) Tenure squared/100 -0.0565 *** (0.0186) -0.0031 (0.0561) Tenure cubic/1000 0.0069 ** (0.0033) 0.0026 (0.0100)
Self-employed (=1 if person is self-employed,
=0 otherwise) -0.0641 *** (0.0249) -0.0191 (0.0363)
Married (=1 if person is married, =0 otherwise) 0.0464 *** (0.0134) 0.0209 (0.0509)
Number of children in household 0.0192 *** (0.0053) -0.0137 (0.0117)
average yearly unemployment rate 0.0056 *** (0.0020) -0.0052 (0.0063)
Residence-Dummies
South Germany 0.0089 (0.0115) 0.0540 * (0.0326)
Central Germany -Reference-
-Reference-North Germany -0.0226 (0.0155) 0.0279 (0.0441)
Community < 20,000 inhabitants -0.0297 ** (0.0148) -0.0660 (0.0504)
Community 20,000-100,000 inhabitants -Reference-
-Reference-Community > 100,000 inhabitants 0.0190 * (0.0114) -0.0116 (0.0276)
30
Table A 3 continued
Occupation
ISCO1 - Legislators, senior officials and
managers 0.4170 *** (0.0226) -0.1226 ** (0.0487)
ISCO2 - Professionals 0.4510 *** (0.0183) -0.0792 (0.0483)
ISCO3 - Technicians and associate professionals 0.2730 *** (0.0200) -0.0541 (0.0520)
ISCO4 - Clerks 0.2421 *** (0.0312) -0.2048 *** (0.0775)
ISCO5 - Service workers and shop and market
sales worker -0.0295 (0.0513) -0.0519 (0.0858)
ISCO6 - Skilled agricultural and fishery workers 0.0738 (0.0812) 0.5240 *** (0.1292) ISCO7 - Craft and related trades workers -Reference-
-Reference-ISCO8 - Plant and machine operators and
assmblers 0.0178 (0.0513) -0.0281 (0.0657)
ISCO9 - Elementary occupations 0.0090 (0.0619) -0.0495 (0.0742)
ISCO N.A. 0.3070 *** (0.0382) -0.1351 (0.0923)
Industry
Manufactoring -Reference-
-Reference-Agriculture / Fishery -0.2786 *** (0.0613) -0.1891 ** (0.0964)
Construction -0.0960 *** (0.0213) -0.0150 (0.0449)
Trade, transportation, communication -0.1268 *** (0.0218) -0.0067 (0.0448) Credit institutions, housing,
business-related services 0.0523 *** (0.0168) -0.0390 (0.0508)
Public administration / services -0.1753 *** (0.0126) 0.0702 * (0.0412)
Miscellaneous -0.0366 (0.0310) -0.1156 (0.0960)
N.A. -0.1120 *** (0.0294) 0.1402 ** (0.0672)
Immigrant-specific characteristics
Years since migration/10 0.0897 (0.0932)
Years since migration squared/100 -0.0087 (0.0444)
Years since migration cubic/1000 0.0019 (0.0061)
Age at migration -0.0030 (0.0038)
Immigration cohorts
1973 and before
-Reference-1974-1988 0.0999 ** (0.0441) 1989 and after 0.1651 *** (0.0576) Country of origin Turkey -Reference-Italy 0.0731 (0.0693) Former Yugoslavia 0.0342 (0.0519) Greece 0.0387 (0.0890)
Portugal and Spain 0.0258 (0.0551)
other Western Countries 0.1632 *** (0.0579)
Eastern Europe 0.0606 (0.0431)
Asia -0.0404 (0.0487)
Spoken German (very) good 0.0510 (0.0344)
Spoken German missing 0.0879 ** (0.0375)
Written German (very) good 0.0881 *** (0.0343)
German citizenship -0.0498 ** (0.0338)
Constant 2.1754 *** (0.0313) -0.1286 (0.1397)
Observations 20,786
Persons 3,251
R² 0.3679 ***
Note: Dependent variable log real gross hourly wage. Coefficients for immigrants refer to interactions with an immigrant indicator variable. Clustered standard errors (by person) in parentheses. ***/**/* refer to statistical significance at the 1%/5%/10% level. Source: Own calculations based on GSOEP, years 1984-2009.
31
Table A 4: Full estimation results, medium skilled
Coefficient Standard error Coefficient Standard error Personal characteristics Experience/10 0.2981 *** (0.0242) -0.1013 ** (0.0459) Experience squared/100 -0.1086 *** (0.0136) 0.0498 ** (0.0237) Experience cubic/1000 0.0119 *** (0.0022) -0.0064 * (0.0037) Tenure/10 0.1702 *** (0.0205) 0.1295 *** (0.0395) Tenure squared/100 -0.0399 *** (0.0135) -0.1198 *** (0.0293) Tenure cubic/1000 0.0035 (0.0024) 0.0269 *** (0.0060)
Self-employed (=1 if person is self-employed,
=0 otherwise) 0.0017 (0.0228) 0.0040 (0.0182)
Married (=1 if person is married, =0 otherwise) 0.0416 *** (0.0088) 0.0876 (0.0597)
Number of children in household 0.0045 (0.0041) -0.0021 (0.0063)
average yearly unemployment rate 0.0054 *** (0.0014) -0.0109 *** (0.0028) Residence-Dummies
South Germany 0.0123 (0.0091) 0.0002 (0.0157)
Central Germany -Reference-
-Reference-North Germany -0.0193 * (0.0113) 0.0048 (0.0229)
Community < 20,000 inhabitants -0.0157 (0.0101) 0.0147 (0.0243)
Community 20,000-100,000 inhabitants -Reference-
-Reference-Community > 100,000 inhabitants 0.0260 *** (0.0096) -0.0102 (0.0148) Occupation
ISCO1 - Legislators, senior officials and
managers 0.2112 *** (0.0186) -0.2244 *** (0.0623)
ISCO2 - Professionals 0.2583 *** (0.0198) -0.1534 ** (0.0781)
ISCO3 - Technicians and associate professionals 0.1517 *** (0.0111) -0.1051 *** (0.0245)
ISCO4 - Clerks 0.0699 *** (0.0145) -0.0758 ** (0.0310)
ISCO5 - Service workers and shop and market
sales worker -0.0812 *** (0.0178) -0.0077 (0.0490)
ISCO6 - Skilled agricultural and fishery workers -0.1066 ** (0.0466) -0.0039 (0.0669) ISCO7 - Craft and related trades workers -Reference-
-Reference-ISCO8 - Plant and machine operators and
assmblers -0.0524 *** (0.0112) 0.0090 (0.0166)
ISCO9 - Elementary occupations -0.0689 *** (0.0145) -0.0341 (0.0218)
ISCO N.A. 0.0403 ** (0.0199) -0.0940 *** (0.0287)
Industry
Manufactoring -Reference-
-Reference-Agriculture / Fishery -0.2807 *** (0.0381) 0.1410 *** (0.0499)
Construction -0.0722 *** (0.0105) 0.0083 (0.0164)
Trade, transportation, communication -0.1410 *** (0.0110) 0.0197 (0.0201) Credit institutions, housing,
business-related services 0.0734 *** (0.0157) -0.0410 (0.0441)
Public administration / services -0.1119 *** (0.0115) 0.0554 * (0.0302)
Miscellaneous -0.0825 *** (0.0208) -0.1017 ** (0.0401)
N.A. -0.1229 *** (0.0173) 0.0836 *** (0.0244)
Immigrant-specific characteristics
Years since migration/10 -0.0338 (0.0538)
Years since migration squared/100 0.0473 * (0.0264)
Years since migration cubic/1000 -0.0092 ** (0.0041)
Age at migration -0.0057 *** (0.0014)
Immigration cohorts
1973 and before
-Reference-1974-1988 0.0571 *** (0.0169)
1989 and after 0.0957 *** (0.0225)
32
Table A 4 continued
Table A 5: Full estimation results, low skilled
Country of origin
Turkey
-Reference-Italy -0.0333 * (0.0194)
Former Yugoslavia 0.0271 (0.0179)
Greece 0.0025 (0.0315)
Portugal and Spain -0.0417 * (0.0242)
other Western Countries 0.0740 (0.0465)
Eastern Europe 0.0066 (0.0226)
Asia -0.0228 (0.0303)
Spoken German (very) good 0.0150 (0.0116)
Spoken German missing -0.0841 (0.0653)
Written German (very) good 0.0301 ** (0.0126)
Written German missing 0.1025 (0.0639)
German citizenship 0.0244 (0.0208)
Constant 2.2157 *** (0.0184) 0.0919 (0.0601)
Observations 39,525
Persons 6,077
R² 0.3097 ***
Note: Dependent variable log real gross hourly wage. Coefficients for immigrants refer to interactions with an immigrant indicator variable. Clustered standard errors (by person) in parentheses. ***/**/* refer to statistical significance at the 1%/5%/10% level. Source: Own calculations based on GSOEP, years 1984-2009.
Coefficient Standard error Coefficient Standard error Personal characteristics Experience/10 0.2523 *** (0.0479) -0.0213 (0.0643) Experience squared/100 -0.0738 *** (0.0252) -0.0054 (0.0320) Experience cubic/1000 0.0059 (0.0038) 0.0036 (0.0047) Tenure/10 0.1468 *** (0.0399) 0.1173 ** (0.0551) Tenure squared/100 -0.0526 ** (0.0223) -0.0855 ** (0.0353) Tenure cubic/1000 0.0091 *** (0.0035) 0.0147 ** (0.0066)
Self-employed (=1 if person is self-employed,
=0 otherwise) -0.1083 * (0.0558) -0.0039 (0.0216)
Married (=1 if person is married, =0 otherwise) 0.0320 ** (0.0163) 0.2230 *** (0.0860)
Number of children in household 0.0148 ** (0.0075) -0.0067 (0.0087)
average yearly unemployment rate 0.0015 (0.0029) -0.0130 *** (0.0040)
Residence-Dummies
South Germany 0.0126 (0.0151) 0.0099 (0.0196)
Central Germany -Reference-
-Reference-North Germany -0.0092 (0.0188) 0.0330 (0.0287)
Community < 20,000 inhabitants -0.0630 *** (0.0175) 0.0980 *** (0.0338) Community 20,000-100,000 inhabitants -Reference-
-Reference-Community > 100,000 inhabitants -0.0180 (0.0157) 0.0520 *** (0.0199)