INVESTIGATION OF READING SKILL DEVELOPMENT OF
ENGLISH LANGUAGE LEARNERS: A TWO-YEAR LONGITUDINAL STUDY
by
BITNARA JASMINE PARK
A DISSERTATION
Presented to the Department of Educational Methodology, Policy, and Leadership and the Graduate School of the University of Oregon
in partial fulfillment of the requirements for the degree of
Doctor of Philosophy September 2015
ii
DISSERTATION APPROVAL PAGE Student: Bitnara Jasmine Park
Title: Investigation of Reading Skill Development of English Language Learners: A Two-Year Longitudinal Study
This dissertation has been accepted and approved in partial fulfillment of the requirements for the Doctor of Philosophy degree in the Department of Educational Methodology, Policy, and Leadership by:
Akihito Kamata Co-Chairperson Gina Biancarosa Co-Chairperson Gerald Tindal Core Member
Audrey Lucero Institutional Representative and
Scott L. Pratt Dean of the Graduate School
Original approval signatures are on file with the University of Oregon Graduate School. Degree awarded September 2015
iv
DISSERTATION ABSTRACT Bitnara Jasmine Park
Doctor of Philosophy
Department of Educational Methodology, Policy, and Leadership September 2015
Title: Investigation of Reading Skill Development of English Language Learners: A Two-Year Longitudinal Study
The reading achievement of approximately 12,250 third- and fourth-grade students, measured by multiple reading curriculum-based measures, was tracked for two school years and used for longitudinal growth analyses. The current study builds on prior research regarding the achievement gap between English language learners (ELLs) and non-ELLs in two major ways: (a) comparing literacy growth, as measured by multiple reading curriculum-based measures, of both ELLs and former ELLs with non-ELLs, and (b) investigating variability in literacy growth and reading profiles among ELLs, former ELLs, and non-ELLs. Results of this study suggested that reading development patterns were not homogeneous across ELLs, former ELLs, and non-ELLs. However, struggling readers demonstrated similar reading development profiles regardless of their English proficiency. The implications for instruction and future research are discussed.
CURRICULUM VITAE NAME OF AUTHOR: Bitnara Jasmine Park
GRADUATE AND UNDERGRADUATE SCHOOLS ATTENDED: University of Oregon, Eugene OR
DEGREES AWARDED:
Doctor of Philosophy, Educational Methodology, Policy, and Leadership, 2015, University of Oregon
Master of Arts, Linguistics, 2006, University of Oregon
Bachelor of Arts, International Studies, 2005, University of Oregon
AREAS OF SPECIAL INTEREST: Quantitative Methods English Language Learners Literacy Research
PROFESSIONAL EXPERIENCE:
Researcher, American Institutes for Research, 2014–Present
Research Assistant, Behavioral Research and Teaching (BRT), University of Oregon, 2008–2013
GRANTS, AWARDS, AND HONORS:
Boone Conference Travel Award, College of Education, University of Oregon, 2013
Graduate Student Travel Grant, Department of Educational Methodology, Policy, & Leadership, University of Oregon, 2010–2013
David Moursund Scholarship, College of Education, University of Oregon, 2010– 2011
vi PUBLICATIONS:
Baker, D. L, Biancarosa, G., Park, B. J., Bousselot, T., Smith, J., Baker, S. K., Kame'enui, E. J., Alonzo, J., & Tindal, G. (2015). Validity of CBM measures of oral reading fluency and reading comprehension on high-stakes reading assessments in grades 7 and 8. Reading and Writing: An Interdisciplinary Journal, 28, 57–104.
Nese, J. F. T., Park, B. J., Alonzo, J., & Tindal, G. (2011). Applied curriculum-based measurement as a predictor of high-stakes assessment: Implications for researchers and teachers. The Elementary School Journal, 111, 608–624.
ACKNOWLEDGMENTS
I could not have completed this dissertation without tremendous support from everyone I know. I wish to express sincere appreciation to my committee: Dr. Gina Biancarosa for her endless support and guidance in the preparation of this manuscript, Dr. Akihito Kamata for his scholarly advice and feedback, Dr. Gerald Tindal for his support and mentorship, and Dr. Audrey Lucero for her insightful questions and feedback. Special thanks to Dr. Julie Alonzo for guiding and helping me through the doctoral program for me to grow as a better educator and researcher, Dr. Jessica Saven for providing constructive feedback and endless emotional support, and Dr. Terry Salinger for providing endless support and having faith in me. I also thank my colleagues at Behavioral Research and Teaching for demonstrating inspiration, passion, and friendship. Lastly, I am grateful to have my parents, Adam, love of my life, family and friends who never stopped believing in me, loving me, and encouraging me.
viii
TABLE OF CONTENTS
Chapter Page
I. STATEMENT OF THE PROBLEM ... 1
Classification and Definition of English Language Learners ... 2
Demographic Shifts in the United States ... 5
Dramatic Demographic Shifts in Oregon ... 5
Achievement Gap between ELLs and Non-ELLs ... 6
Achievement Gap on the National Assessment of Educational Progress ... 7
Achievement Gap in the Development of Specific Reading Skills ... 8
Heterogeneity in Reading Performance Among ELLs ... 14
Limited Generalizability of Previous Findings ... 16
Definition of ELLs ... 16
Regional and Grade-Level Bias ... 17
Measuring Reading Skills Using a Single Indicator ... 18
Research Questions of the Current Study ... 22
II. METHODS... 23
Participants and Settings ... 23
English Language Learner (ELL) Status ... 27
Measures ... 29
easyCBM Passage Reading Fluency (ORF). ... 29
easyCBM Multiple Choice Reading Comprehension (RC). ... 31
easyCBM Vocabulary (VOC). ... 31
Data Analysis ... 34
Chapter Page
Analytic Approach and Procedure ... 34
Piecewise Growth Modeling ... 35
Latent Class Growth Analysis ... 41
Model Fit Evaluation and Determining the Number of Latent Classes ... 43
III. RESULTS ... 45
Growth Model Comparison ... 45
Growth Trajectories and ELL Status ... 49
Growth Trajectories of Non-ELLs ... 49
Growth Trajectories of ELLs ... 51
Growth Trajectories of Former ELLs ... 51
Comparison of Growth Parameter Correlations ... 52
Summary of Growth Trajectory Comparison Across ELL Status ... 53
Heterogeneity of Growth Trajectories ... 59
Unconditional LCGA ... 59
Proportions of Non-ELL, ELL, and Former ELL Students ... 60
Comparisons of Literacy Development Profiles by ELL Status Groups ... 69
Multiple-Group LCGA ... 69
Latent Class Membership Between LCGA and MG LCGA ... 71
LCGA by ELL Status... 72
IV. DISCUSSION ... 79
Comparison of Growth Trajectories ... 79
Literacy Achievement of Non-ELLs, ELLs, and Former ELLs ... 79
x
Chapter Page
Heterogeneity in Literacy Development ... 83
Literacy Development Profiles: Non-ELLs, ELLs, and Former ELLs ... 84
Limitations ... 86
Implications for Instruction... 89
Directions for Future Research ... 90
APPENDICES ... 93
A. PERCENTAGE OF NON-ELLS, ELLS, AND FORMER ELLS BY DISTRICT... 93
B. CORRELATION MATRIX OF MEASURES INCLUDED IN THE ANALYSIS ... 95
C. UNCONDITIONAL LCGA MODEL COMPARISON: GROWTH PARAMETERS ... 96
D. COVARIANCE MATRIX OF DATA COVERAGE ... 98
LIST OF FIGURES
Figure Page
1. Achievement gap between English Language Learners (ELLs) and non-ELLs on
the Main NAEP Reading Assessment... 10
2. Achievement gap between English Language Learners (ELLs) and non-ELLs on the NAEP Long-Term Trend Reading Assessment. ... 11
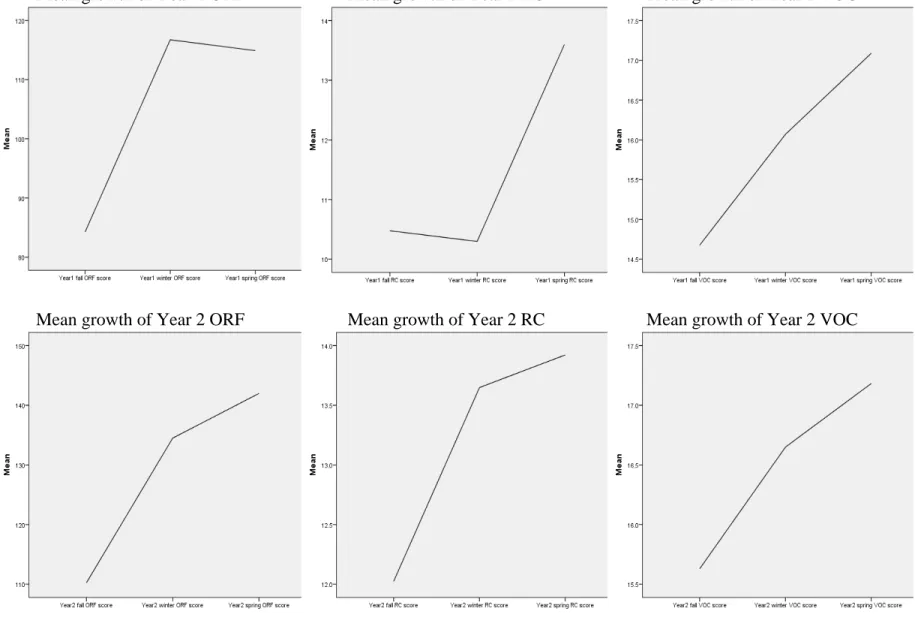
3. Mean growth patterns across the three easyCBM reading measures for all students. ... 37
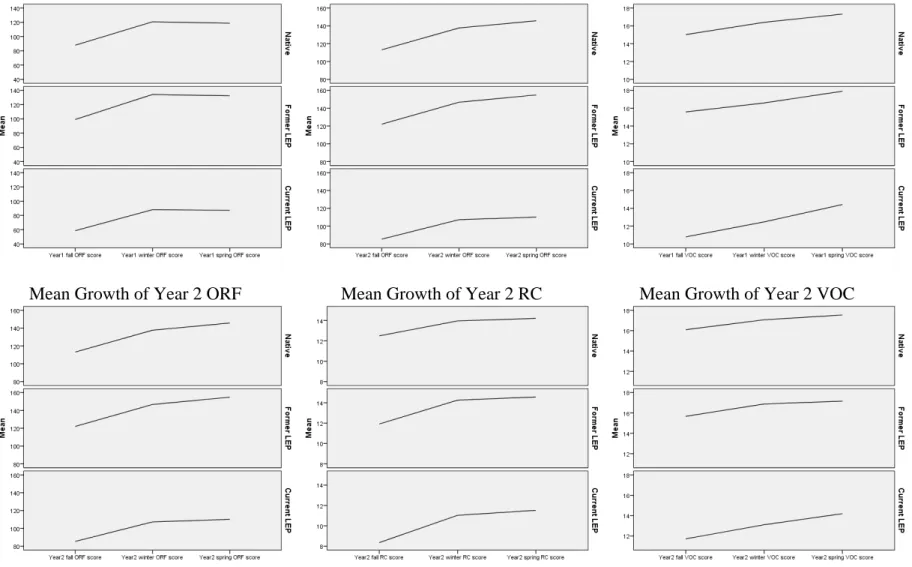
4. Mean growth patterns across the three easyCBM reading measures by ELL status. . 38
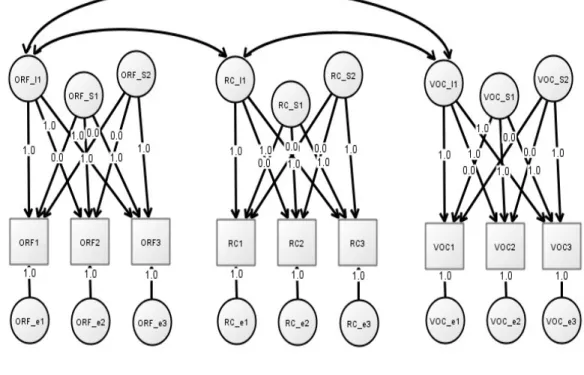
5. Unconditional piecewise growth model with factor loadings: Year 1 ... 39
6. Full unconditional piecewise growth model ... 40
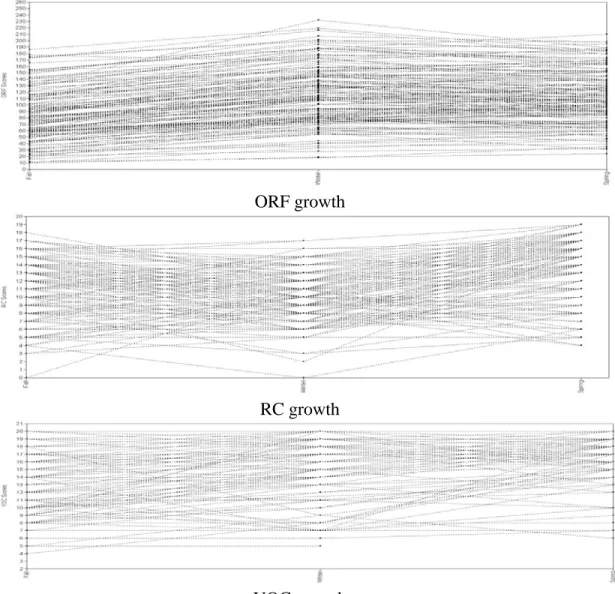
7. Display growth patterns of 150 randomly selected students: Year 1. ... 42
8. Comparisons of ORF growth trajectories. ... 54
9. Comparison of RC growth trajectories. ... 55
10. Comparison of VOC growth trajectories. ... 56
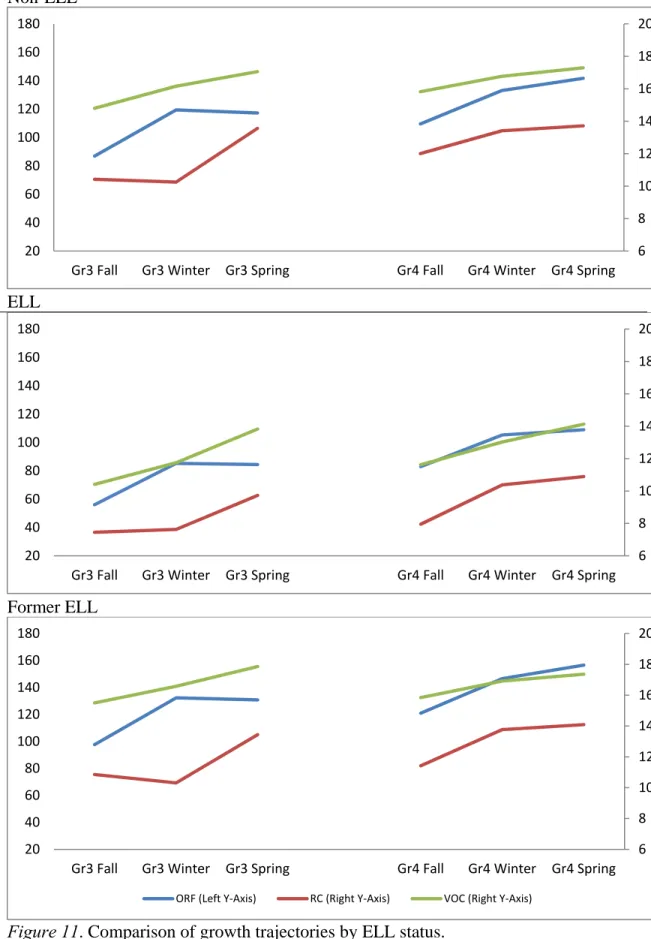
11. Comparison of growth trajectories by ELL status ... 58
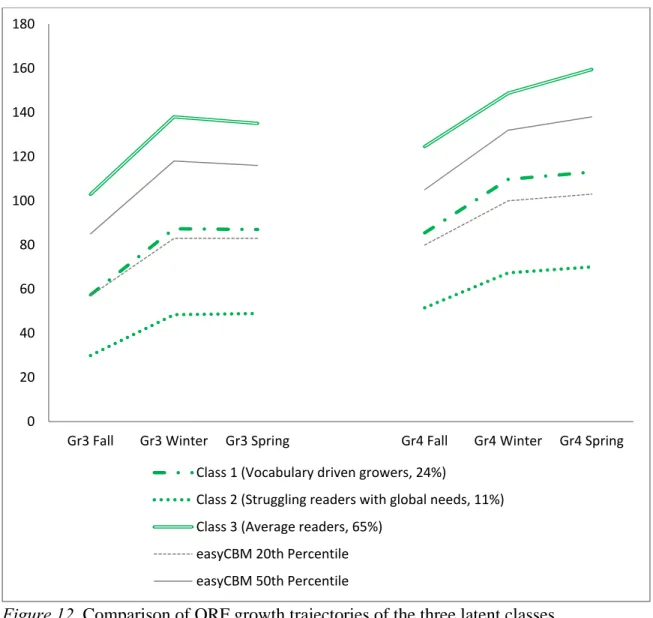
12. Comparison of ORF growth trajectories of the three latent classes. ... 63
13. Comparison of RC growth trajectories of the three latent classes. ... 64
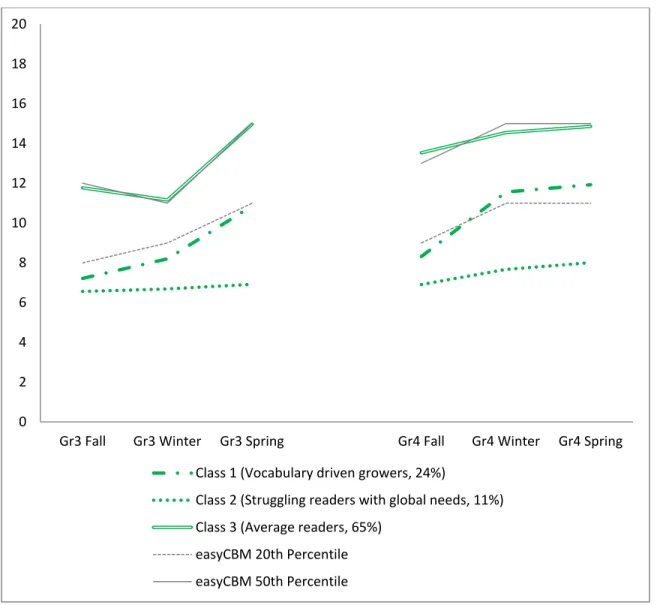
14. Comparison of VOC growth trajectories of the three latent classes. ... 65
15. Comparison of growth trajectories by latent class ... 66
16. Proportion of students in each latent class by ELL status. ... 67
17. Proportion of non-ELLs, ELLs, and former ELLs in each latent class. ... 68
18. Comparison of ORF growth trajectories between non-ELLs, ELLs, and former ELLs: Multiple-group LCGA ... 74
xii
Figure Page
19. Comparison of RC growth trajectories between non-ELLs, ELLs, and former ELLs: Multiple-group LCGA ... 75 20. Comparison of VOC growth trajectories between non-ELLs, ELLs, and former
LIST OF TABLES
Table Page
1. Definition of English Language Learner (ELL) Status Used in This Study ... 9
2. Review of Published Research on the Reading Performance of English Language Learners (ELLs) and/or Language Minority (LM) Students ... 20
3. Mean Comparisons Between Students With and Without English Language Learner (ELL) Status Indicator ... 24
4. Proportion of English Language Learners (ELLs) Between Students With and Without CBM Score ... 25
5. Description of Analytic Sample ... 26
6. The Number of Students in Each English Language Learner (ELL) Status Category ... 29
7. Descriptive Statistics for easyCBM Reading Measures Collected During the 2011–2013 School Years ... 33
8. Model Fit Comparison Between Three Growth Models... 47
9. Comparison of Estimated Growth Parameters Between Three Growth Models ... 48
10. Model Fit Information: Multiple Group Latent Piecewise Growth Analysis ... 50
11. Comparison of Estimated Growth Parameters Across Three English Language Learner (ELL) Status Groups ... 57
12. Fit Statistics for Latent Class Growth Analysis ... 59
13. Estimated Growth Parameters for Each of the Three Latent Classes ... 61
14. Defining Characteristics of Growth Trajectory for Each of the Three Latent Classes ... 62
15. Proportion of Non-ELLs, ELLs, and Former ELLs in LCGA Classes ... 67
16. Fit Statistics of Latent Class Growth Analysis ... 69
17. Comparison of Growth Trajectory by English Language Learner (ELL) Status for Each Latent Class (3-class model) ... 73
xiv
Table Page 18. Comparison Between Unconditional Latent Class Growth Analysis (LCGA) and
Multiple-Group (MG) LCGA for (a) Non-English Language Learners, (b) English Language Learners, and (c) Former English Language Learners ... 77
19. Fit Statistics for Latent Class Growth Analysis for (a) Non-English Language Learners, (b) English Language Learners, and (c) Former English Language
CHAPTER I
STATEMENT OF THE PROBLEM
The number of school-age children in the United States who speak a language other than English at home has rapidly increased over the last three decades (National Center for Education Statistics [NCES], 2011). Although there have been growing efforts to better understand the reading development of English language learners (ELLs) Al Otaiba, Petscher, Pappamihiel, Willilams, Dyrlund, & Connor, 2009; Betts, Bolt, Decker, Muyskens, & Marston, 2009; Chiappe, Siegel, & Gottardo, 2002; Chiappe, Siegel, & Wade-Wolley, 2002; Crosson & Lesaux, 2010; Geva & Zadeh, 2006; Gutiérrez & Vanderwood, 2013; Kieffer, 2008; Lesaux & Kieffer, 2010; Lesaux, Rupp, & Siegel, 2007), current findings are limited in two major ways: (a) studied samples tend to be limited and lack generalizability, and (b) normative growth expectations have not been established for ELLs in reading. As a result, providing timely, appropriate, and effective interventions to ELLs remains challenging for teachers (Guitérrez & Vanderwood, 2013; Lesaux et al., 2007; Quirk & Beem, 2012; Richards-Tutors, Solari, Leasfstedt, Gerber, Fillippini, & Aceves, 2013). The current study sets out to address these limitations and inform teacher decision-making.
To illustrate the extent to which these issues impact ELL education and frame the current study, the following topics are discussed in this chapter: (a) shifts in U.S.
demographics, (b) the achievement gap between ELLs and non-ELLs, (c) previous research on ELL reading development, and (d) limitations of previous ELL research.
2
Classification and Definition of English Language Learners
Although the term ELL is widely used across the country, how students are actually classified as ELL varies widely across states and districts (Abedi, 2004; Linquanti & Bailey, 2014). Abedi (2004) reported that states and districts often have different definitions of ELL and use various measures to classify students as ELLs. For example, the home language survey (HLS) is used by more than 80% of state education agencies (Kindler, 2002) to classify ELLs. The HLS, which may differ in terms of format and types of questions across states and districts, is administered to parents by schools to identify what language students primarily speak at home. Students whose primary home language is not English are generally classified as ELLs. However, research findings show that the HLS may not be a valid, reliable indicator of students’ English language proficiency, as parents may not give accurate information for various reasons including their concerns for opportunity equity, legal status issues, and/or their limited proficiency in English (Abedi, 2004; Linquanti & Bailey, 2014). As a result of these issues, one study found that home languages obtained from these surveys significantly varied from
students’ actual primary home languages and, moreover, did not reflect students’ English language proficiency (Kindler, 2002).
Another common method of identifying ELLs is to use either English proficiency tests, such as Language Assessment Scales (LAS) and the IDEA Language Proficiency Tests (IPT), or achievement tests such as the Stanford Achievement Test (SAT9) and the Iowa Tests of Basic Skills (ITBS). Although the use of assessment data is a more
objective method than the HLS to classify ELLs, it has its own set of concerns. One concern is that there are more than 20 different assessments used across state education
agencies (Kindler, 2002). It is highly likely that these assessments vary in terms of their framework or standards (Cook & Linquanti, 2015). In addition, the relationship between English language proficiency tests and actual student ELL classification was not strong (Abedi, 2004). Furthermore, evidence suggests that English language proficiency tests have a weak relation (r = 0.22) with students’ actual ELL classification (Abedi, 2004). These findings suggest inconsistency and unreliability in ELL classifications practice; this limits the generalizability of studies regarding ELL students’ academic performance.
Another challenge in ELL research is how to define the ELL population. It is common to group students on the basis of their primary home language. Students who primarily speak a language other than English at home are often referred to as Language Minority (LM) students (Kieffer, 2008; Lesaux & Kieffer, 2010). Another frequently used approach is to group students on the basis of their actual English proficiency. Students are often defined as ELL if they need additional support to gain full access to instruction in mainstream classes because of their limited English proficiency (Al Otaiba et al., 2009; Betts et al., 2009; Gutiérrez & Vanderwood, 2013). Although LM status is conceptualized as a fixed variable, meaning that it does not change over time, ELL status is considered changeable as students continue their academic careers.
Although the definition of ELL may not seem confusing, the real challenge is when these definitions are operationalized in various ways in research. For example, Kieffer (2008) classified students into three groups: language minority (LM) students (i.e., those who speak a language other than English at home) with limited English proficiency, LM without limited English proficiency, and native speakers of English. Lesaux and Kieffer (2010) classified students into two groups: LM (without considering
4
English proficiency levels) and native speakers of English (NS). National Assessment of Educational Progress (NAEP) defined ELLs as students who lack English proficiency and are in the process of acquiring English language skills and knowledge, which is similar to Kieffer’s (2008) LM students with limited English proficiency. Chiappe, Siegal, and Wade-Woolley (2002) and Lesaux et al. (2007) classified students into two groups: native speakers of English, and English as a Second Language (ESL) students, which included students who spoke a language other than English with their parents regardless of their English proficiency levels. In other words, ESL is used similarly to LM in Kieffer’s study (2008). Al Otaiba et al. (2009) classified students into three groups: (a) those who never needed additional ESL services, which may include NS and LM students without limited English proficiency; (b) those who were receiving ESL services at the time of the study, which include LM students with limited English proficiency; and (c) those who had already exited ESL services, which included LM students but represented a population different from LM students who never received ESL services. As the definition of ELL varies across studies, it is difficult to generalize findings from these studies to all ELL students.
Given the inconsistency of the ELL definitions used in the field, it seems necessary to provide a clear definition of how ELL is defined in this study to better support a synthesis of previous research. To represent a more complete spectrum of students’ English proficiency levels, three ELL statuses are utilized in this study: ELL, former ELL, and non-ELL. First, ELL is defined as students whose primary home language is not English and who are currently receiving additional academic support due to their limited English proficiency. Second, former ELL students are defined as those
whose primary home language is not English and who have ceased receiving additional academic support services related to their limited English proficiency. Third, non-ELL students are defined as (a) those whose native language is English or (b) those whose English proficiency is equivalent to native speakers of English regardless of their primary home language and who never received additional academic support related to limited English proficiency. Lastly, students are defined as Language Minority (LM) if they are classified based solely on their primary home language, without any indication of their English proficiency levels in the original research reports (see Table 1).
Demographic Shifts in the United States
During the last decade, the demographic characteristics of students enrolled in U.S. schools changed dramatically. Language minority (LM) students represent one of the fastest growing subgroups of students in U.S. schools (Abedi, 2004). According to the National Center for Education Statistics (NCES, 2012), the number of LM children increased from approximately 8.5 million to 11.2 million since the year 2000. As of 2011, approximately 10% of students enrolled in U.S. public schools were LM students who spoke a language other than English at home (NCES, 2012). Of these LM students, approximately 3 million students were ELLs receiving additional ESL services during the 2010–2011 school year (NCES, 2010–2011). This is approximately a 13% increase compared to the 1998–1999 school year (NCES, 1998-1999).
Dramatic Demographic Shifts in Oregon
While some states (e.g., California, Florida, Texas) have historically served a large number of LM students, other states (e.g., Colorado, North Carolina, Oregon, Utah) that historically had small LM populations have recently experienced unprecedented
6
shifts in student demographics (Aud, Wilkinson-Flicker, Kristapovich, Rathbun, Wang, & Zhang, 2013; Oregon Department of Education, 2011, November). By 2004–2005, approximately 61% of ELLs inhabited one of six states (Arizona, California, Florida, Illinois, New York, and Texas); however, in recent years the number of ELLs has rapidly increased in other states as well (Payán & Nettles, 2008).
Oregon, where students investigated in the current study attended school, has been experiencing an unprecedented demographic change. Whereas there were about 44,000 ELLs (i.e., those whose primary home language is not English and who receive ESL services) in Oregon schools 10 years ago, this number increased to more than 65,600 for the 2010–2011 school year. This was a 48% increase in the number of Oregon ELL students, and the number of ELL students continues to grow (Oregon Department of Education, 2011, November). In addition, 11.5% of all students enrolled in Oregon schools received ESL services in 2011. Given the increasing numbers of ELL students in states historically serving small numbers of ELLs, such as Oregon, it is important to focus on the academic performance of ELLs in these regions because there is very limited understanding of how ELLs in these regions perform academically.
Achievement Gap between ELLs and Non-ELLs
The proportion of ELL students participating in large-scale assessments such as the National Assessment of Educational Progress (NAEP) has increased alongside the growing numbers of ELL students in U.S. schools (Aud et al. 2011). In 2004,
approximately 76% to 78% of ELLs participated in the NAEP Long-Term Trend Reading Assessment (LTTRA). There was also an increase of approximately 5% to 7% in the number of ELLs tested in 2008 (Wilde, 2010). In addition, there have been growing
efforts to understand the academic performance of ELLs (Al Otaiba et al., 2009; Betts et al., 2009; Gutiérrez & Vanderwood, 2013; Kieffer & Lesaux, 2012; Lesaux, Lipka, & Siegel, 2006; Lesaux et al., 2007; Richards-Tutor et al., 2013) as well as to provide more effective instruction to ELLs (August, Estrada, & Boyle, 2012; Gersten, Baker,
Shanahan, Linan-Thompson, Collins, & Scarcella, 2007; Kieffer & Lesaux, 2012). Achievement gap on the National Assessment of Educational Progress. Although a growing body of research focuses on understanding the academic performance of ELLs, the achievement gap between ELLs and non-ELLs has not decreased. According to the 2013 main NAEP report, although 72% of third-grade non-ELL students were at or above the basic proficiency level in reading, only 31% of non-ELLs were at this level. The gap is larger for older students: 79% of eighth-grade non-ELLs students were at or above the basic proficiency level, yet only 30% of ELL students were at this level. When comparing the main NAEP reading assessment scores for 2003 and 2013, it is clear that the achievement gap between ELLs and non-ELLs has not narrowed. The average NAEP reading scores for fourth-grade ELLs were 186 and 187 in years 2003 and 2013, respectively, while the average scores for non-ELLs were 221 and 226 for the same years (see Figure 1; NCES, 2003–2013).
Such a gap is also observed on the NAEP Long-Term Trend Reading Assessment (LTTRA). The NAEP LTTRA scores reveal that the achievement gap between ELLs and non-ELLs is persistent over time. The gap in the NAEP reading tests between 9-year-old ELLs and non-ELLs in 2004 (average scale scores of 187 and 218, respectively) did not narrow in 2008 (when the average scale score was 193 for ELLs and 223 for non-ELLs),
8
nor in 2012 (when the average scale score was 191 for ELLs and 225 for non-ELLs) (see Figure 2; NCES, 2004–2012).
Achievement gap in the development of specific reading skills. Similar to trends on the national assessments, previous research findings also repeatedly
demonstrate the achievement gap between ELLs and non-ELLs across many domains of reading, including fluency and comprehension (August & Shanahan, 2006; Chiappe, Siegel, & Gottardo, 2002; Kieffer, 2008; Lesaux, 2006; Lesaux & Kieffer, 2010; Quirk & Beem, 2012). In the executive summary report of the National Literacy Panel on
Language-Minority Children and Youth, August and Shanahan (2006) concluded that although ELLs perform comparably to their non-ELL peers in word-level reading skills (i.e. decoding, word recognition, and spelling), performance of ELLs on text-level skills (i.e. reading comprehension and writing) is significantly lower than that of non-ELL students.
In a 5-year longitudinal study that took place in Canada, Lesaux, Rupp, and Siegel (2007) followed 135 language minority (LM) students and 689 non-LM students from kindergarten through fourth grade and assessed them on their word reading, spelling, phonological processing, syntactic awareness, working memory, and word reading and comprehension skills. In this study, the authors reported that although kindergarten LM students scored lower than non-LM students on early literacy measures, such a difference was no longer observed by the fourth grade. Also, word reading development patterns over time for both groups were both nonlinear and very similar to each other. In addition, the predictive validity of early literacy measures administered in kindergarten for the fourth-grade reading tests was similar for the two groups.
Table 1
Definition of English Language Learner (ELL) Status Used in This Study ELL Definition Primary Home Language ESL Services English Language Proficiency
Examples from Previous Research First Author (Year) Terms Used
ELL Not
English
Currently
receiving Limited
Al Otaiba et al. (2009) English as a second language (ESL) students Betts et al. (2009) ELL
Gutiérrez et al. ( 2013) English learners
NAEP (n.d.) LM with limited English proficiency Quirk et al. (2012)1 ELL
Former ELL Not English
Previously received
Not limited (proficient)
Al Otaiba et al. (2009) ESL-exited students Quirk et al. (2012)1 ELL reclassified Non-ELL Not English Never received Not limited (proficient)
Al Otaiba et al. (2009) Latino students
Kieffer (2008) LM with full English proficiency Non-ELL English Not
applicable
Not limited (proficient)
Chiappe, et al. (2002) native English speakers Kieffer (2008) native English speakers
Lesaux et al. (2007) native English-speaking children (L1) Lesaux et al. (2010) native English speakers
Language Minority (LM) Not English Includes all of the above Includes those with and without limited English proficiency
Chiappe, et al. (2002) English as a second language (ESL) students Lesaux et al. (2007) ELL
Lesaux et al ( 2010) LM
1 Approximately 86% of study participants were ELL and 14% were former ELL; however, the groups were combined for the analysis, and their achievement was not compared.
10
Figure 1. Achievement gap between English Language Learners (ELLs) and non-ELLs on the Main NAEP Reading Assessment.
Figure 2. Achievement gap between English Language Learners (ELLs) and non-ELLs on the NAEP Long-Term Trend Reading Assessment.
12
Other evidence suggests that a gap can be observed as early as kindergarten and first grade for basic literacy skills such as letter knowledge and phonological processing skills, as well as for word-level skills such as decoding (Al Otaiba et al., 2009; Baker, Baker, Katz, & Otterstedt, 2009; Chiappe, Siegel, & Wade-Woolley, 2002; Gutiérrez & Vanderwood, 2013). Chiappe, Siegel, and Wade-Wolley (2002) investigated the
development of early reading skills for 131 language minority (LM) students and 727 non-LMs in kindergarten and first grade; they reported that although LM students acquired basic literacy skills in a similar order and at a similar rate compared with their non-LM peers, LM students consistently scored lower than non-LMs on phonological and linguistic processing measures. Baker, Baker, Katz, and Otterstedt (2009) reported a similar finding, stating that although ELLs made consistent growth from the first grade to the third grade, the growth was not enough to close the gap between ELLs and non-ELLs on curriculum-based measurement (CBM) in reading, nor on standardized reading
assessments.
Although ELLs seem to develop basic literacy skills at a rate similar to their non-ELL peers, the discrepancy in reading skills between the two groups does not fade in upper grades. Kieffer (2008) compared growth in reading skills between ELLs (i.e., LM students with limited English proficiency), LM students without limited English
proficiency, and native English speakers from kindergarten to fifth grade using a national Early Childhood Longitudinal Study dataset. In this study, he reported that LM students entering kindergarten without limited English proficiency demonstrated similar growth trajectories as their native English-speaking peers, while ELLs exhibited a gap in
performance compared to their native English-speaking peers. Furthermore, the gap enlarged over time.
A study by Lesaux and Kieffer (2010) explored sources of reading difficulties for middle school students using latent class analysis; it examined whether the sources of such difficulties varied for LM and non-LM students. In the study findings, LM students on average scored lower than non-LM students on a battery of reading assessments; however, the sources of reading difficulties for all struggling readers, regardless of whether they were LM or non-LM, were similar. Moreover, all struggling readers exhibited very low vocabulary knowledge.
While these studies compared the growth of LM students (with and without limited English proficiency, depending on the studies) and non-LM students, other studies examined the reading development of ELLs and former ELLs. Al Otaiba et al. (2009) evaluated the growth of approximately 5,000 second- and third-grade students on oral reading fluency based on their English proficiency levels (ELLs, former ELLs, and non-ELLs who are LM). Non-ELL students demonstrated growth of 1.19 to 1.23 words per week for second and third grades, respectively, whereas researchers observed slower growth rates in former ELL students (0.93 to 1.08 words per week) and ELL students (0.75 to 1.10 words per week).
Gutiérrez and Vanderwood (2013) also compared growth in reading among second-grade ELLs based on their English proficiency level (i.e. beginning, early intermediate, intermediate, early advanced, and advanced). All ELLs demonstrated growth in reading, as measured by Dynamic Indicators of Basic Early Literacy Skills (DIBELS) reading measures (phoneme segmenting, nonsense words, and oral reading
14
fluency), regardless of initial English proficiency level. The only significant difference in growth rates among the five groups was between the beginning and advanced ELL groups. The advanced ELL group showed a much higher rate on ORF (1.13 words per week) than the beginning-level group (0.82 words per week).
Previous research on ORF growth for non-ELL students (i.e. native speakers of English) suggests that the expected weekly growth on ORF for third graders is
approximately one word per week (Christ, Silberglitt, Yeo, & Cormier, 2010; Fuchs, Fuchs, Hamlett, Walz, & Germann, 1993; Tindal, 2013). Based on the previous CBM research on ORF growth, it appears that the reading growth of ELLs is comparable to their non-ELL peers. However, it is important to note that (a) the achievement gap between ELLs and non-ELLs has been repeatedly observed, and (b) there is wide variation in reading development among ELLs depending on their English proficiency levels. As currently available research in this field is shallow and limited (Lesaux, 2006), more replication of previous research and investigation of ELL reading development should be conducted.
Heterogeneity in Reading Performance Among ELLs
Although most research on the ELL population has focused on investigating the achievement gap between ELLs and non-ELLs, a few studies compared reading
performance among ELLs. In addition to the comparison between language minority (LM) and non-LM students, Kieffer (2008) compared the reading growth trajectories among LM students, based on their English proficiency, from kindergarten to fifth grade using the large scale dataset (i.e. Early Childhood Longitudinal Study-Kindergarten Cohort; ECLS-K). In this study, he reported that all students demonstrated similar growth
on reading regardless of their English proficiency, but LM students with lower English proficiency scored significantly lower on reading tests compared to LM students with higher English proficiency. For example, LM students who became eligible to take the reading test sooner (e.g., in the spring of first grade) because of their improved English proficiency performed better than other LM students who became eligible to take the test later (e.g., in the spring of third grade).
Using the same dataset, Hafner, Ulanoff, and Schlackman (2008) compared the reading development profiles between non-ELLs and ELLs from kindergarten to fifth grade. Findings from the growth mixture modeling, a technique used to capture
unobserved clusters of students sharing similar growth trajectories, identified five distinct growth trajectories for the total sample, combining non-ELLs and ELLs. Three of the five groups exhibited low performance in kindergarten while the remaining two groups
exhibited high performance. Of the three low starting groups, the first group made gradual progress from kindergarten to fifth grade, while the second group made steady progress only until third grade. The third group made the steepest growth from
kindergarten to third grade among all five groups. Both high starting groups made gradual progress until first grade, demonstrating different growth patterns after first grade. One group slowed down in their reading growth after first grade, whereas the other group continued to grow steadily until fifth grade. When the same analysis was
conducted only with ELL students, researchers observed the same number of distinct growth trajectories, as was the case for the total sample analysis. However, the difference between the total sample and subsample (i.e. ELLs only) analysis is that two of the low starting groups caught up with the high starting group by the end of fifth grade.
16
These findings seem to suggest that reading development patterns are
heterogeneous even among ELLs. If the reading growth trajectories among ELLs vary significantly, instructional support designated for ELLs may need to differ to meet the needs of ELLs depending on their growth trajectories. Given the limited amount of research regarding this matter, replication should be conducted to explore the heterogeneity in reading development among ELLs.
Limited Generalizability of Previous Findings
Although efforts to better understand the reading development of ELLs have been increasing, findings from previous research are limited in their generalizability. Lesaux (2006) argued that while the breadth of research on ELL reading development is wide, it lacks depth; thus, the findings are not robust enough to be generalized. The current study attempts to address some of the major limitations of previous research, including the sample bias present in previous ELL research as well as the use of limited reading indicators in previous ELL research.
Definition of ELLs. Although some studies suggest that LM students
demonstrate reading development patterns similar to non-ELLs (Al Otaiba et al., 2009; Gutiérrez & Vanderwood, 2013; Kieffer, 2008; Lesaux & Kieffer, 2010), many studies failed to differentiate LM students with and without limited English proficiency
(Chiappe, Siegel, & Gottardo, 2002; Chiappe, Siegel, & Wade-Wolley, 2002; Lesaux & Kieffer, 2010; Lesaux et al., 2007; Quirk & Beem, 2012). Because the LM status is based solely on students’ primary home language, findings from these studies may represent students whose English proficiency is not limited, and therefore the studies may not be generalized to ELLs whose English proficiency is limited.
Another concern regarding the definitions of ELLs used in previous research is that it is often unclear how former ELLs are classified. If studies use primary home language as an indicator of ELLs (which is referred to as LM students in the current study), former ELL students are classified as ELLs (LM students in the current study). For example, Quirk and Beem (2012) classified former ELLs as ELLs; they defined ELLs as students who had been classified as ELL at some point in their educational career. In contrast, if studies determine student ELL status based on whether students are currently receiving ESL services, former ELLs are classified as non-ELL students, as used in NAEP Reading Assessment. As Lesaux (2006) pointed out, without studying former ELLs as a group separate from ELLs and non-ELL students, it is difficult to understand the growth continuum of ELL reading skills.
To address this concern, students included in the current study are classified into three groups: ELLs who were receiving state ESL services during the data collection periods, former ELLs who exited the state ESL services, and non-ELLs who were not eligible or not served by the state ESL services. Although there may be students in the non-ELL group whose primary home language is not English, the current study still classifies them as non-ELL based on their ESL service records provided by state departments. More information on the state ELL classifications is discussed in the following chapter.
Regional and grade-level bias. Another reason that the generalizability of previous findings is limited is that most published studies were conducted in areas with a history of having large numbers of ELL and LM students in schools, such as California, Florida, Texas, and Vancouver, British Columbia (Abedi, 2004; Al Otaiba et al., 2009;
18
Chiappe, Siegel, & Gottardo, 2002; Gutiérrez & Vanderwood, 2013; Lesaux & Kieffer, 2010; Lesaux et al., 2006; Richards-Tutor et al., 2013). While studies conducted in these regions can provide useful information about the performance of ELLs and LM students, such findings may not generalize to those who reside in other states lacking a long history of serving a large ELL population, such as Oregon.
In addition to regional bias, the grade levels studied in most ELL research are also somewhat limited. Based on the preceding review of 14 published studies examining reading performance in ELLs and/or LM students, eight studies included participants from kindergarten to third grade, two studies followed students from kindergarten to fourth grade, two studies included students in middle school (see Table 2), and two studies included only fourth-grade students. As students transition from learning to read to reading to learn, and as text complexity increases, the transition from third grade to fourth grade can be particularly challenging for ELLs and former ELLs. Irrespective of reading difficulty, there is not enough empirical evidence to describe ELLs at these grade levels. To address both regional and grade-level biases in previous ELL research,
students in Oregon were followed for two school years, from third grade (2011–2012 school year) to fourth grade (2012–2013 school year), in the current study.
Measuring reading skills using a single indicator. Most previous studies examining the reading performance of ELLs used measures of basic literacy such as phonological processing, and measures of fluency such as oral reading fluency (see Table 2). While findings from these studies help educators understand the development of basic reading skills in early grades, they do not provide useful information about how ELLs and former ELLs develop comprehension and vocabulary skills over time. It is critical to
understand the development of such domains because (a) although oral reading fluency is an important indicator of students’ later reading comprehension, the relation between fluency and comprehension changes over time, and (b) there is a greater demand for comprehension as students continue their schooling (Nese, Park, Alonzo, & Tindal, 2011; Yovanoff, Duesbery, Alonzo, & Tindal, 2005). Furthermore, ELLs are especially likely to lack vocabulary knowledge and to experience challenges with comprehension as required texts increase in complexity (August, Carlo, Dressler, & Snow, 2005).
Unfortunately, even LM students entering kindergarten without limited English proficiency tend to lag behind in reading as the demand of reading increases in upper grades. Many ELLs and LM students, including U.S.-born ELLs, lack the vocabulary essential for academic success (Lesaux, 2006). Therefore, it is important to understand how ELLs perform not only on fluency measures, but also on other domains of reading such as comprehension and vocabulary (Lesaux & Kieffer, 2010). By doing so, ELLs who may be excluded from receiving additional instructional supports due to their high fluency (e.g., former ELLs) can receive adequate supports to develop their
comprehension and vocabulary skills.
Because previous empirical evidence is limited in generalizability, we cannot make robust statements either about how ELLs develop in reading, or about whether it is reasonable to assume that ELLs’ growth norms are comparable to those of non-ELLs (Kieffer, 2008; Lesaux et al., 2007). Thus, more research, especially longitudinal studies, should be conducted to better understand how ELLs develop in reading over time
(August & Shanahan, 2006). To address this concern, the current study includes three reading curriculum-based measures (CBMs): oral reading fluency, reading
20 Table 2
Review of Published Research on the Reading Performance of English Language Learners (ELLs) and/or Language Minority (LM) Students
First author Second author Year n size Grade level Region Measures used
Al Otaiba,
S. Petscher, Y. 2009
2,182 ELLs 965 former ELLs 1,857 non-ELLs
2-3a Florida Oral reading fluency
Receptive vocabulary
Alonzo, J. 2007
110 ELLs with low English proficiency
110 ELLs with advanced English proficiency
214 non-ELLs
3-4 Oregon
Early literacy measures (letter naming, letter sound, phoneme segmenting)
Fluency measures (word reading, sentence reading, passage reading)
Reading comprehension
Baker, D. Baker, S. 2009 Approximately 750 ELLs and
2,300 non-ELLs in each grade 1-3 Oregon
Fluency measures (nonsense words, oral reading)
Standardized reading assessment
Baker, D. Park, Y. 2012 Approximately 160 ELLs in each
grade 1-3 Oregon
Fluency measures (pseudoword reading and oral reading in Spanish; pseudoword reading and oral reading in English)
Standardized reading assessment
Betts, J. Bolt, S. 2009 303 ELLs 3 Minnesota
English language proficiency test Oral reading fluency
State reading assessment
Chiappe, P. Siegel, L. 2002
59 non-ELLs who are LM 60 ELLs
540 non-ELLs who are NS
K Vancouver,
B.C.
Early literacy measures (letter identification, spelling, sound mimicry, rhyme detection, syllable and phoneme identification, phoneme detection, word retrieval, syntactic awareness, verbal memory )
Chiappe, P. Siegel, L. 2002 131 LM
727 non-ELLs who are NS K-1
a Vancouver,
B.C.
Early literacy measures (letter identification, spelling, pseudoword repetition,
phonological awareness, syllable identification, phoneme identification, phoneme deletion, word retrieval, syntactic awareness, verbal memory, print awareness) Gutiérrez,
G.
Vanderwood,
M. 2013 260 ELLs 2 California
English language proficiency test Fluency measures (oral reading fluency, phoneme segmenting fluency, nonsense word fluency)
Table 2
Review of Published Research on the Reading Performance of English Language Learners (ELLs) and/or Language Minority (LM) Students (Continued)
First author Second author Year n size Grade level Region Measures used
Kieffer, M. 2008
746 ELLs
1,134 non-ELLs who are LMs without limited English proficiency
15,362 non-ELLs who are NS
K-5a National
dataset Reading composite IRT-based scaled scores
Kieffer, M. Lesaux, N. 2012 90 LM 4-7a California
Vocabulary
Morphological awareness
Fluency measures (word reading, nonsense word reading, sight word reading)
Phonological awareness
Lesaux, N. Kieffer, M. 2010 399 LM
182 non-ELLs who are NS 6 California
Standardized reading assessment Fluency measures (word reading, pseudoword reading, passage reading) Vocabulary measures (general and academic vocabulary measures)
Lesaux, N. Lipka, O. 2006 85 LM
395 non-ELLs who are NS 4
Vancouver, B.C.
Early literacy measures (phonological processing, syntactic awareness) Fluency measures (word reading, word identification, pseudoword reading) Standardized reading assessment
Lesaux, N. Rupp, A. 2007 153 LM
689 non-ELLs who are NS K-4
a Vancouver,
B.C.
Early literacy measure (letter identification, working memory, sound mimicry, rhyme detection, syllable detection, syllable identification, phoneme identification, phoneme deletion, oral cloze, spelling) Fluency measure (word reading, pseudoword reading)
Standardized reading assessment
Richards-Tutor, C. Solari, E. 2013 114 LM K California
Early literacy measures (onset and rime detection, segmentation, and
blending)
Fluency measures (word identification, word reading, phoneme segmenting, nonsense words)
a = longitudinal study
22
comprehension, and vocabulary. Participants were administered each of these measures three times a year for two years, which allowed the author to analyze growth in each of the three domains of reading across two years.
Research Questions of the Current Study
The lack of comprehensive findings on ELL literacy growth has often been noted as a major challenge for teachers in providing effectively targeted instruction to ELLs. As a result, ELLs identified as having reading disabilities are significantly overrepresented (Lesaux, 2006). The literacy growth of ELLs may differ from their non-ELL peers, making understanding the literacy growth of ELLs especially critical in early grades. This knowledge can help educators provide more appropriate and timely academic support to ELLs. To address the aforementioned limitations in the research base, and to expand our knowledge of the reading development of ELLs, the following research questions will be answered:
Research Question 1: To what extent do literacy growth trajectories across third and fourth grade differ based on whether students are non-ELLs, ELLs, or former ELLs, as measured by curriculum-based measures of oral reading fluency (ORF), reading comprehension (RC), and
vocabulary (VOC)?
Research Question 2: Do distinct patterns of literacy growth exist? If so, how are these patterns related to students’ ELL status?
Research Question 3: Do ELLs and former ELLs demonstrate literacy development profiles that are distinct from those of their non-ELL peers?
CHAPTER II METHODS
Extant easyCBM data from third and fourth grade was used to create a cohort of students in Oregon, with measurement occasions ranging from the fall of 2011 to the spring of 2013. Students’ tri-annual reading CBM scores (oral reading fluency, reading comprehension, and vocabulary) were analyzed to investigate these students’ literacy growth trajectories and reading profiles.
Participants and Settings
The initial sample included 15,475 students from the 51 districts in Oregon that administered the easyCBM benchmark assessment during the 2011–2012 and 2012–2013 school years. These students were in third grade in the 2011–2012 school year and in fourth grade in the 2012–2013 school year.
As the primary purpose of this study was to compare growth rates between ELLs and non-ELLs (e.g., native speakers of English; students who exited the ELD program), 386 students without a 2011–2012 school year ELL status indicator reported by the Oregon Department of Education were excluded from analyses. Students with the ELL indicator scored significantly higher on most measures, including all six oral reading fluency (ORF) tests, four reading comprehension (RC) tests, and four vocabulary tests across the two years (see Table 3).
24 Table 3
Mean Comparisons Between Students With and Without English Language Learner (ELL) Status Indicator1
Test Season ELL indicator Without ELL indicator Mean difference n M SD n M SD Oral Reading Fluency Fall Y1 7987 84.93 39.98 265 76.54 38.04 8.39* Winter Y1 7815 116.39 45.14 259 107.94 47.32 8.45* Spring Y1 7975 114.06 43.70 283 107.18 46.68 6.89* Fall Y2 7254 108.97 38.31 259 94.49 37.04 14.48* Winter Y2 6059 133.60 38.81 47 112.32 48.36 21.28* Spring Y2 6683 140.20 44.25 208 127.66 44.68 12.54* Reading Comprehension Fall Y1 8871 10.24 3.99 298 9.60 4.18 0.63* Winter Y1 8603 10.05 3.34 303 9.76 3.39 0.29 Spring Y1 7277 13.32 4.35 296 12.57 4.07 0.76* Fall Y2 7315 11.83 4.44 257 10.40 4.17 1.43* Winter Y2 7004 13.40 4.07 45 12.58 4.40 0.82 Spring Y2 5574 13.73 4.15 202 12.00 4.36 1.73* Vocabulary Fall Y1 7860 14.47 4.52 259 14.12 4.44 0.35 Winter Y1 7562 15.76 4.01 257 14.29 4.61 1.47* Spring Y1 6792 16.95 3.30 265 16.17 3.82 0.78* Fall Y2 7667 15.47 3.98 283 14.48 4.09 0.99* Winter Y2 6782 16.62 3.42 71 16.30 3.97 0.32 Spring Y2 6185 17.06 3.25 227 15.96 3.83 1.10* 1 ELL status indicator is based on the 2011–2012 school year record.
Note. Independent Samples t-test with unequal variance assumption was conducted. Y1=2011–2012 school year. Y2=2012–2013 school year.
* p < .05
Of the 15,089 students with a valid ELL indicator, 2,844 students had no easyCBM data at any time point, and these students were excluded from analyses. A greater percentage of students removed from the analytic sample due to lack of CBM scores (approximately 19%) were ELL students compared with the group of all students with a valid ELL indicator (approximately 15%). Also, students with at least one CBM score performed significantly higher on the Oregon Assessment of Knowledge and Skills (OAKS) reading assessment, which was Oregon’s high-stakes assessment at the time, compared to students without any CBM scores (see Table 4).
Table 4
Proportion of English Language Learners (ELLs) Between Students With and Without CBM Score
At least 1 CBM score No CBM score Total1
Non-ELL 10,181 2,165 12,346 83.1% 76.1% 81.8% Former ELL 435 126 561 3.6% 4.4% 3.7% ELL 1,629 553 2,182 13.3% 19.4% 14.5% OAKS score2 214.13 210 213.54 Total 12,245 2,844 15,089
1 The information is based on the students with a valid ELL indicator.
2 The mean difference of 3.14 for the 2011–2012 school year OAKS reading assessment between students with at least one CBM score and students without any CBM score was significant, p < .05.
Note. CBM=Curriculum based measurement.
The final analytic sample included a total of 12,245 students with a valid ELL indicator and at least one CBM score, representing 48 districts. Approximately 83.1% of these students were non-ELL; 13.3% were ELL; and 3.6% were former ELL. There were slightly more males (n=856, 52.5% of ELLs) in the ELL group and more females in the former ELL group (n=230, 52.9% of former ELLs). A large proportion of ELLs (n=1240, 76.1% of ELLs) and former ELLs (n=262, 60.2% of former ELLs) were Hispanic
students. About half of non-ELLs were eligible for free and/or reduced-priced lunch (FRL), while more than 90% of ELLs and 79% of former ELLs were eligible for FRL. One interesting note is that former ELLs performed as well as non-ELLs on the 2011– 2012 school year OAKS, while ELLs scored much lower than these two groups. Table 5 displays a detailed description of the sample included in the analysis. It is important to note that results from this study were interpreted with caution, as students included in the analysis may have had different characteristics of reading performance than students excluded from analyses.
26 Table 5
Description of Analytic Sample
Percent distribution Non-ELL
n=10,181 (83.1%) ELL n=1,629 (13.3%) Former ELL n=435 (3.6%) Total n=12,245 (100%) Gender Male 5,144 (50.5%) 856 (52.5%) 205 (47.1%) 6,205 (50.7%) Female 5,037 (49.5%) 773 (47.5%) 230 (52.9%) 6,040 (49.3%) Race/ Ethnicity
American Indian/Alaska native 195 (1.9%) 5 (0.3%) 0 (0.0%) 200 (1.6%) Asian/Pacific Islander 400 (3.9%) 169 (10.4%) 93 (21.4%) 662 (5.4%) Black/African American 268 (2.6%) 38 (2.3%) 9 (2.1%) 315 (2.6%) Hispanic 999 (9.8%) 1,240 (76.1%) 262 (60.2%) 2,501 (20.4%) White 7,627(74.9%) 162 (9.9%) 67 (15.4%) 7,856 (64.2%) Multi-ethnic/Multi-racial 692 (6.8%) 15 (0.9%) 4 (0.9%) 711 (5.8%) IEP Participated 1,626 (16.0%) 275 (16.9%) 14 (3.2%) 1,915 (15.6%) Not participated 8,555 (84.0%) 1,354 (83.1%) 421 (96.8%) 10,300 (84.4%) FRL Eligible 5,312 (52.2%) 1,505 (92.4%) 347 (79.8%) 7,164 (58.5%) Not eligible 4,869 (47.8%) 124 (7.6%) 88 (20.2%) 5,081 (41.5%)
OAKS reading score 215.8 203.0 217.1 214.1
OAKS Did not pass 2,228 (21.9%) 1,060 (65.1%) 43 (9.9%) 3,331 (27.2%) Passed 5,200 (51.1%) 538 (33.0%) 327 (75.2%) 6,065 (49.5%) Exceeded 2,753 (27.0%) 31 (1.9%) 65 (14.9%) 2,849 (23.3%)
Note. ELL=English language learner. IEP=Individualized education program. FRL= Free and/or reduced priced lunch. OAKS=Oregon Assessment of Knowledge and Skills. The third-grade achievement standards of the OAKS reading assessment for the meets and exceeds category were 211 and 224, respectively, for the 2011–2012 school year.
English Language Learner (ELL) Status
The key covariate used in this study is students’ ELL status, as reported by the Oregon Department of Education for the 2011–2012 academic year. In Oregon, there are two main ways—Home Language Survey and teacher referral—to identify students who are potentially eligible for English language development (ELD) services, which are often referred to as ESL services in research. These students are assessed on their academic English proficiency in four language domains (reading, writing, speaking, and listening) using one of the four state-approved English language proficiency assessments (ELPAs) to determine the students’ eligibility for ELD. The four state-approved ELPAs are the IDEA Language Proficiency Test (IPT) (Ballard, Tighe, & Dalton, 1979), the Language Assessment Scales (LAS) (De Avila & Duncan, 1989), the Stanford English Language Proficiency test (SELP) (Harcourt Assessment, Inc., 2003), and the Woodcock-Muñoz Language Survey (Woodcock-Muñoz-Sandoval, Ruef, & Alvarado, 2005). All students classified as ELL based on their ELPA results receive ELD services unless parents refuse the services for their child. The ELPA is administered annually to all identified ELLs, including all students who have completed a waiver to refuse ELD services (Oregon Department of Education, 2015).
The state classified students into 10 categories to indicate students’ ELL status for the 2011–2012 school year: (a) students not eligible or not served by ELD services, (b) first-year ELL students without English Language Proficiency Assessments (ELPA), (c) first-year ELL students with ELPA, (d) students receiving ELD services between 2 and 5 years, (e) experienced ELL students (more than 5 years), (f) monitored students, (g) transitioning students (exited ELD services 1 to 2 years ago), (h) students who exited
28
ELD services on or before May 1, 2012 (during the 2011–2012 school year), (i) students who exited ELD services after May 1, 2012 (at the end of the 2011–2012 school year), and (j) students eligible for but not served by ELD services.
Given the small numbers of students in some of these categories (see Table 6), and for the sake of parsimony, these ten categories were collapsed into three (non-ELLs, current ELLs, and former ELLs), and used as a covariate to capture the heterogeneity of ELLs. This ELL status indicator variable was used to compare literacy growth rates of non-ELLs, current ELLs, and former ELLs. Therefore, among the 12,245 students included in the analytic sample, 1,629 students were ELLs (those who were receiving additional academic support due to their limited English proficiency), 435 former ELLs (those who formerly received additional academic support due to their limited English proficiency but were reclassified as English proficient either before, during, or by the end of third grade), and 10,181 were non-ELLs.
As mentioned in an earlier section, one of the major limitations of previous research is that the definition of ELL varies across studies. Although it would have been preferable to include students’ ELPA scores, the actual ELPA scores were not accessible; thus, they were not available for analysis. In addition, it is important to note that ELL status in this study was treated as a fixed variable even though students may have been reclassified as non-ELL during the 2012–2013 school year, as the 2012–2013 school year ELL classification data were not available when data were provided for this research.
Table 6
The Number of Students in Each English Language Learner (ELL) Status Category
Original classification # of students New category # of students (1) Not eligible for nor served by ELD services 10,181 Non-ELLs 10,181 (2) first-year ELD students without ELPA 3
ELLs 1,629 (3) first-year ELD students with ELPA 47
(4) students in ELD program between 2 and 5
years 1,578
(5) experienced ELD students (more than 5
years) 1
(6) monitored 0
Former ELLs 435 (7) transitioning (exited ELD services in prior
year or 2 years ago) 282
(8) students who exited ELD services on or
before 5/1/2012 22
(9) students who exited ELD services after
5/1/2012 131
(10) students eligible but not served by ELD
services 0 -- 0
Note. ELD=English language development. ELPA=English language proficiency assessments.
Measures
The easyCBM benchmark and progress monitoring assessment system (Alonzo, Tindal, Ulmer, & Glasgow, 2006) was designed to provide technically adequate
benchmark and progress monitoring measures to teachers and educators, and to help them make better instructional decisions based on student performance data. As of 2015, over 303,500 teachers actively use the system to monitor more than 2 million students. For each measure, there are 3 benchmark and an additional 10 to 17 progress-monitoring forms of equivalent difficulty available to measure students’ literacy and reading skills for kindergarten through eighth grade, depending on the grade and measure type. Oral reading fluency (ORF), comprehension (RC), and vocabulary (VOC) are available for third and fourth grades as benchmarks and for progress monitoring (see Appendix B for correlations among the measures included in the analysis).
30
student’s ability to read connected narrative text aloud accurately and fluently. During 60 seconds, the student reads aloud a narrative passage written on single-sided paper while a trained assessor follows along and marks as errors any words the student misreads or skips. If a student hesitates for more than three seconds, the assessor provides the word and marks it as an error. If a student self-corrects any errors, they are counted as correctly read words. If student finishes the passage before 60 seconds, then he or she returns to the beginning of the passage and continues to read it aloud. At the end of 60 seconds, the assessor calculates the total number of words read correctly in one minute by subtracting the number of errors from the total number of words read.
All ORF forms were developed to be at mid-grade reading level for each grade, and they are comparable in difficulty within each grade. To increase the equivalence of difficulty across alternate forms, extensive systematic review and pilot studies were conducted, and necessary changes were made during the revision process (see Alonzo & Tindal, 2007, for details). The passages administered for this study were approximately 250 words in length for both third and fourth grade.
Test-retest reliability coefficients ranged from .84 to .94 and .86 to .96 for third and fourth grade, respectively. Alternate form reliability coefficients ranged from .91 to .95 and .83 to .98 for third and fourth grade, respectively (Alonzo, Lai, Anderson, Park, & Tindal, 2012; Park, Anderson, Alonzo, Lai, & Tindal, 2012). Correlations between ORF and state reading assessments ranged from .66 to .67 and from .64 to .67 for third and fourth grade, respectively (Sáez, Park, Nese, Jamgochian, Lai, Anderson, Kamata, Alonzo, & Tindal, 2010). A previous study reported that reliability of slope based on the second and third grade easyCBM progress monitoring ORF measures
ranged from .81 to .87 (Patarapichayatham, Anderson, Irvin, Kamata, Alonzo, & Tindal, 2011).
easyCBM multiple choice reading comprehension (RC). The easyCBM RC assessment is typically group-administered online. Students read an original fictional narrative passage (approximately 1,500 words long for third and fourth grade), then answer 20 multiple-choice questions based on the story. Each passage was written to be at mid-grade level readability. Of the 20 question items on each form, 7 assess students’ literal comprehension skills, 7 measure inferential comprehension, and 6 test evaluative comprehension skills. Each item consists of a question stem and three possible answer choices: the correct answer, and two incorrect distractors. All RC items were analyzed using a Rasch model during the instrument development process and were found to function appropriately for grade-level students, with a wide range of difficulty (Alonzo & Tindal, 2008). Although this measure is not timed, most students complete the test in approximately 30 minutes.
Internal consistency reliability ranged from .55 to .78 and from .73 to .78 for third and fourth grade, respectively (Sáez et al., 2010). There were no statistical differences across the forms for either grade (Alonzo et al., 2012; Park et al., 2012). Correlations between RC and state reading assessments ranged from .54 to .61 and from .55 to .67 for third and fourth grade, respectively (Sáez et al., 2010).
easyCBM vocabulary (VOC). The easyCBM VOC assessment is also typically group-administered online. There are 20 multiple-choice questions followed by three answer choices: a correct synonym, and two incorrect but plausible distractors. All vocabulary words were drawn from a word list developed by researchers at The Ohio
32
State University. Similar to RC items, all VOC items were analyzed using a Rasch model and were found to function appropriately for the targeted grade level. Although this measure is not timed, most students complete the test in approximately 10 to 15 minutes. Internal consistency reliability ranged from .82 to .84 and from .81 to .82 for third and fourth grade, respectively (Wray, Alonzo, & Tindal, 2014). The correlations between VOC and state reading assessments ranged from .61 to .70 and from .69 to .71 for third and fourth grade, respectively (Sáez et al., 2010).
It is important to note that the easyCBM reading measures were not vertically scaled across grades during development. In other words, students’ scores from different grades should not be used to determine growth across grades. Therefore, students’ within-year growth on each of the three measures (ORF, RC, and VOC) for each within-year, obtained from six benchmark administrations (at the beginning, middle, and end of each academic year) was calculated separately for each grade level although they were modeled
together.
Surprisingly, former ELL students scored significantly higher than non-ELL students on all six ORF tests. For RC, mean differences between non-ELLs and former ELLs were not statistically significant except in the fall of Year 2 (the 2012–2013 school year), when non-ELLs scored significantly higher than former ELLs. For VOC, mean differences between non-ELLs and former ELLs were not statistically significant except in the spring of Year 1 (the 2011–2012 school year), when former ELLs scored
significantly higher than non-ELLs. Current ELLs performed significantly lower on all measures compared to their non-ELL and former ELL peers (see Table 7).
Table 7
Descriptive Statistics for easyCBM Reading Measures Collected During the 2011–2013 School Years
Test Season n M Non-ELL SD n ELL M SD Former n M ELL SD na M SD Total
ORF Fall Y1 6654 88.58 40.15 1059 57.97 28.97 274 100.47 28.76 7987 84.93 39.98 Winter Y1 6499 120.36 45.15 1051 87.40 35.60 265 133.91 32.35 7815 116.39 45.14 Spring Y1 6633 117.79 43.79 1076 86.58 34.24 266 132.36 31.33 7975 114.06 43.70 Fall Y2 6020 112.16 38.53 968 85.22 29.61 266 123.10 27.58 7254 108.97 38.31 Winter Y2 5222 136.52 38.49 669 107.51 33.68 168 146.71 24.93 6059 133.60 38.81 Spring Y2 5540 144.09 43.90 897 111.13 37.24 246 158.60 31.65 6683 140.20 44.25 FW Y1 6148 32.79 19.27 994 29.48 17.43 254 35.20 19.37 7396 32.43 19.07 WS Y1 6211 -1.98 18.46 1020 -0.81 16.51 259 -1.51 19.40 7490 -1.80 18.25 FW Y2 4892 23.71 19.00 630 22.21 16.17 161 24.82 19.20 5683 23.58 18.72 WS Y2 4366 8.08 18.52 567 2.76 16.15 133 8.22 17.53 5066 7.49 18.32 RC Fall Y1 7523 10.57 3.98 1049 7.63 3.18 299 10.98 3.12 8871 10.24 3.99 Winter Y1 7214 10.36 3.31 1078 7.86 2.72 311 10.45 3.01 8603 10.05 3.34 Spring Y1 6355 13.71 4.22 726 9.95 4.08 196 13.42 3.91 7277 13.32 4.35 Fall Y2 6347 12.28 4.38 759 8.16 3.22 209 11.47 3.98 7315 11.83 4.44 Winter Y2 6067 13.72 3.97 727 10.56 3.96 210 14.00 3.42 7004 13.40 4.07 Spring Y2 4789 14.06 4.05 615 11.06 3.98 170 14.23 4.06 5574 13.73 4.15 FW Y1 6425 -0.16 3.48 895 -0.01 3.46 258 -0.65 3.68 7578 -0.16 3.49 WS Y1 5654 3.37 3.49 611 2.39 3.77 180 3.59 3.82 6445 3.29 3.54 FW Y2 5343 1.38 3.73 630 2.60 3.73 173 2.27 3.54 6146 1.53 3.75 WS Y2 4337 0.22 3.43 552 0.55 3.73 152 0.43 3.53 5041 0.27 3.47 VOC Fall Y1 6730 14.93 4.42 888 10.73 3.74 242 15.51 3.20 7860 14.47 4.52 Winter Y1 6465 16.25 3.77 881 12.04 4.04 216 16.56 2.43 7562 15.76 4.01 Spring Y1 5981 17.22 3.11 636 14.13 3.95 175 17.82 1.90 6792 16.95 3.30 Fall Y2 6487 15.98 3.79 923 11.80 3.60 257 15.90 2.81 7667 15.47 3.98 Winter Y2 5912 17.00 3.17 679 13.18 3.77 191 17.02 2.47 6782 16.62 3.42 Spring Y2 5150 17.48 3.03 805 14.26 3.49 230 17.46 2.39 6185 17.06 3.25 FW Y1 5688 1.38 3.09 706 1.44 3.43 177 1.03 2.58 6571 1.37 3.12 WS Y1 5210 0.93 2.57 502 1.91 3.11 143 1.36 2.17 5855 1.03 2.63 FW Y2 5208 0.93 2.68 593 1.42 3.19 149 1.01 2.65 5950 0.98 2.74 WS Y2 4301 0.47 2.22 517 1.05 2.94 135 0.39 2.20 4953 0.53 2.32
a. Although the sample size for each measure does not add up to 12,245, the descriptive analysis was conducted using the full analytic sample size. ORF=easyCBM Passage Reading Fluency. RC=easyCBM Multiple Choice Reading Comprehension. VOC=easyCBM Vocabulary. Y1=2011–2012 school year. Y2=2012–2013 school year. FW=change between fall and winter. WS=change between winter and spring.
34 Data Analysis
In this section, the data structure, a brief summary of preliminary analysis results, the analytic approach, and the analytic procedures are described.
Data structure and preliminary analysis. The data used for this study had a nested structure, where individual easyCBM reading measures were nested within students, and students were nested within districts. Despite this hierarchical relationship, the data were structured to address only the multiple testing occasions nested within students, without accounting for the nested structure of students within districts, because of model convergence problems during the preliminary analysis phase. Such problems may have been due to the wide variation in numbers of students and the percentage of non-ELLs, ELLs, and former ELLs (see Appendix A). Although failure to address this nested structure could have yielded misleading results because students from the same district might have had correlated residuals, which would have violated the assumption of independence of observations, this decision was necessary for model convergence.
Analytic approach and procedure. A piecewise growth model was fitted to investigate the developmental patterns of reading skills for students in the early elementary grades based on their tri-annual benchmark assessment data. Then the multiple-group piecewise growth model analysis was conducted to examine differences in growth trajectories between non-ELLs, ELLs, and former ELLs. In addition, Latent Class Growth Analysis (LCGA) was conducted to capture groups of students sharing similar growth trajectories (Wang & Wang, 2012) over the course of two school years.
Because the easyCBM reading measures were not vertically scaled across grades (Alonzo & Tindal, 2007), it was not appropriate to model student growth across the six