UNF Digital Commons
UNF Digital Commons
UNF Graduate Theses and Dissertations Student Scholarship2019
Examining the influence of the leader in me on school grades
Examining the influence of the leader in me on school grades
Jennifer Lynn Wright
University of North Florida, [email protected]
Follow this and additional works at: https://digitalcommons.unf.edu/etd
Part of the Educational Leadership Commons
Suggested Citation Suggested Citation
Wright, Jennifer Lynn, "Examining the influence of the leader in me on school grades" (2019). UNF Graduate Theses and Dissertations. 910.
https://digitalcommons.unf.edu/etd/910
This Doctoral Dissertation is brought to you for free and open access by the Student Scholarship at UNF Digital Commons. It has been accepted for inclusion in UNF Graduate Theses and Dissertations by an authorized administrator of UNF Digital Commons. For more information, please contact Digital Projects. © 2019 All Rights Reserved
EXAMINING THE INFLUENCE OF THE LEADER IN ME ON SCHOOL GRADES by
Jennifer Lynn Wright
A dissertation submitted to the department of Leadership, School Counseling, and Sports Management in partial fulfillment of the requirements for the degree of
Doctor of Education in Educational Leadership UNIVERSITY OF NORTH FLORIDA
COLLEGE OF EDUCATION AND HUMAN SERVICES August 2019
Dedication: To my Michaels.
Acknowledgements
My high school guidance counselor once told me that college just wasn’t in the cards for a student like me. Now, what that guidance counselor meant by “a student like me” remains a mystery, but I do know that I have been fortunate to have many people in my life not share that same sentiment. I am forever grateful for their guidance, support, and encouragement.
I want to first thank my committee members. Matt, your passion for k-12 education and leadership development led me down this path in the first place, and I am so thankful for your willingness to share with me this passion. Also, your support was unyielding, and I thank you for always believing in me. My biggest trepidation when beginning the doctoral program revolved around the statistic courses I knew I had to conquer. Dan and Amanda, you both took abstract concepts, at least to me, and presented them in ways that actually made sense. I will forever be inspired by your ability to make these concepts accessible and exciting to this non-mathematical thinker. Georgette, when I chose the nonprofit management path for my cognate, I did so out of a passion for serving those in need of a kind heart and an open mind. At the time, I did not realize how applicable and necessary the tenants of leading a nonprofit organization would be in the k-12 world. I use the lessons you taught me daily in my school leadership position, and I thank you for providing me a different perspective.
I never would have arrived at this destination if it were not for the support, camaraderie, and wisdom of my cohort soul sister, Sarah. Through this process, you consistently pushed me, encouraged me, challenged me, and believed in me. We made a pact to not leave each other behind, and you held firm to your promise. Your friendship means as much to me as this degree.
Some of those who supported me through this feat did so in spirit. To my mom, grandmother, and grandfather who are no longer with me in body, I always felt your love and
support guide me through, especially during the uphill battles. I share this accomplishment with you.
This journey would not have been possible had it not been for the understanding, patience, and unwavering love and support from the loves of my life, my Michaels. To my husband, Mike, I am forever grateful to you for taking on our other life duties as I focused on my schoolwork. To my son, Michael, you are my pride and joy, my heart and soul, and my reason for following my dreams. My intent in accomplishing this endeavor was to provide you with more opportunities in the future and a model for you to see that there are no limits to what you can accomplish if you set your mind to something. I cannot wait to see the amazing dreams you fulfill in your life.
Table of Contents Dedication………...ii Acknowledgements……….………...iii List of Tables………...…...viii List of Figures………...………...x Abstract………...………...xii Chapter 1: Introduction...13 Problem Statement...17
Rationale for the Study...17
Purpose of the Study...19
Research Questions and Hypotheses...19
Significance of the Study...20
Study Definitions...20
Chapter 2: Literature Review and Framework...22
Organization of the Literature Review and Framework Chapter...22
Conceptual Framework...22
Central Concepts of The Leader in Me...22
Theoretical Foundations of TLIM...24
Application of TLIM...25
Literature Review...27
Staff and Teacher Leadership...27
Youth Leadership...31
Socioeconomic Status as Measured by Free and Reduced Meal Plans...38
Minority Status...42
School Attendance...45
Conclusion...49
Chapter 3: Research Method...52
Organization of the Research Methods Chapter...52
Research Questions...52
Research Design...53
Participants and Data Sources...55
Sample Selection...55
Description of the Variables...56
Procedures...61
Chapter 4: Analysis and Results...63
Organization of the Analysis and Results Chapter...63
Preparing the Data...63
Data Analysis and Results...64
Research Question 1: What impact does the implementation of a youth leadership development program, specifically TLIM program, have on school grades over time? ...64
Research Question 2: What impact does the implementation of TLIM have on academic achievement as measured by the English/Language Arts, mathematics, and science FSA scores over time? ...69
Research Question 3: Which school environments may be most conducive to achievement growth through the implementation of The Leader in Me (TLIM) when examined through FL
school grades and key student demographics? ...81
Chapter 5: Discussion and Implications...88
Organization of the Discussion and Implications Chapter...88
Summary of the Study...88
TLIM Impact on Student Achievement as Measured by School Grades and FSA Scores...89
TLIM Impact on Specific Student Populations...95
Study Limitations...98
Implications for Practice...99
Implications for Future Research and Inquiry...101
References………103
List of Tables Chapter 2
Table 2.1. 2018-2019 Annual Income Eligibility Guidelines for Reduced Meal Plans and Free Meal Plans for the 48 Contiguous States, District of Columbia, Guam, and Territories….….39
Chapter 3
Table 3.1. The 2017-18 School Grades Model for Elementary Schools…..……....…...….…58 Table 3.2. 2017-2018 Florida School Grading Percentages…..………..….…59 Table 3.3. 2017-2018 Annual Income Eligibility Guidelines for Reduced Meal Plans and Free
Meal Plans………60 Chapter 4
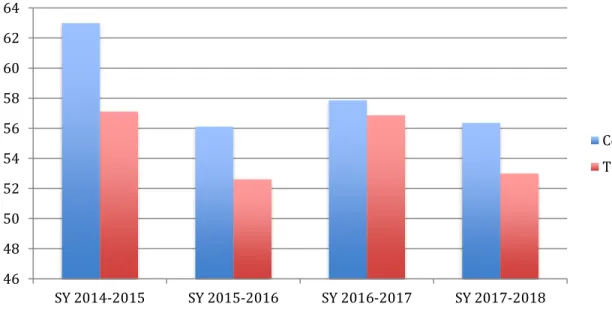
Table 4.1. Descriptive Statistics for School Grades……….………64 Table 4.2. Results of Repeated Measures ANCOVA Analysis of School Grades:
Between-Subjects Effects……….68 Table 4.3. Results of Repeated Measures ANCOVA Analysis of School Grades:
Within-Subjects Effects……….69 Table 4.4. Descriptive Statistics for Percent of Students Scoring Proficient or Higher on ELA
FSA………70 Table 4.5. Results of Repeated Measures ANCOVA Analysis of ELA FSA Achievement: Between-Subjects Effects………..72 Table 4.6. Results of Repeated Measures ANCOVA Analysis of ELA Achievement:
Within-Subjects Effects……….73 Table 4.7. Descriptive Statistics for Percent of Students Scoring Proficient or Higher on
Table 4.8. Results of Repeated Measures ANCOVA Analysis of Mathematics FSA
Achievement: Between-Subjects Effects………..76 Table 4.9. Results of Repeated Measures ANCOVA Analysis of Mathematics Achievement:
Within-Subjects Effects……….77 Table 4.10. Descriptive Statistics for Percent of Students Scoring Proficient or Higher on
Science FSA………..78 Table 4.11. Results of Repeated Measures ANCOVA Analysis of Science FSA Achievement: Between-Subjects Effects………..80 Table 4.12. Results of Repeated Measures ANCOVA Analysis of Science Achievement:
Within-Subjects Effects……….81 Table 4.13. Results of Regression Model, SY 2014-2015 through SY 2017-2018…………..82 Table 4.14. Descriptive Statistics for Study Variables……….84
Table 4.15. Effects of Minority Rate, Free and Reduced Lunch Rate, and Chronically
List of Figures Chapter 2
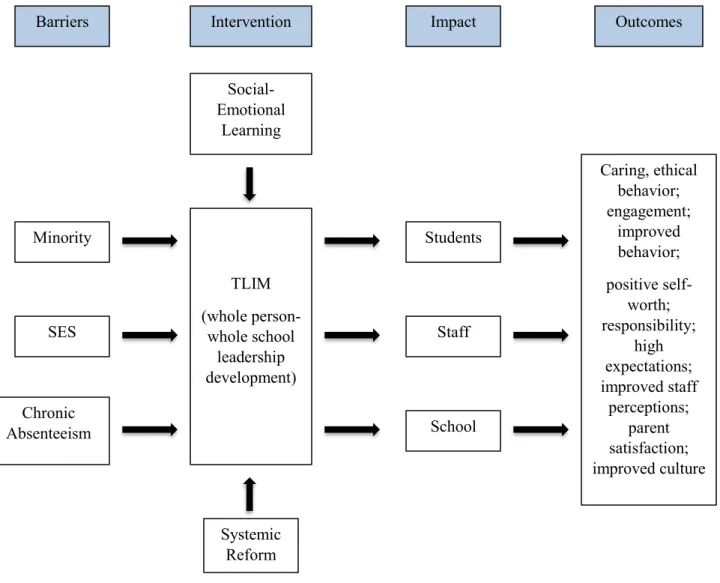
Figure 2.1. Depicts study model………...…....51 Chapter 4
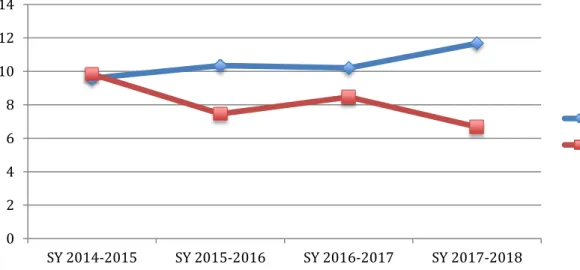
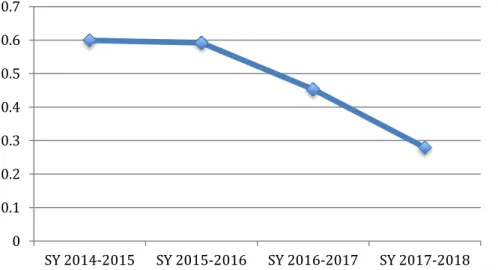
Figure 4.1. Depicts changes in mean school grade percentages earned between the control group and TLIM group………..……65 Figure 4.2. Depicts changes in standard deviations of mean school grade percentages earned
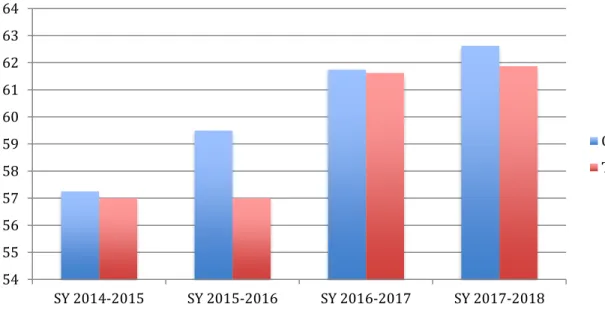
between the control group and TLIM group……….………66 Figure 4.3. Depicts changes in mean percentage of students scoring at proficiency level or higher on the ELA FSA between the control group and TLIM group………..71 Figure 4.4. Depicts changes in standard deviations of mean percentage of students scoring at
proficiency level or higher on the ELA FSA between the control group and TLIM group…..71 Figure 4.5. Depicts changes in mean percentage of students scoring at proficiency level or higher on the mathematics FSA between the control group and TLIM group………..75 Figure 4.6. Depicts changes in standard deviations of mean percentage of students scoring at
proficiency level or higher on the mathematics FSA between the control group and TLIM
group………..75 Figure 4.7. Depicts changes in mean percentage of students scoring at proficiency level or
higher on the science FSA between the control group and TLIM group………..79 Figure 4.8. Depicts changes in standard deviations of mean percentage of students scoring at
Figure 4.9. Depicts changes in the Adjusted R2 values, which indicate the influence of the
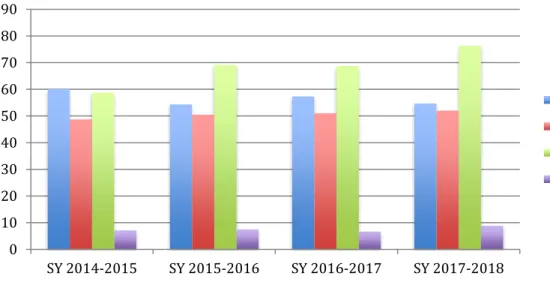
variables of minority rate, free and reduced lunch rate, and chronic absenteeism rate on school grades over time………83 Figure 4.10. Depicts the changes in mean percentages of the study variables over time……85
Abstract
School leaders face increasing demands related to student achievement. These demands involve annual data reporting related to overall student, school, and district success. In Florida, this accountability and transparency requirement is addressed through an annual school grading system. It is essential that leaders utilize successful programs that directly influence positive student outcomes and demonstrate high quality education. The purpose of this study was to examine the influence of a youth leadership development program, specifically The Leader in Me (TLIM) program, on school grades. Based on data obtained from 16 public elementary schools across Florida, a repeated measures ANCOVA analysis revealed that no statistically significant differences in the mean school grade percentages were observed between schools that implemented TLIM and schools that did not utilize the program. In addition, no significant differences were noted in the mean school-wide achievement scores on state mandated assessments in the areas of English/Language arts, mathematics, and science. Furthermore, regression analysis revealed that the percentage of students identified as minority, the percentage of students qualifying for free and reduced lunch, and the percentage of students reported as chronically absent significantly influence school grades. A review of the existing literature related to The Leader in Me, staff and student leadership, and the study variables follows, as well as a discussion of the findings and implications for future practice and research.
Examining the Influence of The Leader in Me Program on School Grades
Chapter 1: Introduction
Today’s public schools throughout the nation face immense pressure to ensure that all students are achieving at expected levels and making adequate learning gains on state mandated assessments (Kerr, Marsh, Ikemoto, Darilek, & Barney, 2006; Nichols, 2003; Sheldon, 2007). This pressure can create a school culture that seems to revolve around test-taking and not much more (Kingsbury, 2008). Instead of motivating students to do their best, the opposite can be true due to such high-stakes demands. Many in the educational field still believe that schools have a duty to provide more than just test-taking skills to our students. Children need to be prepared to face the multitude of challenges they will encounter when they enter the world beyond k-12. These challenges include seeking employment, navigating the social aspects of adulthood, and persevering through rejections and disappointments (Pellegrino & Hilton, 2012). This can be especially important for students with less access to opportunities, such as students from lower socioeconomic backgrounds and students from minority families. Research has shown that these groups of students face significant barriers to their academic achievement (Lumpkin, 2016). Schools are responsible for properly educating children from all backgrounds and must attempt to mitigate as many of these detrimental influences on student achievement as possible.
To identify students who may experience the impacts of lower socioeconomic hardships, educational researchers often rely on qualification for free and reduced meal plan programs as the measure of students’ socioeconomic status (SES). Siren (2005) identified three common
factors associated with SES: parental income; parental education; and parental occupation. For a student to be considered lower SES, that student’s parent or guardian typically has less income, less education, and a lower status occupation as compared to middle to upper class families (Harwell & LeBeau, 2010). In addition, these students often have less access to social and cultural capital as compared to their higher SES peers (Walpole, 2003). Since families must qualify for free and reduced meal plan programs at their children’s schools based on income guidelines, this reported variable serves as an indication of a student’s socioeconomic status. For example, in order for a family of four to qualify for a school’s free meal plan during the 2018-2019 school year, that family cannot receive more than $32,630 in income, which is 130% of the federal poverty level.
A student’s lower SES status has been linked to lower academic achievement in the research. This finding is due in part to less parental support with schoolwork, lower parental involvement with school staff, and less access to high quality education and schools (Sirin, 2005). In addition, students who come from lower SES backgrounds tend to have higher rates of absenteeism. Alfridi (2010) found that the availability of a hot meal at school each day through a free meal program increased student attendance rates amongst children in India. Also, children raised in homes with lower SES and higher prevalence for food insecurity, experience decreased academic achievement and increased difficulty with social-emotional development (Houston, Marzette, Ames, and Ames, 2013).
Surprisingly, Sirin (2005) found that the strength of these impacts decreased as the number of minority students increased in a school. This finding suggests that parent education level, income, and occupation status have less influence on academic achievement of minority students than non-minority students. Students whose ethnic/racial identity is strong tend to show
positive correlations with academic achievement. This finding could be due to a stronger sense of oneself and positive well-being, which acts as a protective coping mechanism against poor achievement in school (Costigan, Koryzma, Hua, & Chance, 2010).
Although this positive correlation exists in the literature, voluminous research also exists highlighting the negative correlations between minority status and academic achievement. This conundrum is often referred to as the “achievement gap” when comparing achievement results of minority students with white peers. Lower SES and poorer school conditions have been
identified as contributing factors to this serious problem (Lumpkin, 2016). An additional compounding factor on the achievement of minority students, especially those from lower SES backgrounds, is the higher prevalence of chronic absenteeism.
Although all US states have established compulsory school attendance laws for students between the ages of 5 to 18 years old, chronic absenteeism continues to hinder student academic success. Research heavily sites the influence of regular school attendance on increased school performance. One study found that school attendance accounted for 60 percent of the variance on student achievement in 9th grade (Roby, 2003). In addition, students who attend school regularly
have higher GPAs and score better on achievement test as compared to students who miss 10 percent or more of school annually (Gottfried, 2010). These results indicate that student achievement is significantly impacted on whether or not students attend school on a regular basis.
Attendance is also used as a measure of individual school and overall district
performance. Many US states set attendance standards that schools and districts must meet to demonstrate high quality and performance. The attendance factor is critical on state standardized assessment days as the number of students sitting for exams is calculated into the overall school
grade earned each year. For example, the State of Florida has established an annual school grade designation that includes achievement results on the Florida State Assessment. For a school to earn an “A” grade, 95 percent of the students in the school had to have completed the
assessments in reading and math that year (Florida Department of Education, July 2014). These overall school grade designations are accessed by parents and stakeholders to measure the quality of the school options available within a district. Research shows that these school grades influence where families choose to buy homes and which schools they desire to send their children (Figlio & Lucas, 2004; Schneider and Buckley, 2002). Parents view these grades as an indicator of the likelihood their children will succeed academically.
While academic achievement is paramount to a student’s future success, another topic of high importance in education today is encouraging students to become moral and ethical citizens of the future through the use of character building, collaboration, and leadership skills
(Anderson, 2000). Youth view leadership as important to them, available to everyone,
characterized by listening to and helping others, and much less focused on authority or power (Anderson &Kim, 2009; Culp and Kohlhagen, 2000; Mortensen, Lichty, Foster-Fishman, Harfst, Hockin, & Warsinske, 2014). Youth also report that the majority of their leadership development stems from the school environment, church, sports teams, and work (Anderson & Kim, 2009). These leadership experiences positively influence student behavior, attitude, outlook, and sense of community (Hawkes, 1999; McNae, 2011).
For students to receive maximum benefit, student leadership must also be connected to the improvement of student learning outcomes (Freeborn, 2000). In addition, the intrinsic value of developing student leadership skills has the potential to positively influence academic achievement and overall success in life (Kearnes & Stephens, 1999). One possible solution that
schools are utilizing to successfully integrate crucial school, work, and life skills is by
incorporating targeted leadership development into the curriculum through the implementation of Stephen Covey’s The Leader in Me (TLIM) program. TLIM is a school-wide intervention
program aimed at developing student leadership skills to maximize student learning potential (FranklinCovey, 2011).
Problem Statement
Schools devote limited resources to various programs and curriculum aimed at improving various student outcomes. Adopting focused programs, such as the youth leadership
development program TLIM, is often costly and time-consuming. It is important to ascertain the effectiveness of available programs so that school leaders can determine the value of such an investment of sparse time and money. It is also important to ascertain specific student
populations and school sites that may benefit from such program adoptions. In addition, teachers are inundated with various curriculum and programs to implement in their classrooms. Too often these programs are not supported by strong empirical research demonstrating effectiveness. It is imperative that school leaders have available data to suggest that the devotion of limited time and resources is valuable and worthwhile (Kerr et al, 2006).
Rationale for the Study
In today’s educational climate, student achievement is measured by federal regulations that mandate state accountability measures. These state accountability measures often take the form of statewide high-stakes assessments. In the State of Florida, these assessments have changed throughout the years as the core curriculum and standards have evolved. Until 2015, all students attending public school in Florida participated in the Florida Comprehensive
mathematics, science, and writing. More recently, this assessment has evolved into the Florida Standards Assessment (FSA). The FSA measures students’ achievement in English Language Arts (ELA), Mathematics, and high school End-of-Course (EOC) subjects. The Florida Department of Education (FLDOE) calculates the percentage of students in each school that scores at the proficient level each year. This percentage, along with other calculation factors that will be discussed, are calculated into schools’ overall school grade each year. Schools can earn a grade of A, B, C, D, or F annually.
Three factors that impact student performance and, in turn, influence a schools’ overall grade attainment, are as follows: socioeconomic status, as measured by free and reduced lunch status; minority status; and rate of school attendance. As research has shown, these three factors significantly influence students’ academic achievement (Finn & Rock, 1997; Roby, 2005; Sirin, 2005). The impact of socioeconomic status, minority status, and student attendance on
FCAT/FSA scores, and on the number of students scoring at or above proficiency level, should be considered when evaluating a school for effectiveness. Each year, schools report the
percentage of students receiving free and reduced lunch and the percentage of students identified as minority to the FLDOE so that the impact of these factors can be considered in the overall reflection of school and district achievement. Additionally, schools maintain data on the rate of attendance of enrolled students, and research indicates that attending school regularly impacts academic achievement (Roby, 2005). Since families and other stakeholders use school grade as a measure of a school’s effectiveness and overall instructional quality, it is important that schools work deliberately to positively influence their school grade (Figlio & Lucas, 2004). One way to do this is to implement targeted programs that seek to mitigate the negative influences of low socioeconomic status, minority status, and rate of attendance. In addition, it is vital that schools
implement these focused interventions for a minimum of three years if long-lasting, positive change is to become systematic and effective school wide (Fullan, 2000).
Purpose of the Study
The purpose of this study is to examine the influence of a youth leadership
development program, specifically TLIM program, on school grades so that school leaders can identify specific school sites based on student demographics for which the implementation of the program will have the greatest positive impact on student achievement. Additionally, this study will examine the influence of key student demographics, such as free and reduced lunch rate, minority rate, and student attendance rate on school grades so that school leaders can understand the impact of these factors on overall school achievement and school grade attainment.
Research Questions and Hypotheses
This study aims to answer the following research questions:
(1) What impact does the implementation of a youth leadership development program, specifically TLIM program, have on school grades over time?
(2) What impact does the implementation of TLIM have on academic achievement as measured by the English/Language Arts, mathematics, and science FSA scores over time?
(3) Which school environments may be most conducive to achievement growth through the implementation of The Leader in Me (TLIM) when examined through FL school grades and key student demographics?
The central hypotheses of this study are: the implementation of TLIM program will increase school grades over time; the percentage of students scoring at proficiency level or higher on state mandate assessments of students achievement will increase with the
implementation of TLIM; and as the free and reduced lunch rate, minority rate, and chronic absenteeism rate increases, the overall school grade will decrease.
Significance of the Study
The significance of this study is to aid school leaders by providing empirical data to support decisions related to program adoption, specifically, in identifying whether TLIM program impacts school grade designation, and in identifying schools based on student
populations as possible candidate schools for the TLIM program implementation. Also, a large volume of research exists that examines the impact of low socioeconomic status, most often measured by free-and reduced lunch qualification in K-12 education, the impact of minority status, and the impact of regular school attendance on numerous student outcomes. Very little research exists that examines these impacts from a youth leadership perspective. This study aims to add to the literature research that examines the implementation of a youth leadership
development program and the impact on school grades and academic achievement, as well as the impact of free and reduced lunch rate, minority rate, and attendance rate on school grades, which represents student academic achievement as measured by state mandated high-stakes
assessments, as viewed through a youth leadership lens.
Study Definitions
Attendance. Being present at the assigned school during the prescribed count time when
school is scheduled to be in session (Florida Department of Education, 2016). In the State of Florida, students who miss 21 or more days of school in an academic year are considered chronically or excessively absent. Florida schools and districts must report to the State annually the number and percentage of students that are chronically absent (Balfanz & Byrnes, 2012).
Free and Reduced Lunch/Meal Plans. A federal meal plan program, named the
National School Lunch Program (NSLP), regulated by the United States Department of Agriculture that provides nutritionally sound meals to students attending public schools, nonprofit private schools, and childcare institutions at a reduced or free rate based on family income guidelines (United States Department of Agriculture, 2017).
Minority Status. A student’s ethnic and/or racial family identity as reported by
parents/guardians (Miller-Cotto & Byrnes, 2016).
School Grades. The assignment of an overall grade of “A,” “B,” “C,” “D,” or “F” by a
State Department of Education to evaluate school effectiveness based on students’ performance on standardized assessments (Figlio & Lucas, 2004).
Socioeconomic Status (SES). The social and economic status of a student based on
common factors, which include parental income, parental education, and parental occupation (Sirin, 2005).
Student. A child or young adult that attends a kindergarten to grade 12 school.
The Leader in Me (TLIM). A whole school transformation process that establishes a
new paradigm for which school leaders and staff view student leadership development (Covey, Covey, Summers, & Hatch, 2014).
Youth Leadership. Leadership characteristics, qualities, experiences and/or activities as
Chapter 2: Literature Review and Framework Organization of the Literature Review and Framework Chapter
This literature review chapter begins with the conceptual framework of TLIM, including a discussion on the central concepts and theoretical foundations of the program, and the
application of the program in k-12 schools. The literature review section will follow with sections discussing the topics of staff and teacher leadership, youth leadership, school grades, socioeconomic status as measured by free and reduced meal plans, minority status, and school attendance. The chapter will close with a conclusion.
Conceptual Framework Central Concepts of The Leader in Me
The Leader in Me (TLIM) is a whole school transformation process that establishes a new paradigm for which school leaders and staff view student leadership development (Covey,
Covey, Summers, & Hatch, 2014). The central premise of this framework is that every child is a leader and capable of achieving greatness. FranklinCovey (2011) believes that TLIM program promotes the mindset that all people are cable of becoming a leader, that every person has
genius, and that change starts at the individual level. The program approaches education from the stance that educators need to develop the whole learner as it relates to the mind, body, heart, and spirit (Covey et al., 2014). In addition, the program fosters the belief that leadership is not a hierarchical model of leader positions but rather a culture where every person has the opportunity
to assume leadership roles (Fonzi & Richie, 2011). This goal is accomplished through the empowerment of each student to meet his or her learning potential (FranklinCovey, 2011).
More specifically, TLIM is a program adapted to the school environment by Stephen R. Covey (1989) based on his bestseller, The 7 Habits of Highly Effective People. Covey believed that these habits, or guidelines for human behavior, should be at the core of everything we do and should guide our personal, professional, and spiritual aspects of our lives (Branham, 1997). In addition, these habits apply to people from all backgrounds, regardless of ethnicity, race, religion, age, gender, class, or disability (Covey el al., 2014). Covey’s seven habits are just that, specific habits for which people engage in their daily lives to maximize their full potential (Branham, 1997). Covey (1989, 2004) identified these habits as the following: (1) be proactive; (2) begin with the end in mind; (3) put first things first; (4) think win/win; (5) seek first to
understand then to be understood; (6) synergize; and (7) sharpen the saw. TLIM program utilizes administrators’, school staff, and teachers’ innovation and creativity to infuse these seven habits into the curriculum, traditions, and culture of the whole school.
In an interview with Time magazine’s Kathleen Kingsbury (2008), Covey explained that the habits he teaches become a value system for the students that can be reinforced through the academic subjects. He believed that the needs of the whole child are ignored when such a strong emphasis is placed on passing state tests. Through TLIM program, critical social skills are acquired and character development is achieved. Also, by instilling the first habit of being proactive, for which Covey equates to accepting responsibility, this establishes a necessary foundation on which to build the remaining habits.
While the incorporation of the program into the school culture is meant to vary by individual school based on need and circumstances, the process for implementing the program
spans the same three-year process (Fonzi & Richie, 2011). The first year focuses on introducing the 7 habits to the students and the staff. The second year involves introducing innovative and creative tools and methods to promote the fundamental meaning of each habit and the application of the habits throughout the school environment. This step is where teacher and staff innovation and creativity are highly prized and necessary components of program implementation. The final, third year focuses on follow-up training from FranklinCovey staff to renew and revamp the habits and practices applied in the school setting.
Theoretical Foundations of TLIM
Researchers have analyzed existing literature to identify the theoretical foundations of TLIM program. Fonzi and Ritchie (2011) identified two main theories as central to the conceptual design of TLIM program. Those theories are related to systemic reform and social and emotional learning. Systemic reform positions change as a system of the whole organization, or in this case, the whole school. More specifically, new is not brought in to replace the old, but rather the current system is reenergized through updated, innovative means of improving multiple components of the whole (e.g., classrooms, teachers, students, administrators, schools) (Carr-Chellman, 1998). TLIM promotes a whole, school-wide transformation process towards positive change in students and in school culture.
Social and emotional learning focuses on improved behavior traits that positively influence success both inside and outside of the school environment. Fredericks (2003) conceptualized social and emotional learning as “the process through which people learn to recognize and manage emotions, care about others, make good decisions, behave ethically and responsibly, develop positive relationships, and avoid negative behaviors” (p. 4). These
characteristics of socially-emotionally evolved learners describe the overall aim of TLIM program towards all students achieving success and greatness through leadership experiences.
Application of TLIM
The FranklinCovey Center for Advanced Research (2011) investigated the outcomes of a school-wide implementation of TLIM program. The Fremont Elementary School in Salt Lake City, Utah serves a diverse student population, half of who qualify for free and reduced meal plans. The area houses a large number of immigrants who move to the neighborhood due to its relatively inexpensive housing market. The Fremont Elementary School and its district had not met Annual Yearly Progress (AYP) in five years when the auditors arrived. While the aim of the auditors was to discover the areas needed for improvement, the school was pleased to have been praised at the conclusion of their examination. The auditors attributed the school’s
implementation of TLIM program as the main reason for the high performance. The specific areas noted as being high-performing were as follows: on-task behavior; positive learning climate; rapid student vocabulary growth; timely feedback to students; differentiated instruction; a 60 percent decline in disciplinary referrals; high academic expectations; parental satisfaction; teacher instruction; and use of instructional materials. Many of these outcomes have been linked to increased academic achievement in the research.
Other schools that have implemented TLIM program have also noticed increased
performance in these same areas. Hollingsworth (2013) interviewed Emily Cross, the principal of Indian Trails Elementary just outside of Kansas City, Missouri. Cross had witnessed a decrease in student discipline referrals and an increase in students’ taking responsibility for his or her behavior. Cross explained that when a student is questioned about their misbehavior, the teacher specifically asks the student which of the habits could have helped the student in that situation.
Cross also added that students are deliberately assigned leadership roles and actively track their academic achievements in a leadership notebook. These are huge motivators for some students, claims Cross. Through the application of the seven habits, these students had tracked their successes and demonstrated the desire to continue their upward trend. This built their intrinsic desire to continue down the change path to becoming well-rounded, highly successful
individuals.
Branham (1997) proposed that when considering how best to apply the seven habits in a school setting, whether it is with students or with groups of professionals working together, he borrowed from Covey and said it is best to keep the end goal in mind. Once decided how these habits will help to achieve the overall school goals, then it is time to prioritize how best to begin implementing the habits. He stressed the importance of being proactive in the process, which happens to be habit number one, and not waiting for the program to find the school, but for the school to seek out the needed resources. Finally, Branham reminded us to think win-win and examine how each of the key players can best utilize their skills and talents to help promote a successful implementation of the program.
While Branham discussed key points in implementing a more formal, school-wide initiative, it is equally as possible to implement the habits in an individual classroom. Anderson (2000) shared her more informal approach of implementing the habits in her class. Through a guided approach based on literature- and history-focused discussions, her elementary students discovered ties between the materials they were studying and the 7 Habits. At the end of the year, she asked the parents to complete a survey. The survey revealed that most parents viewed their child as being more serious about school, the children were more tolerant of others, and they were more persistent in keeping with a difficult situation. Some parents even reported that
their child seemed more positive and happy overall. Anderson attributed these gains to the student’s application of Covey’s 7 Habits in her classroom.
To understand how TLIM, a targeted intervention program focusing on youth leadership development, could potentially lead to positive student outcomes, such as increased academic achievement, a review of existing literature is required.
Literature Review Staff and Teacher Leadership
For change initiatives to take hold, individuals at all levels of an organization must be involved, and fully engaged, in improvement efforts and leadership development (York-Barr & Duke, 2004; Smylie & Eckert, 2018). In school settings, these individuals may include
principals, teachers, support staff, administrative assistants, custodians, and cafeteria staff. York-Barr and Duke (2004) asserted that leadership development of school staff members improved employee participation and increased commitment towards common organizational goals.
Smylie and Eckert’s (2018) research into organizational leadership development revealed the following observations: leadership development is a systemic process and is socially
influenced; developing new leadership practices often involves establishing a new system for leadership development; leadership development must sit at the center of the organization and be fully integrated into the daily workings of the organization; and the practice of leadership must be present. These key factors of leadership development connect directly to the intent and process of TLIM.
Teacher leadership development, in particular, has been heavily researched and the benefits have been reported in the literature. It has been viewed as a catalyst for change efforts and is critical to implementing and sustaining curriculum and intervention initiatives within
schools (Sinha & Hanuscin, 2017). The central premise of teacher leadership development places teachers as central figures in the daily operation and success of the school (York-Barr & Duke, 2004). Smylie and Eckert (2018) proposed that, for a model of teacher leadership development to be successful, and perhaps successful for the development of leadership opportunities for all school staff, the process must be systemic in nature, placed at the center of school focus, provide ample practice of leadership skills, and should consider the implications for individuals and overall organizational change. By focusing on teacher leadership development specifically, school leaders aim to increase student academic achievement and other student outcomes through continued improvement of instruction and learning (York-Barr & Duke, 2004; Poekert, Alexandrou, & Shannon, 2016). Through an examination of literature related to teacher
leadership development, best practices can be identified on growing leadership skills and opportunities for all school staff.
One important factor in teacher leadership development is the self-perception individuals’ hold regarding their own status as leaders (York-Barr & Duke, 2004; Hunzicker, 2017; Sinha & Hanuscin, 2017). Teachers, specifically, have reported that they do not believe themselves to be leaders within their schools. One reason as to why teachers may not view themselves as leaders is because leadership is a mind-set and a way of being, rather than specific behaviors or titles (Hunzicker, 2017). How teachers evolve their formal notions of leadership involves deliberate, focused development of leadership knowledge and skills, and increased opportunities to practice leadership within their school communities (Hunzicker, 2017; Sinha & Hanuscin, 2017).
Sinhas and Hanuscin (2017) conducted a study with three teachers, all with varying years of teaching experiences, who participated in 300 hours of professional development across a three-year period, which targeted leadership development and opportunities for practice. These
researchers found that all three teachers expanded their views of leadership by the end of the study. Initially, these teachers viewed leadership as a formal position, with either a title or a position of authority, as a top-down hierarchy, or as taking-charge or action. One teacher viewed leadership as involving followers who accepted direction without question. By the end of the study, all three teachers changed their view of leadership to incorporate much less formal ideations of leadership. They also recognized that holding a position of authority did not necessitate the making of a leader. In addition to expanding their views of leadership, all three participants expanded their leadership practices and activities, and they transformed their ideas of leadership into a way of thinking and being. These leadership activities included opportunities to practice leadership both inside and outside of the classroom in new ways. When teachers, and other staff members, identify leadership as a mind-set and a way of being, and they recognize that they, too, are leaders within their school communities, they become aware of their role as change agents for the school and for increasing student outcomes (Poekert, Alexandrou, & Shannon, 2016; Flores, 2018).
Another important factor in teacher leadership development is the manner in which a school fosters leadership development. Flores (2018) surveyed 2,702 teachers and found that a key element of successful leadership development involved the use of a school-based program aimed at growing and developing leadership knowledge, skills, and opportunities for practice. A systemic effort towards school-wide improvement was also noted in a study conducted by Poekert, Alexandrou, and Shannon’s (2016). Their findings suggested that when teachers had adequate leadership development, ample opportunities for leadership practice, and a supportive school environment that fostered leadership growth and implementation on a systemic level,
these teachers became central to school-wide efforts of policy reform aimed at improving student outcomes and achievement through an emphasis on leadership development.
While theory and inference suggest potential links between teacher leadership
development and improved student learning outcomes, little empirical evidence exists to connect the two in an undisputed way. An examination of two decades of research on teacher leadership conducted by York-Barr and Duke (2004) revealed that other relevant connections exist to suggest possible effects on increased student outcomes. One such connection relates to the creation of a more democratic learning environment. When schools value shared-decision making and leadership development, two significant democratic ideations, then students begin to believe in, act on, and sustain, those values, thus resulting in increased student engagement (Barth, 2001). A second relevant connection links student outcomes to teacher leaders as being positive influencers of other teachers and school personnel. Teacher leaders became a resource for other staff in regard to instruction, student issues, and program implementation. In addition, these leaders participated in school-wide policy and curriculum decision-making, which
impacted positively the learning environment for students (Ryan, 1999). Additional connections were found between teacher empowerment and positive effects on student learning and school as a professional community. York-Barr and Duke (2004) conclude that, “teacher leadership is the process by which teachers, individually or collectively, influence their colleagues, principals, and other members of school communities to improve teaching and learning practices with the aim of increased student learning and achievement” (p.p. 287-288). This framework, and the results of this study along with the results of other studies discussed in this section highlight the benefits of active leadership development and practice, and support the use of a whole-school leadership
intervention that places leadership development at the center of the school, such as TLIM program.
Youth Leadership
Van Linden and Fertman (1998) viewed leaders as those who “think for themselves, communicate their thoughts and feeling, and help others understand and act on their own beliefs” (p. 17). While this seems like a relatively simple concept, in practice this mindset can be difficult to achieve, especially for youth. Youth are denied decision-making power and are often not permitted to represent their thoughts or beliefs freely (Lesko, 1996). Youth are reminded to respect authority and obey the rules set forth by their families, schools, and peer groups. When youth are afforded the opportunity to express their thoughts and act on their beliefs, positive outcomes have been noted in the research. Through participation in activities that promote leadership, positive relations have been found between these leadership opportunities and a sense of ownership, a connection between academic learning and real-world application, and a
reduction in student boredom (National Research Council, 1988).
Research has shown that students believe that leadership is important to them, important in their school lives, and important for future career success (Anderson & Kim, 2009). These youth also place more importance and attention on the areas where they receive leadership education. Many students reported receiving the majority of their leadership experiences through the school environment, church, sports teams, and work (Anderson & Kim, 2009). It is important that researchers examine these settings to identify what works in leadership education and what aspects of leadership training are unsuccessful.
Participation in extracurricular activities has been a successful means of promoting leadership skills in adolescents. Approximately 83% of adolescents aged 12-17 participate in at
least one extracurricular activity at school (Moore, Hatcher, Vandivere, & Brown, 2000). Involvement in community activities lags behind participation in after-school activities,
according to Anderson and Kim (2009). They reported that almost one-half of their 284 student participants reported having no involvement with community activities. These data demonstrate the need for ample opportunities for leadership skill development to exist in the school setting. Leadership experiences at school have also been found to improve students’ sense of self-worth and positive self-concepts in areas of social interactions and academics (Bloomfield & Barber, 2011). Increased school engagement and academic achievement has also been noted (Fredricks & Eccles, 2006). Eccles and Templeton (2002) found that as students had more opportunities to assume leadership roles, the stronger these positive associations were shown. These are
promising results that support the notion that targeted youth leadership development programs, such as TLIM, could positively influence student academic achievement.
School is not the only environment that influences students’ acquisition of leadership skills; what occurs at home is also impactful. Parental support was found to be a significant predictor of students’ perceptions of their leadership skills (Hancock, Dyk, & Jones, 2012). This can be extended to include parental support of a student’s participation in extracurricular
activities, as well. This finding can also apply to support stemming from coaches and adult mentors of these extracurricular activities. Also, positive leadership self-perceptions resulted when students were given leadership roles, such as team captain, in their activities (Hancock, Dyk, & Jones, 2012).
It is important to note that too much emphasis has been placed on awareness of
leadership skills in the past as opposed to interaction and integration of leadership skills in real-world situations (Anderson & Kim, 2009). By promoting the use of leadership skills in everyday
situations, instructors can help increase student academic and civic engagement. Also, to foster leadership skills needed in adult life, curriculum should encourage youth-adult partnerships (Hancock, Dyk, & Jones, 2012). These partnerships could involve parents, coaches, mentors, and teachers. Researchers recommend utilizing a leadership education curriculum that emphasizes content and experiential learning (Anderson & Kim, 2009). Also, students should be afforded the opportunity to play an active role in developing their leadership through youth-driven activities and leader roles within those activities (Hancock et al., 2012). It is also important that curriculum be evaluated for comprehensiveness and effectiveness.
To engage students in leadership roles, we must first understand what leadership means to them (Mortensen, Lichty, Foster-Fishman, Harfst, Hockin, & Warsinske, 2014). This may, in turn, promote buy-in from youth and spark excitement and motivation in them to assume greater leadership roles. Culp and Kohlhagen (2000) found that the common leadership characteristics identified by youth are listening to others, being a good role model, and helping others. The researchers also found that adults typically identified the ability to speak confidently in front of people and being responsible as the main characteristics of a leader. If a leadership curriculum was to be developed around what adults consider to be important leadership characteristics, then the mark would be sorely missed.
Youth view leadership with much less focus on authority and power than do adults (Mortensen, Lichty, Foster-Fishman, Harfst, Hockin, & Warsinske, 2014). Mortensen et al. (2014) found that students most frequently conceptualized leadership as: available to anyone in any context; creating change; collective action; modeling and mentoring; and strong character. It could be reasonable to suggest that leadership programs consider students own perceptions of
leadership and incorporate those characteristics and concepts into future models for leadership education.
Research has supported the notion that students involved in leadership opportunities demonstrate qualities of caring and giving individuals (Hawkes, 1999: Lineburg & Gearheart, 2008; McNae, 2011). Student values and behaviors are influenced positively by leadership experiences (Hawkes, 1999). Also, students develop a sense of service towards other and towards the school community when they are actively involved with leadership education (McNae, 2011). Students feel they have a stake in decision-making when in the leadership process (Lineburg & Gearheart, 2008). Also, the student leaders become positive role models for young students and create an atmosphere of positive contribution to peers, the school, and the community.
Hawkes (1999) posited that student leadership has “the capacity to influence student values, attitudes, and behaviors with an effectiveness that school principals can only dream about” (p. 21). For this vision to be actualized, student leadership must also be connected to the improvement of student learning outcomes (Freeborn, 2000). In addition, the intrinsic value of developing leadership skills has the potential to positively influence academic achievement and overall success in life (Kearnes & Stephens, 1999). Student leaders become future problem solvers, decision-makers, and communicators, thus resulting in increased positive student outcomes.
Based on these data, it is possible that such focused approaches to fostering leadership development amongst youth, such as TLIM program, could lead to increases in students’ academic achievement. One common measure of student achievement, specifically in the core subject areas, is state mandated standardized assessments. Within the last 15 years, these test
scores have been used to evaluate the effectiveness of school programs nationwide. One method that has been used by some states is the assignment of an annual overall school grade.
School Grades
In 2001, the federal government enacted new legislation related to school accountability. The No Child Left Behind Act (NCLB) required states to evaluate school effectiveness based on students’ performance on standardized assessments (Figlio & Lucas, 2004). For some states, this resulted in school report cards and overall school grades based on student achievement on these statewide test measures. The federal government tied federal school dollars to this mandate and required states that received these funds to comply with the new legislation. In addition, NCLB required states to develop school choice options for schools that did not demonstrate proficiency on the measures of student achievement. These school report cards and school grades are
published annually on state department of education websites, as well as available on school and district websites. Research has shown that parents, communities, and stakeholders use this school accountability data and school grades to evaluate the effectiveness of their neighborhood schools and to make educational decisions for their children.
Schneider and Buckley (2002) studied parents’ Internet searches as it related to preferences in school characteristics based on these published data. They examined the first five “moves” made on a district school’s website. They found that the top three attributes searched were student body, location, and test scores. These results support the idea that test scores and school location are primary concerns of parents seeking school placement for their children. The use of school grading systems allows parents to obtain that information quickly and use it to make education related decisions for their families.
School grades have influenced how families make decisions related to buying homes and how these decisions relate to specific school zones. In Florida, the mandated system of school accountability began as early as 1999. Governor Jeb Bush enacted his A+ education plan that assigned schools a letter grade of “A,” “B,” “C,” “D,” or “F” based largely on students’ performance on the state mandated assessment, the Florida Comprehensive Assessment Test (FCAT). Schools that scored an “A” were eligible for additional per pupil monies, while schools that scored an “F” twice within a four year period were required to offer school vouchers so parents could send their children to higher performing schools within the district (Figlio & Lucas, 2004). Figlio and Lucas (2004) questioned whether the Florida housing market was impacted by the assignment of these school grades. They examined similar elementary schools with similar attributes that earned grades of “A,” “B,” and “C.” They did not examine the lowest performing schools because they felt that the “D” and “F” schools, and the neighborhoods where those schools were located, were fundamentally different than the schools scoring at the top three levels. What they found was that immediately following the introduction of the school grades in 1999, homes in “A” school zones sold for roughly 19.5 percent more than did homes located in “B” school zones. Homes located in “C” school zones sold for 15.6 percent less than the homes sold in “B” schools zones. These findings support the notion that school grades influence the housing market and families’ decisions related to school placement.
Since better schools are often located in better neighborhoods, Black (1999) attempted to control for the variations in property tax rate and school spending by examining the housing market on opposite sides of school zone boundaries. What she found was that parents are willing to pay 2.1% more for a house if it will result in a 5% increase in elementary school test scores.
These results indicate that parents view higher test scores, and school grades, as representing better, higher quality schools.
Other states have implemented similar systems of accountability. When the Charlotte-Mecklenburg School district had to implement its first round of school vouchers in 2004 because of low performing schools, the district informed parents of the possible school choices and listed each schools’ average test score on the state mandated reading and math assessment. Hastings and Weinstein (2008) examined the outcomes of this district’s school choice plan and the distribution of this detailed information to families. The researchers found a significant increase of lower-income families choosing to move their children to the higher performing districts when they received the test score information. This finding supports the argument that parents use test score data to make informed decisions related to their children’s school placement.
Similar studies have occurred in other countries. Andrabi, Das, and Khwaja (2017) examined the impact of distributed school report cards and average test scores to parents in 112 villages across Pakistan. Half of the sample received this detailed school achievement
information and half of the sample did not receive the information. The researchers found that parental knowledge increased and perceptions of school quality became linked to higher test scores. Additionally, learning improved across the villages that received the school report cards by 42 percent compared to the villages that did not receive them. Private school fees declined as a result because of the increased competition, and the overall school enrollment increased by 3 percent in the villages that received the school report cards. Also, private schools with the lowest test scores were more likely to shut down in the villages where parents received the information because those families chose other higher-achieving schools in the village. These results indicate that informed parents act on the information they receive, especially when it relates to their
children’s academic achievement. One factor that has the potential to negate this claim is a family’s socioeconomic status. Parents with lower levels of education, higher levels of poverty, and lower status occupations may have less access to vital school information, may have limited school options for their children, and may have weaker relationships with school personnel to ensure that their children are maximizing their learning potential.
Socioeconomic Status as Measured by Free and Reduced Meal Plans
The influence of socioeconomic status (SES) on academic achievement has been heavily documented in the research over the past century (Harwell & LeBeau, 2010). One hundred years of studies has shown that SES has been, and remains, a strong predictor of student academic success in the k-12 learning environment (Sirin, 2005). Researchers have debated the conceptual meaning of SES for some time; however, three common factors relate to a student’s SES, which include parental income, parental education, and parental occupation (Sirin, 2005). To classify a student as “low” socioeconomic status typically refers to a student who lives in a household whose parent or guardian has less income, education, and occupational status as a student from a “high” socioeconomic status (Harwell & LeBeau, 2010). In addition, low socioeconomic students often have less access to social and cultural capital, which have been linked to students’ educational success (Walpole, 2003).
One way that schools measure SES is through the qualification for free and reduced meal plans. The United States Department of Agriculture oversees the National School Lunch Program (NSLP), that provides nutritionally sound meals to students attending public schools, nonprofit private schools, and childcare institutions at a reduced or free rate (United States Department of Agriculture, 2017). Families apply to the NSLP and must meet income
requirements to receive free or reduced school lunch (and breakfast) for their children. Table 2.1 shows the income guidelines for the current 2018-2019 school year.
Table 2.1
2018-2019 Annual Income Eligibility Guidelines for Reduced Meal Plans and Free Meal Plans for the 48 Contiguous States, District of Columbia, Guam, and Territories
Household Size Federal Poverty
Guidelines (FPG) Reduced Price Meals – 185% of FPG – 130% of FPG Free Meals
1 12,140 22,459 15,782 2 16,460 30,451 21,398 3 20,780 38,443 27,014 4 25,100 46,435 32,630 5 29,420 54,427 38,246 6 33,740 62,419 43,862 7 38,060 70,411 49,478 8 42,380 78,403 55,094
For each additional
family member, add 4,320 7,992 5,616
Note. Adapted from “Child Nutrition Programs: Income Eligibility Guidelines (July 1, 2018 – June 30, 2019),” by United States Department of Agriculture, May 2018, Retrieved from https://www.govinfo.gov/content/pkg/FR-2018-05-08/pdf/2018-09679.pdf
The use of free and reduced meals as a measure of SES is regularly used in research due to the relative ease of finding these data and the relation of qualification for the program to the federally established poverty guidelines, thus indicating low income status (Harwell & LeBeau, 2010). Harwell and LeBeau (2010) argued that the intent of the NSLP was to improve student nutrition amongst the poorest students to improve learning. Studies have shown the relationship between participation in the NSLP and students’ education. Hinrichs (2010) examined this relationship as it pertained to highest level of educational attainment. He
suggested that increasing NSLP exposure by 10 percentage points increases years of educational attainment for both women and men by 0.365 years and almost 1 full year respectively. He
suggested the reason for this could be that receiving a guaranteed meal at school each day attracted students to attend more regularly.
Research supports the theory that student attendance increases with the provision of free or reduced meals. Afridi (2010) investigated the impact of India’s national free school meal program as it transitioned from raw food grains to free cooked meals on primary students’ participation rates as it related to school attendance and enrollment. He analyzed school
attendance of 79 primary schools and 10 private schools and found an increase in attendance rate of girls in first grade by 12.4 percent in the schools that received the hot meals. The impact of boys’ attendance in grade one was statistically insignificant. An increase in enrollment was not observed in this particular study, but Afridi believed that free meal programs, specifically cooked meal programs, could be used to incentivize families to enroll their children in school, particular the lower income families. These results suggest that the provision of free meal plans increases the daily attendance of students and could potentially motivate non-attending families to send their children to school because they feel secure knowing their children will be fed.
Food insecurity has been linked to lower academic achievement in the literature. Houston, Marzette, Ames, and Ames (2013) examined the relationship between food insecurity, participation in the NSLP, and academic achievement. They conceptualized food insecurity as the limited or uncertain availability of nutritious, safe food products due to limited financial resources. Children raised in these homes are at increased risk of lower academic achievement and increased difficulties in the areas of social and emotional development (Cook & Frank, 2008). The NSLP is one means of mitigating the negative impact hunger and poverty can have on students’ academic achievement. Houston et al. (2013) examined data available on the Georgia’s school report cards related to 5th grade students’ achievement on the state mandated
assessments and their low socioeconomic status as indicated by receiving free or reduced meal plans under the NSLP. The results of this study support other findings in the research that suggests as the student poverty rate increases, the achievement scores decrease. More
specifically, they found that as the poverty rate increased by 1 percent, the achievement scores decreased by a multiplicative rate of 0.7692. In the year examined in this study, more than 57 percent of 5th grade students in Georgia were receiving free or reduced meals at school. This rate
had a significantly negative effect on testing outcomes. The researchers summarized, “thus, the higher the percentage of children receiving free or reduced-price lunches, the lower was the percentage of children meeting standards on the Reading and Math sections of the Criterion-Referenced Competency Test” (p. 37).
This contention is supported in a large volume of research citing the impacts of SES on achievement in school. An examination of numerous studies and multiple meta-analyses revealed that one of the strongest predictors of academic performance is family SES. In addition, school level SES has an even greater impact on academic performance and student achievement (Sirin, 2005). Sirin (2005) discussed the reasons for these strong correlations. Family SES implies the level of support children receive at home in regards to learning and school tasks. The higher the SES, the more equipped parents may be to provide beneficial home support and additional practice. The lower the family SES, the less likely the parents are to have achieved high levels of education and socio-cultural capital. Family SES also predicts the type of learning environment available to the children. The higher the family SES, the greater the likelihood that the family resides in a high achieving school zone. Lower SES families have a high chance of residing in the lower performing school districts. High-SES schools and low-SES schools have been shown to have significant differences in teacher experience, available teaching and learning
materials, and student-to-teacher ratio limits (Wenglinsky, 1998). Finally, family SES impacts the relationship between home and school (Watkins, 1997). Lower SES families may not be as involved in the daily school routine as families from higher SES backgrounds, therefore impacting the relationship between parent and teacher.
The strength of these impacts decreased as the number of minority students increased (Sirin, 2005). This finding suggests that parent education level, income, and occupation status have less influence on academic achievement of minority students than non-minority students. Some studies have shown a stronger correlation between school SES and neighborhood on achievement of levels of minority students (Gonzales, Cauce, Friedman, & Mason, 1996). It is important that literature related to minority status as a separate factor is examined as a predictor of student academic achievement.
Minority Status
The identification of k-12 students as minority status is often tied to parent report of ethnic and/or racial family identity (Miller-Cotto & Byrnes, 2016). Byrd and Chavous (2009, 2011) argued that students’ ethnic and/or racial identity might be a predictor of academic achievement either directly or through such frameworks as motivation and engagement in the learning environment. For the purposes of this literature review, the constructs of ethnic and racial identity is combined into the single construct of ethnic/racial identity (ERI) as proposed by Umaña-Taylor, Quintana, Lee, Cross, Rivas-Drake, Schwartz, Syed, Yip, and Seaton (2014). Theses researchers believed this single construct is appropriate because there is much overlap between the concepts of ethnic and racial identity. For youth specifically, they do not tend to keep their ethnic or racial identities separate, but combine them into a single construct.
Students’ ERI has been linked to positive correlations with academic achievement in the literature. ERI is believed to foster a sense of oneself and positive well-being, which acts as a protective coping mechanism against poor achievement in school (Costigan, Koryzma, Hua, & Chance, 2010). The Mulitgroup Ethnic Identity Measure (MEIM) was developed to assess an individual’s attached meaning and implications of ascribed ethnicity and one’s commitment to their ethnicity. This measurement tool has been used with adolescents to understand the
relationship between ERI and self-esteem, self-efficacy, and pro-social attitudes. Phillips Smith, Walker, Fields, Brookins, and Seay (1999) found that the variables of ERI and self-esteem positively influenced adolescents’ self-efficacy related to academic achievement. These variables also correlated with increased pro-social attitudes related to optimistic perceptions of future academic and career possibilities. These results support Costigan et al.’s (2010) argument that students’ ERI correlate positively with academic achievement by fostering a sense of
understanding oneself and an overall feeling of well-being.
Miller-Cotto and Byrnes (2016) conducted a meta-analysis of 47 studies examining the relationship between ERI and academic achievement. They reported that across studies, students who reported positive associates with their identified ethnic/racial group had higher academic achievement scores. Similar results were found amongst students who reported higher levels of explorations with their ERI. Finally, students who scored higher on the MEIM experienced higher levels of achievement in school. While these studies and results are promising for educators, they do not explain the whole story of ERI as it relates to student academic achievement.
Existing literature also highlights the negative correlation between minority status and academic achievement. The so-called “achievement gap” between white students and minority