Corpus Research: Looking back, Moving ahead. Corpora and Language in Use – Proceedings 1, Louvain-la-Neuve: Presses universitaires de Louvain, 11-23.
Classifying intermediate learner English:
A data-driven approach to learner corpora
Theodora Alexopoulou, Helen Yannakoudakis, Angeliki Salamoura
University of CambridgeAbstract
We demonstrate how data-driven approaches to learner corpora can support Second Language Acquisition research when integrated with visualisation tools. We employ a visual user interface supporting the investigation of a set of automatically determined features discriminating between pass and fail First Certificate in English (FCE) exam scripts. We illustrate how the interface can support the investigation of individual features. The analysis of the most discriminative features indicates that the development of grammatical categories allowing reference to complex events, referents and discourse relations is a crucial property of the upper-intermediate level.
Keywords: discriminative classifier, FCE scripts, grammar.
1. Introduction
Electronic learner corpora are becoming an increasingly important empirical source for research in Second Language Acquisition and Applied Linguistics (Granger 1994 and 2003 among others). The development of computational tools for automatic linguistic annotation and analysis of learner language is also receiving increased attention (Meurers 2009). In this context, our goal is primarily methodological, viz. to demonstrate the relevance of a data-driven approach based on machine learning for two areas: (i) assessment of learner language and (ii) analysis of learner grammar. We demonstrate how data-driven approaches can support research in Second Language Acquisition (SLA) when integrated with visualisation tools. We employ a visual user interface - the English Profile (EP) visualiser (Yannakoudakis et al. 2012) - which supports exploratory searches over First Certificate in English (FCE) exam scripts using automatically determined discriminative features1. In particular, Briscoe
et al. (2010) use machine learning techniques to automate the assessment of the FCE exam. Their model (henceforth ‘the classifier’) exploits textual linguistic features in order to classify a script as passing or failing. A high performance on this task was obtained using a range of features, including part-of-speech (POS) and lexical n-grams. The EP visualiser supports the linguistic analysis of these features: it interactively visualises their co-occurrence, it supports investigation of scripts instantiating them and calculation of statistics about the data. Using this tool, we investigate a number of features and discuss their relevance for characterizing different levels of attainment.
1
The EP visualiser is available upon request ([email protected]) over a sample of FCE scripts (Yannakoudakis et al. 2011).
2. Background
2.1. English Profile and the Common European Framework of Reference Levels Our work is situated in the context of the English Profile Programme2 which aims to create a set of Reference Level Descriptions for English linked to the Common European Framework of Reference for Languages (CEFR, Council of Europe 2001). We approach the creation of that set of descriptors through a comparison of features discriminating pass/fail FCE exam scripts (B2 vs. below B2 CEFR levels).
2.2. Cambridge Learner Corpus
The FCE exam scripts are from the Cambridge Learner Corpus (CLC)3, a database of 50 million words produced by English language learners from around the world who are sitting Cambridge Assessment's English for Speakers of Other Languages (ESOL) examinations4. CLC comprises manually error-coded texts (Nicholls 2003) linked to meta-data about the learners (e.g. native language) and the exam (e.g. grade). FCE assesses English at an upper-intermediate level (CEFR level B2). The FCE writing component consists of two tasks (e.g. letter and report writing) eliciting a piece of 200 to 400 words. An overall grade has been assigned to these answers ranging from A to E (with A being the highest grade; A-C pass and D-E fail grades)5.
3.
Integrating machine learning and visualisation
3.1. Automated Assessment of FCE ESOL exam scripts
To automate the assessment of FCE ESOL exam scripts, Briscoe et al. (2010) use supervised discriminative machine learning methods6. That is, they employ specific algorithms to automatically “learn” models/classifiers from data, and discriminate pass from fail FCE scripts. To facilitate learning of the feature, the data should be represented appropriately with the most appropriate set of (linguistic) features. Briscoe et al.
(2010) found a discriminative feature set that includes lexical and POS n-grams7. To better understand how the model works, we can inspect the features it yields as the most predictive of pass and fail. Table 1 presents a small subset of highly predictive discriminative features. 2 http://www.englishprofile.org/ 3 http://www.cup.cam.ac.uk/gb/elt/catalogue/subject/custom/item3646603/ 4 http://www.cambridgeesol.org/ 5
However, these grades are not reported to learners. Learners are awarded a score for the whole exam, see http://www.cambridgeesol.org/assets/pdf/exams/fce/fce-statement-results.pdf
6
See Manning et al. (2008) for an introduction to machine learning.
7
POS n-grams (e.g. ‘VM_RR’ = modal verb followed by adverb) are extracted using the RASP tagger (Briscoe et al. 2006), which uses the CLAWS 2 tagset.
Feature Type Example Weight
‘VM_RR’ POS bigram could clearly + ‘,_because’ word bigram , because of - ‘the_people’ word bigram the people are clever - ‘NN2_VVG’ POS bigram children smiling +
Table 1. Subset of highly discriminative features
Each feature has a weight, negative or positive, showing its association with either passing or failing the exam. For instance, ‘the_people’ is labelled negative as the definite article should not be used in generic contexts (see Section 4.1). Note that a negative feature may appear in a pass script and a positive feature in a fail one. Thus, a feature on its own cannot discriminate between passing and failing scripts; rather a weighted combination of the full set of features is used to make a prediction.
We propose that such features can offer insights into assessment and the linguistic properties characterizing the upper-intermediate level. However, as they typically capture relatively low-level, specific and local properties of texts (e.g. comma followed by because: ‘,_because’), we need to identify ways to analyse and interpret them in order to evaluate more general hypotheses about learner grammars8. In the rest of this section we address this issue, while in Section 4 we focus on the linguistic interpretation of the features.
3.2. Visualisation
The investigation of discriminative features can offer a more empirical route to describing learner grammars. However, the amount and variety of data made available by the classifier is considerable, typically involving hundreds of thousands of discriminative features. Even if investigation is restricted to the most discriminative ones, calculations of relations between features can grow rapidly and become overwhelming. At the same time, features need to be linked to the scripts they appear in to allow investigation of the contexts in which they occur. The scripts, in turn, need to be searched for further linguistic properties in order to formulate and evaluate higher level, more general and comprehensible hypotheses which can inform reference level descriptions and understanding of learner grammars.
The general appeal of information visualisation is to gain a deeper understanding of important phenomena that are represented in large databases (Card et al. 1999) by making it possible to navigate large amounts of data for formulating and testing hypotheses faster, intuitively, and with relative ease. In our context, the appeal is a tool that visualises discriminative features flexibly and allows statistics about the scripts instantiating them, as well as other linguistic properties to be derived quickly. As the exploration of large amounts of data can quickly lead to numerous possible research directions, a good visualisation tool can speed up the process of identifying the most productive paths to pursue. Moreover, using visualisation techniques over command-line database search tools gives the advantage that SLA researchers, language teachers
8
Many features appear to be “proxies” of some higher order phenomena; for instance, preliminary investigations of ‘,_because’ scripts indicate problems with the organisation of multiclausal sentences.
and assessors, can access information fast and intuitively, without the need to learn query language syntax.
Herein, we employ the EP visualiser (Yannakoudakis et al. 2012), developed to support hypothesis formation about learner grammars. The system incorporates the discriminative linguistic features identified by Briscoe et al. (2010), as well as a command-line Lucene search (McCandless et al. 2010) tool developed by Gram & Buttery (2009).
In the next sections we introduce the EP visualiser, illustrate how it can support the investigation of individual features, and discuss how such investigations can shed light on developmental aspects of learner grammars.
3.3. The English Profile (EP) visualiser
3.3.1. Basic structure and front-end
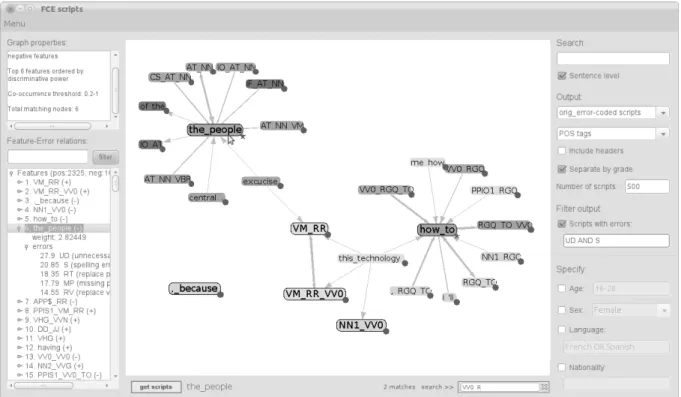
The EP visualiser is developed in Java and uses the prefuse library (Heer et al. 2005) for the visual components. Figure 1 shows the visualiser’s front-end. Features are represented by a labelled node and displayed in the central panel; positive features (i.e. those associated with passing the exam) are shaded in light green, while negative ones in light red (represented as different shades of grey in Figure 1). An important aspect is the display of feature relations, discussed in more detail in the next section (3.3.2).
3.3.2. Feature relations
Crucial to understanding discriminative features is finding the relationships that hold between them. The sentence-level co-occurrences of lexical and POS n-grams are identified in order to extract meaningful relations and possible patterns of use.
Features are grouped in terms of their co-occurrence within sentences in the corpus; co-occurrence relations are displayed through directed graphs9. More specifically, each feature is represented by a node in the graph. Two nodes are connected by an edge if their co-occurrence score is within a user defined range. The co-occurrence score is calculated by taking the proportion of sentences containing a feature that also contain another feature (i.e. the maximum co-occurrence score value is 1). Additionally, directed edges (displayed as arrows) are used in order to visually separate the ones coming into a node from the ones going out. Given two features fi and fj co-occurring in a sentence, the edges going out of fi are modelled by calculating the proportion of sentences containing fi that also contain fj. Feature relations are shown via highlighting of features when the user hovers the cursor over them, while the strength of the relations is visually encoded in the edge width (i.e. the stronger the relation, the wider the width).
9
Visualisation approaches using graph layouts have been effectively used in different applications (e.g. Heer & Boyd 2005; Perer & Shneiderman 2006; Gao et al. 2009; Van Ham et al. 2009).
Figure 1. Front-end of the EP visualiser
For example, consider one of the highest weighted positive discriminative features, ‘VM_RR’, which involves clusters of a modal followed by an adverb as in “will always (avoid)” or “could clearly (see)”. Investigating its co-occurrence relations with other features using a score range 0.8-1, we find that ‘VM_RR’ is related to the following features: (i) POS n-gram 10 : ‘RR_VB0_AT1’, ‘VM_RR_VB0’, ‘VM_RR_VH0’, ‘PPHI_VM_RR’, ‘VM_RR_VV0’, ‘PPIS1_VM_RR’, ‘PPIS2_VM_RR’, ‘RR_VB0’; (ii) word n-grams: ‘will_also’, ‘can_only’, ‘can_also’, ‘can_just’. Such relations show us the syntactic environments of the feature (i) or its particular lexicalisations (ii).
3.3.3. Dynamic building of graphs via selection criteria
Questions relating to a graph display may include information about the most connected nodes, separate components of the graph, types of interconnected features,
etc. However, the functionality, usability and tractability of graphs are severely limited when the number of nodes and edges is more than a few dozen (Fry 2007). In order to provide adequate information but, at the same time, avoid overburdened graphs, the system allows dynamic creation and visualisation of graphs using a variety of selection criteria. The interface supports the investigation of the top 4,000 discriminative features as well as their sentence-level relations.
The Menu item on the top left of the EP visualiser in Figure 1 activates the feature selection panel, which allows users to control the nodes/features to be displayed: they can choose to display positive and/or negative features, set thresholds for, and rank by discriminative power, connectivity with other features (i.e. how many times a feature occurs in the same sentence with other features), and frequency. Highly connected features might tell us something about the learner grammar while infrequent features, although discriminative, might not lead to useful linguistic insights. Additionally,
10
users can investigate feature relations and set different co-occurrence score ranges (see above) to control the edges to be displayed.
3.3.4. Error relations
The FCE scripts are error-coded and so it is possible to calculate relations between discriminative features and errors. The Feature-Error relations component on the left of Figure 1 displays a list of the features, ranked by their discriminative power, together with statistics on relations with errors. Feature-error relations are computed at the sentence level by counting the number of sentences that contain a specific error out of the number of sentences that contain a feature. In the example in Figure 1, we see that 27% of the sentences that contain ‘the_people’ also have an Unnecessary Determiner (UD) error, while 14% have a Replace Verb (RV) error.
3.3.5. Searching scripts
In order to relate features to the data, the system supports browsing operations. Selecting multiple features returns the relevant scripts containing them. Additionally, the system displays a list of the errors found in the retrieved data, ordered by decreasing frequency, including information about counts of lemmata and POS tags marked inside an error.
The right panel of the front-end in Figure 1 displays a number of search and output options. Data can be retrieved at the sentence level and separated according to their grade (A to E). Additionally, users may examine occurrences of specific errors and/or scripts by learners of a particular age and L1.
3.3.6. Learner L1
The Menu item also allows users to display feature statistics per L111. In the near future we expect to carry out a number of longitudinal case studies to evaluate the usefulness of the EP visualiser (in the spirit of evaluation practices discussed in Shneiderman & Plaisant 2006 and Munzner 2009).
4.
Interpreting discriminative features
We now illustrate how the EP visualiser can support interpretation of discriminative features.
4.1. ‘the_people’
The word bigram ‘the_people’ is the 6th most discriminative feature, with a high negative weight. The Feature-Error relations component of the EP visualiser reveals an association with Unnecessary Determiner (UD) errors. Searching scripts containing ‘the_people’ (henceforth ‘the_people’ scripts) provides production examples like the following:
11
A detailed description on the full functionality of the EP visualiser can be found in Yannakoudakis et al. (2012), while a short manual is available at http://ilexir.co.uk/applications/ep-visualiser/.
1. There have been many interesting programmes on T.V. which are very popular among the people.
2. The advertisement said that you were looking for the people who could help your summer camp near my town.
This feature picks on the distribution of bare plurals, predominantly used for denoting kinds (Chierchia 1998; Carlson 1977). The noun people is inherently generic and so linked to kinds and bare nominals in English. Our hypothesis then is that learners overgeneralise the definite article with nominals denoting kinds. This hypothesis predicts that UD errors involve the definite article rather than determiners like some or
any. The interface provides the type of lemmata and POS tags associated with errors. Across all scripts UD errors predominantly involve the definite article (Def.Article:Indef.Article=2.5:1)12. But in ‘the_people’ scripts, this ratio becomes higher (Def.Article:Indef.Article=4.5:1), a fact supporting the article overgeneralisation hypothesis.
Moreover, ‘the_people’ scripts contain more UD errors as a whole (irrespective of the word people). The unnecessary/missing determiner (MD) error ratio (UD:MD) is 0.5 (UD=11,145: MD=22,141) across all scripts; in ‘the_people’ scripts, this ratio goes up to 0.9 (UD=1618: MD=1692). Again, this is evidence for article overgeneralisation. Relations with grade reveal an interesting pattern. The UD:MD is stable across grades in all scripts (modulo Grades D & E, see Table 2). But in ‘the_people’ scripts, the ratio increases from Grade E to A, with Grade E in line with the average of all scripts (0.5).
Table 2. Ratios of Unnecessary Determiner (UD): Missing Determiner (MD) errors across all scripts and in scripts containing the feature ‘the_people’ and across grades
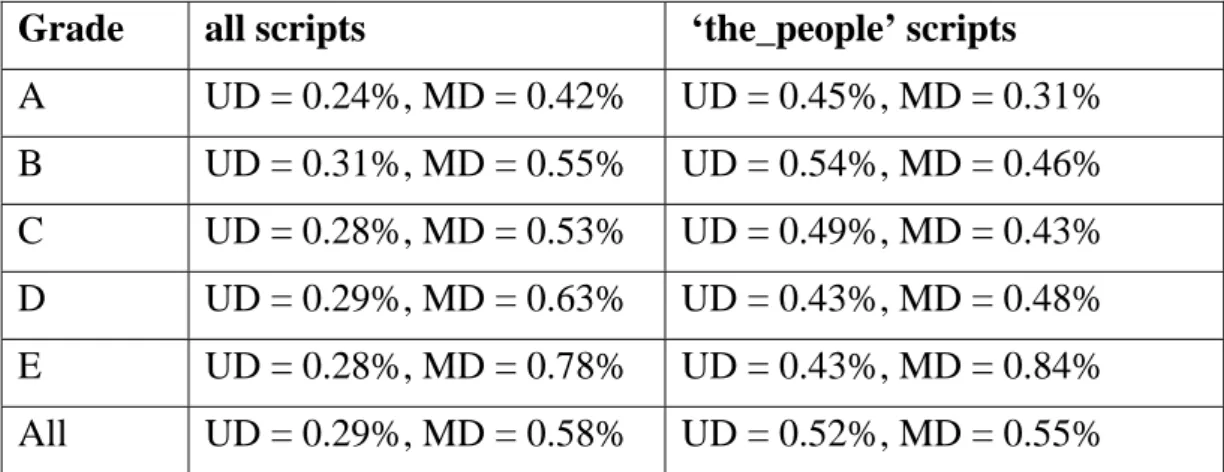
Calculating the percentage of learner errors over the total of words again shows higher rates of UD errors in higher grades (Table 3). While MD errors decrease from lower to higher levels, UD errors show an increasing tendency. Note that if we compare error percentages horizontally, for each grade, we find that the percentage of MD errors in ‘the_people’ scripts is consistently lower than in all scripts, while the percentage of UD errors is consistently higher. This suggests that the overgeneralisation of the definite article may be due to a more systematic production of articles (which leads to decrease in MD errors).
12
This discrepancy is partly due to a being only singular while the is number neutral.
Grade UD:MD across all scripts UD:MD in ‘the_people’ scripts
A 0.5 (1292:2236) 1.4 (224:156) B 0.5 (1788:3088) 1.1 (298:254) C 0.5 (4192:7699) 1.03 (551:534) D 0.46 (2171:4693) 0.8 (313:350) E 0.36 (1201:3265) 0.5 (178:347) All 0.5 (11,145:22,141) 0.9 (1618:1692)
Grade all scripts ‘the_people’ scripts A UD = 0.24%, MD = 0.42% UD = 0.45%, MD = 0.31% B UD = 0.31%, MD = 0.55% UD = 0.54%, MD = 0.46% C UD = 0.28%, MD = 0.53% UD = 0.49%, MD = 0.43% D UD = 0.29%, MD = 0.63% UD = 0.43%, MD = 0.48% E UD = 0.28%, MD = 0.78% UD = 0.43%, MD = 0.84% All UD = 0.29%, MD = 0.58% UD = 0.52%, MD = 0.55%
Table 3. Percentages of Unnecessary Determiner (UD) and Missing Determiner (MD) errors across all scripts and in scripts containing the feature ‘the_people’ and across grades
Let us finally turn to L1 effects and consider the UD:MD ratios in Table 4. L1 German shows the strongest effect, with their UD:MD ratio displaying a very different picture than the average. Further analysis is required to appreciate whether such ratios arise due to an increase in UD errors or decrease in MD errors, a factor particularly relevant for learners from L1s without articles. The preliminary figures in Table 4 illustrate how the EP visualiser and the data-driven approach can point to L1 effects.
Table 4. UD:MD ratio for different L1s
4.2. Delimiting the upper-intermediate level
The 40 most discriminative positive features can be grouped into four main categories:
1. Clusters of modal verbs followed by an adverb: features containing the POS bigram ‘VM_RR’ which relate highly with each other as well as with specific lexicalisations of the modal and the adverb (see Section 3.3.2). The cluster indicates knowledge of modalities and the rather idiosyncratic English word order patterns of modals and adverbials.
2. Complex tense and complex events: (i) complex tense formation (e.g. perfect), (ii) tense subordination (e.g. past verb followed by a to-infinitival clause) and (iii) complex event formation: e.g. ‘would_be’, ‘since’ and ‘VHG_VVN’ (having + past participle).
Language UD:MD across all scripts UD:MD in ‘the_people’ scripts
German 1.1 2.1 Spanish 0.89 1.58 Greek 0.87 1.34 French 0.86 1.1 Chinese 0.37 0.62 Turkish 0.29 0.65 Russian 0.27 0.46
An investigation of scripts shows that ‘would_be’ is used in conditionals; having+VVN is used after prepositions like after for temporal subordination (e.g. “After having spent some days in London, I went to…”), for for tempo-causal subordination (e.g. “I would like to thank you for having chosen this town and hotel”) and because for causal subordination (e.g. “When I hadn’t passed the exam because of having drunk instead of having worked”). ‘Since’ is used both in its temporal and causal sense. Notice that despite being positive, the “complex event” features relate to more tense verb form errors (TV), which clearly illustrates the trade-off that learners often face when they try to use more complex language, leading to more errors.
3. Complex nominal reference/denotations: (i) POS n-grams that are subparts of nominal phrases, mainly including the bigram ‘DD_JJ’ (determiner followed by adjective); their main characteristic is the lexicalisation of DD as some, any, another,
what, which, indicating competence with quantificational elements in semantically complex nominals. (ii) The one lexical n-gram in this set is the indefinite pronoun ‘ones’ (e.g. “better than the old ones”) used for discourse reference to indefinite antecedents. (iii) ‘NN2_VVG’, plural noun + gerund again reflects complex nominals either with postnominal modification, e.g. “more people thinking that keeping…”, or with controlled objects, e.g. “looking at the boats arriving and going away”.
4. Operators: the co-ordinating ‘and’ and ‘or’ in sentential and constituent co-ordination, subordinating ‘although’ and ‘as’. Such operators indicate productions of higher complexity linking different syntactic sub-structures. Further, the focus operator ‘even’ is word unigram reflecting knowledge of both Information Structure and syntactic structure; examples from scripts show use in a variety of environments: sentential subordinator (e.g. “even though he isn’t”), with prepositions (e.g. “you can find him even at the defense line”), verbs (e.g. “I didn’t even want to”), adverbs (e.g.
“even more impressively”) and adjectives (e.g. “and even fewer people”).
In sum, positive features indicate growth of functional grammatical elements which allow: (i) talking about complex events through the mastery of modals and complex tense forms, (ii) talking about complex referents through the use of quantificational adjectives/determiners and (iii) linking complex substructures and indicating Information Structure through the use of operators. Growth of such functional categories naturally leads to a more competent organization of semantic information and the pragmatic aspects of discourse. Thus, these features, though grammatical in themselves, also point to semantic and discourse knowledge.
Let us now turn to the negative features which can be split into two broad categories:
1. Verbal agreement/tense verb forms: these features refer to basic agreement and tense errors, as is evident in their higher error relations: e.g. ‘NN1_VV0’ as in “John buy”, ‘VM_VVD’ as in“can worked”. Though some modals and gerunds are involved, negative “verbal” features do not mirror the complexity of positive features.
2. Nominal forms: Negative features relating to nominals point to basic errors in building noun phrases evident in high relations with MD and UD errors: e.g.
‘RG_JJ_NN1’, as in “very good boy”, is related to MD errors (see Yannakoudakis et al.
2012 for more details); further, quantificational determiners are absent. Two lexical n-grams, ‘the_people’ and ‘informations’ relate to semantic aspects of nominal phrases: the former to the realization of kinds and the latter to the count noun/mass noun distinction.
If negative features are related with errors, one can wonder why individual errors are not discriminative. For instance, ‘NN1_VV0’ is related with Verb Agreement errors (AGV) 27.5% of the times it occurs; why then are AGV errors not discriminative? A cursory search of the scripts indicates that ‘NN1_VV0’ clusters may be given various error tags: TV (Verb Tense errors) as in “and the day on which she will give the money she took and the policemen but kidnapper understand||TV: understood that he took my sister’s child”, or RV (Replace Verb errors) as in “during my life I have worked for a company which produced shoes but my employer solve ||RV:dissolved because he had financial troubles”. The erroneous verb forms suggest problems with tensed verb forms of which the (non-)agreeing ones are only a subset; in other words, ‘NN1_VV0’ seems to capture a category of finiteness/tense that has a wider range than any one of the verb form error tags.
Finally, unlike positive features which show increasing percentages from Grade E to A, negative features do not consistently drop in higher grades. We speculate that this is due to the fact that negative features tend to systematically relate with errors. Errors have been shown to fluctuate considerably until the highest attainment levels (Hawkins & Buttery 2009 2010; Hawkins & Filipovic 2012). Similarly, Thewissen (2011) shows that errors display mixed patterns of stabilisation and progress at intermediate levels and, hence, can only partially discriminate levels.
In sum, unlike positive features, negative features are linked to basic tense and noun-phrase formation errors. It appears then, that the top positive and negative features point to the upper and lower boundaries of the language produced by FCE candidates. Basic tense formation and noun phrase building are a prerequisite for this level, while the ability to use modals and complex tense forms as well as build nominals with quantificational adjectives and master some operators define the upper edges of the level.
5. Conclusions
We have argued that data-driven approaches to learner corpora can support SLA research when integrated with visualisation tools. We presented how a visual user interface which supports exploratory search over a corpus of learner texts using automatically determined discriminative features that characterise intermediate-level learners can support linguistic interpretations of these features. In particular, the data-driven approach has highlighted overproduction of the definite article with English nominals denoting kinds. It has further provided a way to delimit the boundaries of the upper-intermediate level through the comparison of sets of negative and positive discriminative features.
With regard to assessment, this study indicates that it relies more on positive evidence for the growth of grammar than on reduction of errors. Attempts to produce more complex structures are rewarded even when errors persist (e.g. ‘since’) or even increase (e.g. UD). This conclusion is in line with Hawkins & Filipovic (2012) and Thewissen (2011) who show that errors are not always strong level predictors.
Acknowledgments
We thank Ted Briscoe, John Hawkins and Mike McCarthy and the audience of SLRF 2010 and LCR11, in particular Marcus Dickinson, Erin Quirk, Jennifer Thewissen and Detmar Meurers. Caroline Williams has provided many corpus searches and measurements. We also acknowledge sponsorship by Cambridge Assessment. The first author acknowledges sponsorship by EF Education First. All learner examples are from the Cambridge Learner Corpus © Cambridge ESOL & Cambridge University Press 2011.
References
Briscoe, E.J., Caroll J. & Watson R. (2006). The Second Release of the RASP System. In Proceedings of the ACL-Coling’06 Interactive Presentation Session. Sydney, 17-21 July, 2006, 77-80.
Briscoe, E.J., Medlock, B. & Andersen, O. (2010). Automated Assessment of ESOL Free Text Examinations: Technical Report, Cambridge University Computer Laboratory, TR-790.
Card, S.K., Mackinlay, J.D. & Shneiderman, B. (1999). Readings in Information Visualization: Using Vision to Think. San Francisco: Morgan Kaufmann Publishers. Carlson, G.N. (1980 [1977]). Reference to Kinds in English. Outstanding dissertations in linguistics, New York & London: Garland Publishing.
Chierchia, G. (1998). Reference to kinds across languages. Natural Language Semantics 6, 339-405.
Council of Europe (2001). Common European Framework of Reference for Languages: Learning, Teaching, Assessment. Cambridge: Cambridge University Press.
Fry, B. (2007). Visualizing Data: Exploring and Explaining Data with the Processing Environment. Canada: O’Reilly Media.
Gao, J., Misue, K. & Tanaka, J. (2009). A multiple-aspects visualization tool for exploring social networks. Human Interface and the Management of Information 9, 277-286.
Gram, L. & Buttery, P. (2009). A tutorial introduction to iLexIR Search, unpublished manuscript, University of Cambridge.
Granger, S. (1994). The learner corpus: A revolution in applied linguistics. English Today 10(3), 25-29.
Granger, S. (2003). Error-tagged learner corpora and CALL: A promising synergy.
CALICO Journal 20(3), 465-480.
Hawkins, J.A. & Buttery, P. (2009). Using learner language from corpora to profile levels of proficiency: Insights from the English Profile Programme. In L. Taylor & C.J.
Weir (eds) Language Testing Matters. Cambridge: Cambridge University Press, 158-175.
Hawkins, J.A. & Buttery, P. (2010). Criterial features in Learner Corpora: Theory and
illustrations. English Profile Journal 1(1), http://journals.cambridge.org/action/displayAbstract?fromPage=online&aid=7908278
&fulltextType=RA&fileId=S2041536210000103 (last accessed on 15 December, 2011).
Hawkins, J.A. & Filipovic, L. (2012). Criterial Features in L2 English: Specifying the Reference Levels of the Common European Framework. Cambridge: Cambridge University Press.
Heer, J. & Boyd, D. (2005). Vizster: Visualizing online social networks. In
Proceedings of theIEEE Symposium on Information Visualization,Minneapolis, 23-25 October, 2005, 32-39.
Heer, J., Card, S.K. & Landay, J.A. (2005). Prefuse: A toolkit for interactive information visualization. In Proceedings of the SIGCHI Conference on Human Factors in Computing Systems, New York: ACM Press, 421-430.
Manning, C.D., Raghavan, P. & Schutze, H. (2008). An Introduction to Information Retrieval. Cambridge: Cambridge University Press.
McCandless, M., Hatcher, E. & Gospodnetic, O. (2010 [2004]). Lucene in Action. US: Manning Publications.
Meurers, D. (2009). On the automatic analysis of learner language. CALICO Journal
26(3), 469-473.
Munzner, T. (2009). A nested model for visualization, design and validation. In
Proceedings of the IEEE Transactions on Visualization and Computer Graphics 15(6), 921-928.
Nicholls, D. (2003). The Cambridge Learner Corpus: Error coding and analysis for lexicography and ELT. In D. Archer, P. Rayson, A. Wilson & T. McEnery (eds)
Proceedings of the Corpus Linguistics 2003 Conference. Lancaster University: University Centre for Computer Corpus Research on Language, 572-581.
Perer, A. & Shneiderman, B. (2006). Balancing systematic and flexible exploration of social networks. IEEE Transactions on Visualization and Computer Graphics 12(5), 693-700.
Shneiderman, B. & Plaisant, C. (2006). Strategies for evaluating information visualization tools: multi-dimensional in-depth long-term case studies. In Proceedings of the 2006 AVI workshop on BEyond time and errors: novel evaluation methods for information visualization. New York: ACM Press, 1-7.
Thewissen, J. (2011). A learner corpus-based study of error developmental patterns: The impact of proficiency level, Paper presented at the Learner Corpus Research 2011, Louvain-la-Neuve, 15-17 September, 2011.
Van Ham, F., Wattenberg, M. & Viégas, F.B. (2009). Mapping text with phrase nets.
Proceedings of the IEEE Transactions on Visualization and Computer Graphics 15(6), 1169-1176.
Yannakoudakis, H., Briscoe, T. & Alexopoulou, T. (2012). Automating Second Language Acquisition Research: Integrating Information Visualisation and Machine Learning. In Proceedings of the EACL 2012 Joint Workshop of LINGVIS & UNCLH, Avignon, 23-24 April, 35-43.
Yannakoudakis, H., Briscoe, T. & Medlock, B. (2011). A new dataset and method for automatically grading ESOL texts. In Proceedings of the 49th Annual Meeting of the Association for Computational Linguistics: Human Language Technologies, Portland, 19-24 June, 180-189.