Title Credentialism and demand for private supplementary tutoring
Author(s) GHOSH, P; Bray, TM
Citation International Journal of Comparative Education andDevelopment, 2018, v. 20 n. 1, p. 33-50
Issued Date 2018
URL http://hdl.handle.net/10722/251568
Rights
This article is © Emerald Group Publishing and permission has been granted for this version to appear here
(http://dx.doi.org/10.1108/IJCED-10-2017-0029). Emerald does not grant permission for this article to be further copied/distributed or hosted elsewhere without the express permission from
Emerald Group Publishing Limited.; This work is licensed under a Creative Commons Attribution-NonCommercial-NoDerivatives 4.0 International License.
1
International Journal of Comparative Education and Development (2018): Vol.30, No.1, pp.33-50.
Credentialism and demand for private supplementary tutoring:
A comparative study of students following two examination boards in India
Abstract
Purpose - Private supplementary tutoring is expanding fast around the world. Recognising that examination boards are major shapers of curricular load, this study identifies roles of examination boards at Grades 8, 9 and 10 in Bengaluru, India. Two boards were chosen, with one having a heavier perceived curricular load than the other.
Design/methodology/approach - The study used mixed methods with a questionnaire survey of 687 students in Grades 8, 9 and 10, and 51 face-to-face, semi-structured interviews.
Findings - Perhaps surprisingly, the findings did not reveal significant differences in tutoring demand by students. Both groups viewed the board examinations as having high stakes, and accordingly invested in extensive private tutoring. Competition emanating from credentialism was the main driver of the decision to receive tutoring among both cohorts.
Originality/ value - Although previous studies have explored various components of demand for tutoring, to the authors’ knowledge this is the first to explore the impact of examination boards on demand for tutoring. Since the system of schools being affiliated to examination boards is common not only in India but also in many other countries, the study has broad international relevance.
Keywords Credentialism, Curricular load, Examination boards, High-stakes examinations, Private supplementary tutoring, Shadow education
Paper type Research paper
Introduction
Many students receive private tutoring in academic subjects to supplement mainstream schooling. Private supplementary tutoring, widely known as shadow education, has become a global phenomenon and is expanding rapidly around the world (Aurini et al., 2013; Bray, 2009, Zhang and Bray, 2017). Tutoring can enhance students’ academic performance, but it also increases their study burdens and consumes leisure time. Further, teachers may face disparities in classrooms when some students receive private tutoring but others do not; and although some teachers assist slow learners, others may take tutoring as a norm and allow the gaps between students to grow. At the societal level, private tutoring can exacerbate inequalities because it is more easily accessible to the rich than the poor.
Recent decades have brought expanded research on the demand for private tutoring, but much remains to be done. India has very high rates of tutoring, but is among countries
2
with little research. This paper explores the demand for shadow education in an Indian city at micro, meso and macro levels among two cohorts following different examination boards. The paper begins with definitions and the conceptual framework. It then reviews literature on demand for shadow education, which leads to the research questions. The paper then turns to the background for this specific study. The next section describes the methods, and is followed by the key findings. The concluding section discusses the findings in relation to the conceptual framework, and notes some policy implications.
Definitions
In line with much of the literature (e.g. Bray, 1999, p.20; Zhang, 2014, p.437), private supplementary tutoring is here defined as tutoring provided for a fee in academic subjects to supplement mainstream schooling. This definition excludes extra-curricular subjects such as music and fine arts. It also limits the focus to tutoring provided by individuals and institutions for profit motive. The tutoring is provided outside mainstream school hours on weekdays, at weekends, and during school vacations. It may be one-to-one, in small groups or in large classes. Tutoring may also be provided online, but the present study is concerned with face-to-face modes.
A second definitional matter concerns examination boards. In India, these bodies (also known as boards of school education, school boards, education boards, or just boards) are statutory entities that certificate educational achievements (see e.g. Sharma, 1991, p.36; World Bank, 2009, p.48). They have been established by notification in the official Gazettes of the central or state governments, and have four major functions:
• framing courses of study based on the recommendations of expert committees; • administration of board examinations;
• issue of certificates for completion of lower-secondary and senior-secondary schooling; and
• framing conditions for recognition of schools.
Some boards also publish books and/or recommend books by other publishers. Boards may be private bodies, but most boards in India are constituted by central or state governments.
Conceptual lens: Credentialism
Credentialism can be defined as “the pressure to upgrade formal educational pre-requisites for entry into and promotion through labour markets” (Davis, 1981, p.649). Many societies
3
attach strong emphasis to educational credentials. Attainment of educational credentials does not hold significance in the labour market alone but also in social, political and cultural dimensions shaped by historical and national contexts (Brown, 2001, p.25). A major aspect of credentialism is stronger emphasis on qualification than on education. Dore (1997, p.8) distinguished between ‘education’ and ‘qualification’ by stating that “If education is learning to do a job, qualification is a matter of learning in order to get a job.” Another aspect of credentialism is credential inflation or qualification escalation. An increase in the number of qualified persons for limited numbers of jobs reduces the usefulness of existing certificates in acquiring those jobs. Therefore individuals are pressed to obtain higher levels of education (Dore, 1997, p.5; Collins, 2002, p.228).
Dore (1997) suggested that credentialism was more pronounced in less developed countries than in industrialised ones. He added that credentialism was fanned by large gaps between average incomes and the incomes of elite professionals. Given this duality low income groups naturally wanted to bridge the income divide, and invested in education which they viewed as a ticket to the “bridgehead”. Collins (1979, pp.90-103) indicated that credentialism was stronger in societies that were politically decentralized, economically mobilized and multiethnic, as these conditions encouraged competition between status groups for wealth, power and prestige.
India clearly harbours conditions thought conducive by Dore and Collins for the growth of credentialism. India started developing late, is multiethnic, has a decentralized system of government, and is a free-market economy. It is not surprising therefore, that credentialism has been highly visible for some time. Inadequate policy attention and hurdles in implementation of existing policies have supported various forms of private tutoring, viewed as indispensable channels for future life chances (see Majumdar, 2014).
Demand for private tutoring
Private tutoring has expanded globally in recent years and is especially evident in Asia (Bray & Lykins, 2012). This section notes micro-level, meso-level and macro-level drivers of demand for private tutoring, adopting the hierarchical framework proposed by Lee et al. (2009, p.907). Micro-level factors include student motivation and achievement, parental education and income, grade level, and gender. Meso-level factors include school policies, transition structures between levels of schooling, and curricula set by examination boards or other bodies. Macro-level factors include broad economic, cultural, social and political forces.
4
Many countries have watersheds within school systems at which students are streamed or pushed out. Families commonly invest in supplementary tutoring to avoid negative consequences at these watersheds. Much literature in this context has focused on the demands of the curriculum (e.g. Bray at al., 2014; Ireson and Rushworth, 2011; Stevenson and Baker, 1992). However, none to the authors’ knowledge has investigated the impact of examination boards. The present paper aims to identify whether the demand for private tutoring is greater for families and students facing boards with curricular loads that are perceived to be heavy compared those facing boards that are viewed as less demanding.
Specifically in India, some mention of private tutoring has been evident during the second quarter of the 20th century (e.g. Joshi, 1977, p. 203), but only since the turn of the
century has the topic become a clear focus of research (e.g. Azam 2016; Majumdar 2014; Aslam and Atherton 2012). Statistics form an official survey (Government of India, 2015, p. A-23) indicated that in 2014, 25.9% of sampled students in both schooling and higher education were receiving private tutoring. Among the states, Tripura and West Bengal showed the highest participation rates at 81.2% and 78.4% whereas Mizoram and Nagaland had participation rates of 1.9% and 3.8%. Participation was greater in higher than in lower grades. At the primary level, the average participation rate was 21.6%, as compared to 26.3% at upper primary level and 36.3% at secondary and higher secondary level. Private tutoring is not limited to the school level, as 20.3% of undergraduate students and 13.0 % of students pursuing postgraduate degrees were recorded to receive private tutoring (Government of India, 2015, p.A-24).
Previous studies in India have revealed significant relationships between examinations and tutoring demand. In a study of four Indian states (Andhra Pradesh, Maharashtra, Kerala and Uttar Pradesh), Sujatha (2014, p. 3) found that 58.8% of Grade 10 students received tutoring as against 32% Grade 9 students. The higher demand for tutoring was attributed to public examination preparation in Grade 10. Azam (2016, p. 745) pointed out that in the year 2007/08, students in secondary schools spent 52.5% more on tutoring than those in primary schools as the former prepared for school leaving (board) examinations. As in other parts of India, Bengaluru also has such watersheds where students need to take board examinations at the end of Grade 10 to attain the school leaving certificate and obtain admission in Grade 11 (also known as pre-university). Although in general, all over the country, a school is affiliated to a single examination board, some schools follow more than one examination board. Bengaluru houses several such schools. The study focuses on such schools for ease of comparison between boards.
5
Bearing in mind existing knowledge and research gaps, this paper addressed the following research questions:
1. How do patterns of demand for tutoring differ for students in the sampled schools sitting examinations set by different boards?
2. What are the key micro, meso and macro-level drivers of the decisions to receive tutoring?
3. Do examination boards impact on the decisions to receive private tutoring? If so, how; and if not, why not?
Background
India’s education structure and examination boards
In India, school education generally follows a 5+3+2+2 pattern, with five years of primary schooling, three years of middle schooling, two years in secondary, and two years in senior-secondary schooling. Institutions run by the central government, state governments or municipal bodies are known as government schools, and generally do not charge fees for teaching, books or uniforms. Schools run by private entities but largely funded by government grants-in-aid are called aided schools. Most charge low or no fees, and commonly serve children from lower economic backgrounds (MHRD, 2011, p.20). Schools owned and managed by individuals, trusts, societies or other private entities without government aid are called unaided or private schools and commonly charge high fees (MHRD, 2014, p.i). In 2014, 61.3% of students were in government schools, 12.6% in aided schools, and 26.0% in private schools (Government of India, 2015, p.18).
Secondary schools in India are affiliated to national, state and/or international boards. The three national boards are the Council of Indian School Certificate Examinations (CISCE), the Central Board of Secondary Examination (CBSE), and the National Institute of Open Schooling (NIOS). Among these bodies, the first is the focus of this paper.
The country has over 50 state boards (NIOS, 2017, p.39). Each state board constructs its curriculum based on guidelines from the National Curriculum Framework (NCF), tailoring it according to the state’s context. This paper is concerned with Bengaluru, Karnataka State, in which the most prominent state board is the Karnataka Secondary Education Examination Board (KSEEB).
Elaborating on the two boards with which this paper is most concerned, the CISCE was established in 1958 (CISCE, 2017). It conducts three public examinations: the Indian Certificate of Secondary Education (ICSE) in Grade 10, the Indian School Certificate (ISC)
6
in Grade 12, and the Certificate of Vocational Education (CVE) in Grade 12. All these examinations are conducted in English (except for Indian-language components). Schools following the CISCE are required to adhere strictly to the curriculum and to books designated for Grades 1 to 12. In Grades 1 to 9 and 11, the Council has little intervention apart from prescription of the syllabi and maintenance of student records. Students in these grades are examined and assessed internally by the schools. The present study is concerned with the CISCE’s ICSE curriculum, and henceforth the CISCE will be referred to as the ICSE which is the commonly-used term to refer to the board at the secondary level.
The KSEEB was established by the Karnataka state government in 1966 (KSEEB, 2017), and conducts the Secondary School Leaving Certificate (SSLC) examinations for students of Grade 10. The board conducts examinations in both English and Kannada, the latter being the official language of the state. The KSEEB publishes its own textbooks which the schools are required to follow. Like the CISCE, the KSEEB has little interference in the day-to-day operations of the schools. The KSEEB is commonly called ‘State board’ in Karnataka, and henceforth the paper will use this label.
Bengaluru, Karnataka State
Bengaluru (previously known as Bangalore) is the capital of Karnataka and lies in the southern part of the Indian peninsula. It is the third largest city in the country with a population of 8.4 million (Census, 2011). Most Karnataka schools follow single boards, but some follow more than one board and stream students into the curricula of different boards from Grade 8. Government schools follow government boards, but private aided and unaided schools follow either government or private boards. Students take board examinations twice: in Grades 10 and 12. A student’s future in higher education largely depends on her/his board examination results (Government of Karnataka, 2002). After successful completion of Grade 12, students opt for different streams in higher education, the major streams being science, commerce and arts.
Methodology
The study used mixed methods with a questionnaire survey of 687 students in Grades 8, 9 and 10, and 51 face-to-face, semi-structured interviews. The questionnaire was adapted from a Hong Kong instrument (Bray & Kwo, 2015). The interview guide was initially adapted from the Hong Kong study and developed during the fieldwork.
7
Five schools were selected through homogeneous sampling such that all were private unaided and co-educational, catered to lower-middle or middle-income students, and used English as the medium of instruction. The schools followed the ICSE board until Grade 7, after which students chose either the ICSE or the State board. The survey covered all students of Grades 8 (227 respondents), 9 (220) and 10 (240), most of whom were aged between 12 and 15. Among the 687 respondents, 335 followed the State board and 352 the ICSE board.
While the survey was conducted in all five schools, the interviews were conducted in three. The interviewees were 22 students, 13 teachers, 11 parents, and five tutors. All the teachers taught students in Grades 8, 9 and/or 10. Teachers and students were introduced by the school authorities. The sampling procedure did not work so well for parents as for teachers and students, because the officials generally introduced parents who thought highly of the schools. Accordingly, the strategy was changed to snowball sampling which included parents whose children had completed Grade 10 that year. Since these parents had fresh memories of their experiences and their children had already left school, they were more forthcoming and candid. The five tutors were accessed through opportunistic sampling.
Bengaluru was chosen as the research site because the first-named author had contacts enabling access to schools. A further benefit for the scholarly literature is that, to the authors’ knowledge, no previous academic research on private tutoring had been conducted in Bengaluru. For the survey, active consent was obtained from the school authorities and students, and passive consent was obtained from the parents. For the interviews, oral consent was obtained from each interviewee. A pilot study was conducted in four grades of one school. In addition to testing the research instruments, the pilot study helped identify problems that could arise during the process of fieldwork and also helped the first-named author to gain experience in administering the research instruments in the specific cultural context.
Findings and analysis
The findings are presented in three main sections. The first discusses the differences between the ICSE and State boards. The second section explores inter-board variation in the demand patterns of private tutoring; and the third section identifies the statistically significant drivers of decisions to receive tutoring at micro, meso and macro levels.
8
In the five sampled schools, all students studied under a board selected by the school up to Grade 7, after which they were given a choice of either ICSE or State board which they were expected to follow until completion of Grade 10. Shifting between boards was permissible up to Grade 9.
The general perception among the interviewees was that the ICSE curriculum was heavier than that of the State board. Particularly valuable were the perspectives of 11 teachers (out of 13) who taught the syllabi of both boards. All but three of these teachers felt that the ICSE board demanded greater depth and breadth than the State board. Students following the ICSE board took examinations in 10 subjects for 1,100 marks, whereas State board students took examinations in six subjects for 625 marks. The ICSE Grade 10 syllabus demanded separate examinations for Physics, Chemistry, Biology, History-Civics, Geography, English-1, English-2, Second language (Hindi or Kannada) and Computer Science (Theory and Practical), whereas the State board syllabus required only one examination each for General Science, Social Science, Mathematics, English, Kannada (compulsory) and a third language. The question papers in ICSE examinations were longer and more application oriented than those of the State board. Teachers reported that the answer keys of ICSE question papers were more structured and that the evaluation techniques were more rigorous and systematic than those of the State board. Teachers added that sometimes the schools discouraged academically weak students from choosing the ICSE stream. They reported cases of Grade 9 students shifting from the ICSE board to the State board, but no shift was reported in the other direction.
For students and parents, the ICSE track was commonly viewed as a status symbol. Most State board students said that they noticed behavioural changes in their friends once they entered the ICSE stream. Most ICSE students felt proud to be in that track. Some parents insisted that their children join the ICSE stream due to its perceived higher status even when discouraged by school authorities on the grounds of poor academic performance. However, a few high achievers opted for the State board because they considered it easier to score high marks which they felt would provide an edge in pre-university admission.
Four of the five schools charged higher fees for ICSE students. The fee difference was marginal (100 rupees) in two schools and significant in two schools (720 rupees and 2,713 rupees).[1] School leaders attributed the higher fees to the greater number of ICSE subjects which required more teachers. Since the schools were unaided, the decision regarding the fee lay with the school managements.
9
Factors underlying choice of board
In the questionnaire responses, 82.8% of ICSE board students stated that they chose the ICSE board to benefit their future careers. Two thirds (61.9%) reported that studying under the ICSE board would facilitate their studies in Grades 11 and 12. Students under the ICSE curriculum (and their parents) said that the ICSE syllabi of Grades 9 and 10 covered a considerable portion of the State board syllabi of Grades 11 and 12, and that after the completion of Grade 10 under the ICSE board they planned to shift from the ICSE to the State board for pre-university education (Grades 11 and 12). As ICSE students would have already covered a substantial portion of the pre-university syllabus in Grades 9 and 10, they would have an edge over the other students in understanding concepts. This way, they felt their children would score higher in Grade 12 State board examinations which would facilitate their admission into reputable higher education institutions. Parents believed that the ICSE syllabus provided deep knowledge and a strong foundation for competitive university admission examinations.
The top reason cited for joining the State board system was to score higher marks in the State board examinations (56.5% of students). Also, almost one third of the students reported that they joined the State board because they wanted to shift to an easier curriculum (in contrast to 6.9% of ICSE students citing this reason for choosing the ICSE board). Some parents of State board students indicated that they had chosen the State board because they did not want to burden their children with school work. One third (32.0%) of the students stated that they chose the State board because they felt that it would benefit their future careers. This reason was largely related to the topmost reason for scoring high in board examinations.
No significant differences in socio-economic status were found between the two cohorts. In the two schools in which the difference in school fees between the cohorts was large, a greater proportion of high SES students followed the ICSE board. However the other three schools had no significant difference between the boards with respect to students’ socio-economic status.
Inter-board and inter-grade variations in demand for tutoring
Variations were observed between students of the two boards in participation rates, modes, costs, subjects and intensities of tutoring. Variations were also found between students taking internal examinations (Grades 8 and 9) and ones taking the high-stakes board examinations (Grade 10). Overall, 52.5% of secondary students received tutoring. The percentage was
10
much higher in Grade 10 (71.7%) compared with Grades 8 (44.1%) and 9 (40.5%). With regard to boards, the overall difference in tutoring participation was not very significant, since 54.3% of State board students received tutoring and 50.9% of ICSE board students did so. Differences between boards were more obvious in specific grades. In Grade 8, 53.3% of State board students received tutoring compared to 37.8% of ICSE board students. This was possibly because in lower grades ICSE board students were more motivated and could manage self-study. Parents of Grade 8 State board students felt that their children required an authoritative figure to compel them to study. An opposite pattern was observed in Grade 10 where a higher proportion of ICSE students received tutoring (75.9%) compared to the State board (68.2%). However whether the impact of boards on the demand for tutoring was statistically significant requires further examination. This was tested through binomial logistic regression, discussed below.
Three main types of tutoring were received by the students: one-to-one, informal groups, and lecture-style. One-to-one tutoring was commonly provided in the homes of the tutors or the tutees, and was the most expensive. In informal-group tutoring, tutees of different ages sat together at the tutors’ homes and generally received tutoring in all subjects on a need basis. This kind of tutoring was the least expensive. Lecture-style tutoring was more professional than the other two, and generally provided specialised tutoring in subjects such as mathematics and science to sets of students belonging to the same grade and board. This type primarily focused on examination preparation.
In all three grades, State board students were more inclined to receive informal-group tutoring than ICSE students. The higher participations of ICSE students in lecture-style tutoring could be associated with its voluminous syllabi for which students sought professional help. A major reason for seeking tutoring cited by ICSE board students was to understand concepts better, which they felt was best facilitated by lecture-style tutoring. In contrast, most State board students sought guidance with their homework and supervision in memorising lessons which could best be done in style tutoring. Though informal-group tutoring was the most common and least costly, the participation in this mode declined among both cohorts in Grade 10 when more students took lecture-style tutoring for board examination preparation. When compared to Grade 9, the participation rate in lecture-style tutoring in Grade 10 was 31.1% points more among ICSE students and 32.6% points more among State board students. However, even in Grade 10, a larger proportion of State board students received informal group style tutoring (54%) as against ICSE students (48%).
11
Concerning the cost of tutoring, on average, students following ICSE board spent 158 rupees more on tutoring per month than students following State board. This was possibly because ICSE students were inclined to receive more expensive forms of tutoring (one-to-one and lecture style). Even within these forms, the tuition fees paid by ICSE students were greater than those paid by State board students. On average, ICSE students paid 543.8 rupees more for lecture-style tutoring than State board students. Tutors associated the difference in fees with the additional number of subjects and the comprehensiveness of the ICSE curriculum. This pattern was also observed in mainstream schools where two out of five schools surveyed charged the ICSE cohorts substantially higher fees than State board cohorts. Students in higher grades spent more on tutoring. On average, State board students of Grade 10 spent 269 rupees more on tutoring than their counterparts in Grade 8. The corresponding figure for ICSE was 308 rupees. The increased spending on tutoring in Grade 10 highlighted the importance placed by families on board examinations.
Mathematics and science were the most popular subjects in tutoring among students of both boards. This finding resembles those of Sujatha and Rani (2011) and Maheshwari (2013) in other parts of India (and for other boards). Interviews indicated that students favoured the two subjects since only in mathematics and science could they score 100 out of 100 and thereby improve their overall average score. However, ICSE and State board students differed in the scale of ‘all-subjects’ tutoring. Over half of the State board students received tutoring in all subjects compared to about one third of ICSE students. Tutoring in all subjects usually means tutoring provided by a single tutor in all subjects in the curriculum, on a need basis. All-subjects tutoring is largely provided in informal-group-tutoring mode which is availed largely by State board students. Usually, tutors for such forms of tutoring have limited expertise in some subjects. Since higher proportions of ICSE board students sought specialised tutoring in particular subjects (especially in mathematics and science), they were less inclined to receive all-subjects tutoring. All-subjects tutoring was more popular among tutees belonging to lower grades, and students in higher grades tended to receive more tutoring in mathematics and science. However, even in Grade 10, State board students remained more inclined to receive subjects tutoring with 44.2% students receiving all-subjects tutoring as compared to 15.0% ICSE students.
ICSE students on average spent 10.2 hours per week on tutoring, which was half an hour more than State board students. In Grades 8 and 9, ICSE students averaged almost two hours more in tutoring than State board students. Since the ICSE syllabus was considered deep and more voluminous, mainstream schools began teaching portions of Grade 10
12
syllabus in Grade 9. Therefore, ICSE students demanded additional hours of tutoring in Grade 9, mainly to understand concepts. ICSE students of Grade 9 spent nearly 12 hours per week in tutoring compared to nine hours by State board students. Interestingly, in Grade 10, students of both boards spent nearly equal hours in tutoring (i.e. around 12 hours). Overall, the time spent in tutoring at the examination season did not vary significantly from that during ordinary term-time. However, the number of hours for tutoring declined substantially during vacations. Again, ICSE students received more hours of tutoring during vacations and examination seasons compared to State board students.
The above discussion indicates that private supplementary tutoring largely mimicked the mainstream even where school boards were concerned. The demand patterns of tutoring for both cohorts in terms of type, cost, subjects and intensity differed based on the boards that students followed.
Drivers of demand for tutoring
Reasons given by students for receiving tutoring
Students were asked to indicate one or more reasons why they received tutoring. The top reason given was to score high marks in examinations. In Grades 8 and 9, the main reason was to perform well in internal school examinations (65.8% of ICSE tutees and 72.7% of State board ones). In Grade 10, the dominant reason was to perform well in board examinations (79% of ICSE tutees and 80% of State board ones).
Although for both groups the overarching reason for receiving tutoring was to perform well in examinations, the subsidiary reasons differed. Overall, 41.1% of ICSE students reported receiving tutoring to understand lessons better, compared to 35.5% of State board students. In Grade 10, 50.6% of ICSE tutees reported that they received tutoring to understand the subjects better compared to 37.6% of State board tutees. Parental involvement in the decision to receive tutoring was greater for State board students and for students in lower grades. In Grade 8, 40.5% of State board students cited parental decision as a reason for receiving tutoring compared to 31.9% of ICSE students. The corresponding figures for Grade 10 were 22.4% and 16% respectively. Interview data threw more light into this pattern.
In Grades 8 and 9, students following the ICSE board emphasised understanding of concepts for achieving high examination scores. They felt that their mainstream teachers rushed to complete portions of their voluminous syllabi, and sought tutoring help to reinforce lessons and clarify concepts. By contrast, supervision was the most important reason for State board students receiving tutoring in Grades 8 and 9. Parents felt that their children needed an
13
authoritative figure to make them study and use their time well. Although State board students reported that they took tutoring to perform well in examinations, when asked to choose between a) scoring high marks and b) understanding the lessons, three out of five students selected scoring high marks. They indicated that tutoring was beneficial because tutors made them write the same answers repeatedly until they had memorised the materials. In Grade 10, since board examinations were the main focus, students of both boards tended to seek tutoring to gain more revision, practice tests, gain examination skills (such as time management and question management during examinations), and improve organisational skills (such as creating a study time-table and allotting study time according to the importance of the subjects). Due to its in-depth syllabus and application-oriented examinations, understanding of concepts remained an important factor driving the decision to receive tutoring among Grade 10 ICSE students.
Determinants of the decision to receive tutoring
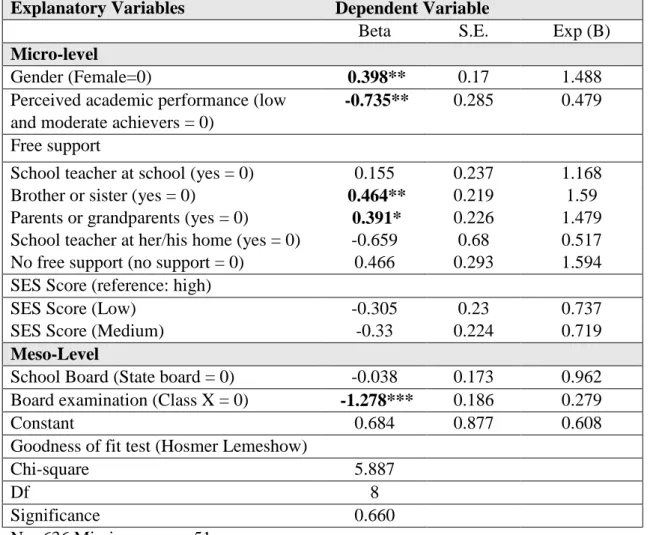
This section identifies the main factors that impact on the decision to receive private tutoring at the micro, meso and macro levels, and examines whether tutoring decisions were significantly related to school boards. Six key variables that had been empirically important in previous studies and fitted Bengaluru’s context were selected at the micro and meso-levels (Table 1). The results of binomial logistic regression are shown in Table 2.
[Table 1: Variable description and participation in tutoring]
Micro-level factors
The micro-level independent variables studied were gender, self-reported academic achievement, free support, and socio-economic status. Males were 1.5 times more likely to receive tutoring than females, which matched findings elsewhere in India (Sujatha & Rani, 2011, p.119; Maheshwari, 2013, p.38; Aslam & Atherton, 2013, p.150). Qualitative data revealed that one reason for pro-male bias was the belief (especially among low-income families) that investment in boys would be more fruitful as they would financially support their parents in old age whereas girls would become members of other families after marriage.
With regard to self-reported academic achievement, descriptive statistics showed a conspicuous difference in participation rates between self-reported excellent students and
14
ones who considered themselves good, fair or poor, but showed no significant differences in participation rates between self-reported good, fair and poor students. Therefore, for the regression analysis, the variable ‘perceived academic achievement’ was regrouped into two categories: ‘high achievers’ which included self-reported excellent students, and ‘moderate and low achievers’ which included students who perceived themselves as either good, fair or poor. Regression results (Table 2) indicated that self-reported high achievers were significantly less likely to receive tutoring than the rest of the students. Similar patterns had been observed among secondary students in Hong Kong by Bray et al. (2014, p.33). Lower engagement in tutoring among students with higher self-estimation might indicate that they were confident to learn on their own. Additionally, they might have been less diffident in seeking free help from mainstream teachers. The interview data revealed that in general, higher achievers were more active in seeking help from mainstream teachers out of school hours.
Students who received help at home from their relatives, especially siblings, were less likely to receive tutoring than those who did not receive any kind of free support. Receiving free help from mainstream teachers at school outside school hours did not significantly influence the decision to receive tutoring. This was corroborated by the interview findings. Students were asked during interviews whether they would still purchase tutoring if their mainstream teachers provided free tutoring after school hours. All except two replied that they would prefer to receive private tutoring since they felt that their questions were answered more clearly in tutorials. Low school quality was probably one driving factor for receiving tutoring. However, since a homogeneous sample of schools was selected, the school quality factor was not explored in the survey.
With regard to socio-economic status, since parental income data was unavailable for 56.7% of the respondents, a new variable was constructed providing a rough stratification of socio-economic status of students (see Bray & Kwok, 2003, p.616). This new variable, referred to as ‘SES Score’ was constructed from the original variables: number of bedrooms, living rooms, toilets, additional rooms, parental education, parental income, and school fees. The SES indicator was constructed using a percentile-based stratification algorithm, categorising each interviewee into high, medium or low socio-economic status.
15
The regression results did not display any significant relationship between socio-economic status and the decision to receive tutoring. This was intriguing as a number of previous studies had shown significant relationships between socio-economic status and demand for tutoring (e.g. Azam, 2016, p.753; Bray et al., 2014, p.33; Bray and Kwok, 2003, p.616). One reason for such discrepancy could be the impact of other key explanatory factors that mediated the effects of SES on tutoring participation. Therefore, the impact of SES on participation in tutoring was further investigated as reported in the following section.
Meso-level Factors
School board was not a statistically significant driver of the decision to receive tutoring. This was corroborated by qualitative findings. Most students (and parents) indicated that they would receive tutoring even if they followed a different board. All five tutors were of the same opinion. One who tutored students of three different boards (ICSE, State and CBSE) said:
I don’t see a difference in terms of curriculum for tuition requirements. There is a difference in these three boards of education in different facets [but] not in terms of the tuition requirements. All three require tutorials to same extent. If at all they want to get that extra score.
To understand the impact of high-stakes board examinations on the decision to receive tutoring, the variable ‘grades’ was regrouped into two separate categories. The first category consisted of students who would take the board examinations that same year (Grade 10), and the second category consisted of students who would not take board examinations that year i.e. students of Grades 8 and 9 (referred to as ‘non-Grade 10’). As mentioned earlier, Grades 8 and 9 took examinations organised internally by the school. Regression results indicated that board examinations had a statistically significant relationship with the decision to receive tutoring. The odds of receiving tutoring in non-board examination grades were only 27.9% of the odds of receiving tutoring in a board examination grade. This corroborated patterns observed in descriptive statistics, where 79.5% of Grade 10 students cited board examinations as the reason for receiving tutoring.
From the patterns observed in Table 2, the micro-level factors gender, academic achievement and free support at home and the meso-level factor board examination had significant relationships with the decision to receive tutoring at the 99% level of confidence.
16
Controlling the board examination variable
Given the strong influence of board examinations on tutoring, the significance of school board and SES variables was tested by controlling the board examination factor. This helped examine if the impacts of school board and/or SES score were being mediated by the impact of board examination. For this purpose, the dataset was divided into two separate samples: one consisting of students who would take the board examinations that same year (Grade 10), and the other consisting of students of Grades 8 and 9, who would not take board examinations that year (non-Grade 10). Binary logistic regression was again performed on these two new data sets. Table 3 presents the regression results for non-Grade 10 students.
[Table 3: Binary logistic regression models for classes taking internal school examinations (non-Grade 10)]
For non-Grade 10 students, socio-economic status was a statistically significant determinant of the decision to receive tutoring for these students. The lower the student’s SES score, the less likely the student was to receive tutoring. Boards did not display any statistically significant relationship with the decision to receive tutoring. Table 4 presents the logistic regression results for students due to take the board examinations that year (Grade 10).
[Table 4: Binary logistic regression for Board examination taking classes (Grade 10)]
For Grade 10 students, neither school board nor SES had a statistically significant impact on tutoring participation. This indicates that in Grade 10, board examination was perhaps the strongest factor governing the decision to receive tutoring, and its impact mediated the impact of students’ SES.
The regression results reported in Tables 3 and 4 revealed two important findings. First, school boards did not significantly influence the participation in tutoring even when the impact of the board examination variable had been controlled. Second, even though the socio-economic status of students significantly influenced the participation in tutoring among students of Grades 8 and 9, it became a statistically insignificant consideration for the decision to receive tutoring in Grade 10. Therefore, Grade 10 students were likely to receive tutoring irrespective of their SES.
17
Board examinations were the dominant factor driving the decision to receive tutoring among students of both boards. This was strongly corroborated by the interview data in three aspects. First, students and parents attached great importance to scoring high in board examinations to increase their chances of admission to prestigious pre-universities (which considered board examination results for entry) and to gain admission into reputed preparatory tutorials for higher education entrance examinations.
Second, most students, parents and tutors considered tutoring imperative once students reached Grade 10 as they believed that tutoring could increase their scores in board examinations. Students who did not take tutoring in Grades 8 and 9 intended to receive tutoring in Grade 10. They indicated that tutoring was important to gain an edge in the competition as it provided preparatory guidance and examination skills not provided adequately by mainstream schools.
Third, parents made arrangements to provide tutoring to their Grade 10 children, even in the face of financial difficulties. Three parents stated that it was important for both husband and wife to work in order to bear their children’s tutoring expenses. Tutors and teachers spoke of parents who took up additional part-time employment or borrowed money to pay for their children’s tutoring. Often, the only tutoring these parents could afford was low quality informal-group tutoring.
The insignificant impact of boards on the decision to receive tutoring was possibly due to the differentiated demand of ICSE and State board students. As observed earlier, for both cohorts the overarching reason for receiving tutoring was to score high in their examinations. To achieve this, students wanted to compete within their cohorts and therefore chose the tutoring which suited their curricular needs. The demands were therefore differentiated in terms of participation rates, modes, costs, subjects and intensities, largely based on curricular differences.
Macro-level factors
Credentialism was strongly evident in Bengaluru and was a key macro-level factor influencing the decision to receive tutoring in Grade 10. Competition was deeply ingrained in the minds of parents, students, teachers and tutors. A large majority of parent interviewees (10 out of 11) wanted their children to take up professions in either engineering or medicine as they believed that these two streams led to secure, high paying jobs and commanded social respect. Quantitative data indicated that 59.8% students wanted to be engineers or doctors, and that 30.1% students aspired to become chartered accountants, scientists, lawyers, pilots,
18
military personnel, or civil servants. Thus 89.9% of students aspired to acquire top-tier jobs in terms of salary and/or social status. Parents were mindful that their children would have to perform better than a large number of aspirants for admission into a limited number of reputed higher education institutions. Parents were also mindful of credential inflation. They felt that nowadays, even scores as high as 95% were not enough for pre-university and university admissions. For parents, tutoring was a basic necessity to survive the competition. They were convinced that ‘good tutorials’ could help their children gain an edge in the competition for reputed pre-universities and reputed tutorials which prepared students for university entrance examinations. For middle-income groups, tutoring was the main visible path for upward social mobility, and investment in tutoring was considered less expensive than paying for a seat in a coveted college.
School authorities and teachers encouraged such competition among students. Schools placed hoardings outside their gates with photographs and names of top students. The hoardings acted as advertisements for schools so that parents, influenced by the scores on the hoardings, admitted their children in those schools. Teachers encouraged students to score high in Board examinations to have their photographs placed on the hoardings. Students complained that they felt performance pressure after they entered Grade 10. They felt the need to compete and perform well in examinations not just for their own futures but also to satisfy their parents, teachers and tutors. However when asked if they would like it if there were no Board examinations, most felt that examinations were necessary because they helped to classify abilities and pushed candidates for stronger learning.
Competition existed even inside tutorial institutions. Students reported that in Grade 10 they chose lecture-style tutoring over one-to-one tutoring because the competition in the former mode pushed them to their full potential. One student believed that informal group tutoring and one-to-one tutoring lacked “the element of competition” which was “the prime element in driving anybody to success”. He opined: “In coaching centres (lecture-style tutoring), there are all sorts of people. If somebody else scores more than me, I will push myself more.”
Therefore, in Grade 10 a sense of competition emanating from credentialism existed in all three facets of students’ lives: at home, at school and at tutorial. Though students felt the pressure to perform well in examinations, the feeling of competition was deeply ingrained in their sensibilities and they preferred taking examinations than not.
19
This paper has conducted a comparative analysis of demand for tutoring among students of two examination boards, with one having a heavier perceived curricular load than the other, in the context of a credential society. The two cohorts displayed differentiated demand for tutoring, with students having greater perceived curricular loads being likely to receive more hours, seek more professional forms, and bear higher expenses for tutoring. However, the findings point out that in a credential society where students mainly received tutoring to compete with their peers in order to score high in their respective examinations, perceived curricular burden did not play a significant role in the decision to receive tutoring.
The influence of high-stakes examinations on demand for private supplementary tutoring has been highlighted in previous Indian studies (e.g. Azam, 2015; Maheshwari, 2013; Sujatha & Rani, 2011) and in many other societies such as Hong Kong, Korea and Japan (Bray et al., 2014; Kim and Lee, 2010; Stevenson and Baker, 1992). The present study further indicates that in a credential society, middle-class families demand tutoring irrespective of their perceived curricular loads. Nevertheless, the tutoring demanded might be differentiated based on the curricular needs.
The findings of the study are significant for the city of Bengaluru, for India and for many other societies. Although a number of previous studies have investigated tutoring demand at different levels, none to the authors’ knowledge have explored the impact of examination boards on demand for tutoring. Bengaluru is distinct as it is one of the few Indian cities housing schools following multiple examination boards. In general, in India one school is affiliated to a single board. The differentiated demand of students of two boards within a homogeneous set of schools observed in this study is perhaps unique to Bengaluru. However, the system in which schools are affiliated to examination boards is common elsewhere in India and in many other countries. Researchers may usefully investigate tutoring demand among students of different examination boards with varying curricular loads within and outside the context of credentialism.
The paper highlights how credentialism and associated aspirations to bridge the income divide drive the key educational choices of middle and lower-middle income parents (and students) such as choices with respect to schools, school boards and decision to receive tutoring. Figure 1 describes the role of credentialism as the overarching driver of demand for tutoring among lower-middle and middle income parents in Bengaluru as identified in this study. It delineates how the decision to receive tutoring is an integral part of larger plans for upward social mobility. While the secondary reasons for choosing boards and receiving tutoring differ between parents (and students) attached to different boards, the primary reason
20
among both cohorts is to enter a reputed university. The two cohorts take different paths to reach the same goal.
[Figure 1: Aspirations for lower-middle and middle income parents for their children]
The insignificant relationship between socio-economic background and the decision to receive tutoring in Grade 10, and the fact that parents seek additional sources of income to provide tutoring for their children, sheds light on the strong desire of low-income families to participate in the competition to climb the social ladder. Such parents often have to settle for cheaper, less professional, informal group tutoring. Therefore, despite their investments in tutoring, their movement up the social ladder might be restricted, thereby reinforcing inequality in the society.
The finding that perceived curricular load does not have a significant relationship with the decision to receive tutoring has important policy implications. It indicates that as long as high-stakes examination scores are the principal determinant of socio-economic success, reducing the curricular load might not bring down the demand for private tutoring. Making examinations optional might not be a solution either. This was observed in India when the Central Board of Secondary Education (CBSE) made examinations optional for students of Grade 10. Despite this measure, many students opted to take the examinations due to the existing emphasis on credentials in the Indian society (India Today, 2013; The
Economic Times, 2014). Therefore, framing of policies requires a deeper conceptual
understanding of the demand for private tutoring at the macro level.
Some previous studies (e.g. Majumdar, 2014; Kumar, 2009) have highlighted curricular overload as a driver of demand for shadow education. Here, it is important to note the difference between curricular load and overload. The present study discusses perceived curricular load in the context of secondary students facing examination pressure. It does not explore whether the curriculum is overloaded. Sen (2010), while investigating private tutoring in West Bengal, highlighted ‘curricular overload’ as a factor influencing demand for tutoring among elementary school students. Therefore, further investigation is necessary to understand the impact of curricular load in lower grades, in the absence of high-stakes examinations. In addition, it is important to trace the line between bearable curricular load and curricular overload, and to explore the point at which excessive curricular content is found to overwhelm students, driving them towards tutoring.
21
demand for tutoring might differ among families belonging to higher income groups in Bengaluru. Among families with higher income, credentialism might not be a macro-level driver for demand for tutoring as they might have other means to ensure a financially and socially secured life. Therefore, further investigation is recommended among higher income groups to understand the impact of school boards. Additionally, extending the study to more boards and to other school types might lead to more concrete understanding of the impact of school boards in the decision to receive tutoring.
Note:
1 At the time of the research, the approximate exchange rates was 1 rupee = US$ 0.0147.
References
Aslam, M., & Atherton, P. (2013), “The shadow education sector in India and Pakistan: opening Pandora’s Box”, in I. Macpherson, S. Robertson and G. Walford (Eds.),
Education Privatisation and Social Justice: Case studies from Africa, South Asia and
South East Asia, Symposium Books, Oxford, pp.137-156.
Aurini, J., Dierkes, J. & Davies, S. (2013), Out of the Shadows: The Global
Intensification of Supplementary Education, Emerald Group Publishing Limited,
Bingley.
Azam, M. (2016), “Private tutoring: Evidence from India”, Review of Development
Economics, Vol. 20 No. 4, pp. 739-761.
Bray, M. & Kwo, O. (2015), “Designing and Implementing Mixed Approaches to Shadow Education Research: Experiences and Lessons in Hong Kong”, in Bray, Mark; Kwo, Ora & Jokić, Boris (Eds.), Researching Private Supplementary Tutoring:
Methodological Lessons from Diverse Cultures, CERC Studies in Comparative
Education 32. Comparative Education Research Centre, The University of Hong Kong, Hong Kong and Springer, Dordrecht, pp. 149-162.
Bray, M. (1999), The Shadow Education System: Private Tutoring and Its Implications
for Planners, UNESCO International Institute for Educational Planning (IIEP), Paris.
Bray, M. (2009), Confronting the shadow education system: What government policies
for what private tutoring?, UNESCO International Institute for Educational Planning
(IIEP), Paris.
Bray, M., & Kwok, P. (2003), “Demand for private supplementary tutoring: conceptual considerations, and socio-economic patterns in Hong Kong”, Economics of Education
Review, Vol.22 No. 6, pp. 611-620.
Bray, M., & Lykins, C. (2012), Shadow Education Private Supplementary Tutoring and
Its Implications for Policy Makers in Asia, Comparative Education Research Centre,
The University of Hong Hong, Hong Kong and Asian Development Bank, Mandaluyong City.
Bray, M., Kwo, O. and Jokić, B. (2015), “Introduction”, in Bray, Mark; Kwo, Ora & Jokić, Boris (Eds.), Researching Private Supplementary Tutoring: Methodological
Lessons from Diverse Cultures, CERC studies in comparative education 32,
Comparative Education Research Centre, The University of Hong Kong, Hong Kong and Springer, Dordrecht, pp. 3-13.
22
Bray, M., Zhan, S., Lykins, C., Wang, D., & Kwo, O. (2014), “Differentiated demand for private supplementary tutoring: Patterns and implications in Hong Kong secondary education”, Economics of Education Review, Vol. 38, pp. 24-37.
Brown, D. K. (2001), “The Social Sources of Educational Credentialism: Status Cultures, Labor Markets, and Organizations”, Sociology of Education, Vol. 74 Extra issue, pp. 19-34.
Census. (2011). “City Census”, Census India 2011, available at: http://www.census 2011.co.in/city.php (accessed 30 September 2017).
CISCE. (2017). “About the Council”, Council for the Indian School Certificate Examinations, available at: www.cisce.org/council.aspx, (accessed 30 September 2017).
Collins, R. (1979), The Credential Society: An Historical Sociology of Education and
Stratification, Academic Press, New York.
Collins, R. (2002), “Credential Inflation and the Future of Universities”, in Brint S. (ed.),
The Future of the City of Intellect: The Changing American University, Stanford
University Press, Stanford, pp. 23-46.
Davis, D. J. (1981), “Back to Beginnings: Credentialism, Productivity, and Adam Smith's Division of Labour”, Higher Education, Vol. 10 No. 6, pp. 649-661.
Dore, R. (1997). The Diploma Disease. Education, Qualification and Development (2nd ed.), Institute of Education, University of London, London.
Economic Times, The. (2014), “CBSE class X board exams may be made mandatory again”, available at: http://articles.economictimes.indiatimes.com/2014-11-21 /news/56340083_1_class-10-board-exams-cbse-class-smriti-irani (accessed 30 September 2017).
Government of India (2015), Key Indicators of Social Consumption in India: Education.
NSS 71st Round, Ministry of Statistics and Programme Implementation, National
Sample Survey Office, New Delhi.
Government of Karnataka. (2002), Shaping Education in Karnataka. Goals and
Strategies, Eduvision, Bangalore, available at: http://karnatakaeducation.gov.in
/pdf_files/Eduvision.pdf (accessed 30 September 2017).
India Today (2013), “Students opt for optional CBSE Class 10 board exams”, 24 December, available at: http://indiatoday.intoday.in/education/story/students-opt-for-optional-cbse-class-10-board-exams/1/332693.html (accessed 30 September 2017). Ireson, J., & Rushforth, K. (2011), “Private tutoring at transition points in the English
education system: its nature, extent and purpose”, Research Papers in Education, Vol. 26 No.1, pp. 1-19.
Joshi, K. (1977), Problems of higher education in India. An Approach to Structural
Analysis and Reorganisation, Popular Prakashan, Bombay.
Kim, S., and Lee, J. (2010), “Private Tutoring and Demand for Education in South Korea”, Economic Development and Cultural Change, Vol. 58 No. 2, pp. 259-296. KSEEB (2017), “Karnataka Secondary Education Examination Board”, available at:
http://kseeb.kar.nic.in/ (accessed 30 September 2017).
Kumar, R. (Coordinator), (2009), The Pratichi Education Report II: Primary Education in West Bengal – Changes and Challenges, Pratichi (India) Trust, New Delhi, available at: http://pratichi.org/sites/default/files/Pratichi_Education-Report_II.pdf (accessed 30 September 2017).
Lee, C. J., Park, H. J., & Lee, H. (2009), “Shadow education systems”, in G. Sykes, B. Schneider, & D. N. Plank (Eds.), Handbook of Education Policy Research, Routledge, New York, pp. 901–919.
23
Maheshwari, S. (2013), Private Tuition in West Bengal, India: Nature, Participation,
Determinants of Demand and Equity Issues in Secondary Schools, MEd Dissertation,
The University of Hong Kong, Hong Kong.
Majumdar, M. (2014), “The Shadow School System and New Class Divisions in India”, Working Paper, TRG Poverty & Education, Max Weber Stiftung, available at: http://www.ghil.ac.uk/fileadmin/redaktion/dokumente/trg_india/Paper%202%20Mana bi%20Majumdar.pdf (accessed 30 September 2017).
MHRD (2011), Report of the Working Group on Private Sector participation including
PPP in School Education for the 12th Five Year Plan, Ministry of Human Resource
Development, Government of India, New Delhi, available at: http://planningcomm ission.gov.in/aboutus/committee/wrkgrp12/hrd/wg_pppschool1708.pdf (accessed 30 September 2017).
MHRD (2014), Statistics of School Education 2011-12, Ministry of Human Resource Development: Bureau of Planning, Monitoring & Statistics, Government of India, New Delhi, available at: http://mhrd.gov.in/sites/upload_files/mhrd/files/statistics /SSE1112.pdf (accessed 30 September 2017).
NIOS (2017), Prospectus 2017-18: Academic Courses: Secondary and Senior Secondary,
National Institute of Open Schooling, Government of India, available at: http://nios.ac.in/media/documents/prospectus/AcadProspectus_2017_18.pdf (accessed 30 September 2017).
Sen, A. (2010). “Primary schooling in West Bengal”, Prospects, Quarterly Review of
Comparative Education, Vol. 40 No.3, pp. 311-320.
Sharma, O. P. (1991). Administration of education boards in India, Ashish Publishing House, New Delhi.
Stevenson, D. L., & Baker, D. P. (1992), “Shadow Education and Allocation in Formal Schooling: Transition to University in Japan”, American Journal of Sociology, Vol. 97 No. 6, pp. 1639-1657.
Sujatha, K. (2014), “Private tuition in India: trends and issues”, International Journal of
Sevres Education [Online] Symposium : Education in Asia in 2014, available at:
http://ries.revues.org/3796 (accessed 30 September 2017).
Sujatha, K., & Rani, G. (2011), “Private Tuition at Secondary Level: Trends and Troubles”, in Management of Secondary Education in India, Shipra and National University of Educational Planning and Administration (NUEPA), New Delhi, pp. 104-162.
World Bank, The (2009), Secondary Education in India: Universalising opportunity,
Human Development Unit South Asia Region, available at: http://documents .worldbank.org/curated/en/262201468285343550/pdf/485210v10SR0wh10Box33891 3B01PUBLIC1.pdf (accessed 30 September 2017).
Zhang, W. & Bray, M. (2017), “Micro-neoliberalism in China: public-private interactions at the confluence of mainstream and shadow education”, Journal of Education Policy, Vol. 32 No. 1, pp. 63–81.
Zhang, W. (2014), “The Demand for Shadow Education in China: Mainstream Teachers and Power Relations”, Asia Pacific Journal of Education, Vol. 34 No. 4, pp. 436-454.
24
Table 1: Variable description and participation in tutoring
Explanatory variable Description
% of students participating in tutoring Micro-level factors Gender Male 56.6 Female 47.2 Male + Female 52.5 Students’ perception of their academic performance Excellent 36.8 Good 53.5 Fair 55.8 Poor 55.6 Socio-economic status High 56.8 Medium 51.8 Low 50.8
Free support received by students
School teacher helps in school 58.0 School teacher helps at her home 63.6
Sibling helps at home 46.4
Parents or grandparents help at
home 50.0
None of the above 54.8
Meso-level factors
Education board ICSE board 50.9
State board 54.3
Board examination Grade 10 71.7
25
Table 3: Binary logistic regression models for classes taking internal school examinations (non-Grade 10)
Explanatory Variables Dependent Variable
Beta S.E. Exp (B)
School Board (State Board = 0) -0.252 0.194 0.777
SES Score (reference: high)
SES Score (Low) -0.531** 0.266 0.588
SES Score (Medium) -0.408* 0.244 0.665
Constant 0.174 0.231 1.19
Goodness of fit test (Hosmer and Lemeshow)
Chi-square 3.559
Df 4
Sig. 0.469
N = 447, no missing cases *p< 0.1 **p<0.05 ***p<0.01
Table 2: Binomial logistic regression models for demand for private tutoring
Explanatory Variables Dependent Variable
Beta S.E. Exp (B)
Micro-level
Gender (Female=0) 0.398** 0.17 1.488
Perceived academic performance (low and moderate achievers = 0)
-0.735** 0.285 0.479
Free support
School teacher at school (yes = 0) 0.155 0.237 1.168
Brother or sister (yes = 0) 0.464** 0.219 1.59
Parents or grandparents (yes = 0) 0.391* 0.226 1.479 School teacher at her/his home (yes = 0) -0.659 0.68 0.517
No free support (no support = 0) 0.466 0.293 1.594
SES Score (reference: high)
SES Score (Low) -0.305 0.23 0.737
SES Score (Medium) -0.33 0.224 0.719
Meso-Level
School Board (State board = 0) -0.038 0.173 0.962
Board examination (Class X = 0) -1.278*** 0.186 0.279
Constant 0.684 0.877 0.608
Goodness of fit test (Hosmer Lemeshow)
Chi-square 5.887
Df 8
Significance 0.660
N = 636 Missing cases = 51 *p< 0.1 **p<0.05 ***p<0.01
26
Table 4: Binary logistic regression for Board examination taking classes (Grade 10)
Explanatory Variables Dependent Variable
Beta S.E. Exp (B)
School Board (State Board = 0) 0.401 0.306 1.494
SES Score (reference: high)
SES Score (Low) 0.31 0.378 1.363
SES Score (Medium) 0.272 0.367 1.313
Constant 0.541 0.318 1.717
Goodness of fit test (Hosmer and Lemeshow)
Chi-square 0.34
Df 4
Sig. 0.987
(N) 240, no missing cases *p< 0.1 **p<0.05 ***p<0.01