IDS
EVIDENCE REPORT
No
135
Pro-Poor Electricity Provision
Pro-Poor Access to Green Electricity in Kenya
Ana Pueyo
PRO-POOR ACCESS TO GREEN ELECTRICITY IN KENYA
Ana Pueyo May 2015
This is an Open Access publication distributed under the terms of the Creative Commons Attribution License, which permits unrestricted use, distribution, and reproduction in any medium, provided the original author and source are clearly credited.
First published by the Institute of Development Studies in May 2015 © Institute of Development Studies 2015
The IDS programme on Strengthening Evidence-based Policy works across seven key themes. Each theme works with partner institutions to co-construct policy-relevant knowledge and engage in policy-influencing processes. This material has been developed under the Pro-Poor Electricity Provision theme.
Special thanks to Rachel Godfrey-Woods for her review and suggestions.
The material has been funded by UK aid from the UK Government, however the views expressed do not necessarily reflect the UK Government’s official policies.
Contents
Abbreviations 2
Executive summary 3
1 Introduction 6
2 Conceptual background: what is pro-poor access to electricity? 7
3 Methodology 9
4 Targeting the poor 11
4.1 Access to electricity 11 4.2 Current and planned electricity infrastructure 15
4.3 Poverty 19
5 Financial sustainability 21
5.1 Least cost mix of centralised and decentralised power 21 5.2 Commercial viability for project developers 22 5.3 Financial sustainability for the State 24
6 Affordability 26
7 Discussion and conclusions 29
7.1 Without an explicitly pro-poor electrification strategy, Kenya’s poor will be
left behind 29
7.2 High costs of finance compromise affordability for the poor 30
References 32
Figures
Figure 4.1 Urban household electrification levels 12 Figure 4.2 Rural household electrification levels 12 Figure 4.3 Total electrification levels and off-grid counties 13 Figure 4.4 Electrification levels, population density and total population per county (%) 13 Figure 4.5 Number of people without electricity 14 Figure 4.6 Transmission and distribution network in Kenya 16 Figure 4.7 National poverty profile by county, 2005–06 20 Figure 4.8 Number of people living in poverty per district 20 Figure 5.1 Standard small-scale FiTs 24
Tables
Table 3.1 Data for the assessment of the poverty impact of electrification
alternatives 9 Table 4.1 Enterprise survey data on the quality of electricity infrastructure, 2013 17 Table 4.2 Estimated electricity requirements of Vision 2030 flagship projects 18 Table 6.1 Electricity price per kWh and for subsistence consumption of 20kWh and
Abbreviations
AFD Agence Française de Développement (French Development Agency) AfDB African Development Bank
BSP bulk supply point
CDM Clean Development Mechanism CER certified emissions reduction EIB European Investment Bank ERC Energy Regulatory Commission FCC fuel cost charge
FERFA foreign exchange rates fluctuation adjustment FiT feed-in tariff
GIS geographic information system GoK Government of Kenya
GTF Global Tracking Framework IA inflation adjustment
ICF International Climate Fund IEA International Energy Agency
IEBC Independent Electoral and Boundaries Commission IED Innovation Energie Développement
IMF International Monetary Fund IPP independent power producer IRR internal rate of return
JICA Japan International Cooperation Agency KenGen Kenya Electricity Generating Company KETRACO Kenya Electricity Transmission Co. Ltd.
KIPPRA Kenya Institute for Public Policy Research and Analysis KPLC Kenya Power
KSh Kenyan shilling kV kilovolt
kW kilowatt kWh kilowatt-hour
LCPDP Least Cost Power Development Plan LRMC long-run marginal cost
MV medium voltage MVA megavolt-ampere MW megawatt
OECD Organisation for Economic Co-operation and Development PDD project design documents
PPA power purchase agreement PV photovoltaic
REP Rural Electrification Programme RoE return on equity
SE4ALL Sustainable Energy for All SHS solar home system
SSA sub-Saharan Africa
Executive summary
Is Kenya on the road to achieving an electricity system which is both green and pro-poor? What are the main challenges to pursuing this goal? The two questions guiding this study are particularly relevant in a country with exceptional renewable energy resources, where 80 per cent of the population lacks access to electricity and 50 per cent lives in poverty.
What is pro-poor access to electricity?
Pro-poor access to electricity is access that provides poor people with energy services enabling poverty reduction. These services include, for example: light, information and communications technologies, mechanical power for productive uses, and refrigeration or water pumping. Their poverty impacts may consist of income generation, female
empowerment, or better education and health. To enable these impacts, electricity needs to be consumed at a sufficient level by the poor and provided with reliability and quality. Access to electricity can be considered pro-poor in its weak form when it results in absolute increases in its use and in outcomes for the poor, regardless of how access improves for the non-poor. In a strong form, pro-poor access requires that availability, use and outcomes of electricity increase further for the poor than for wealthier groups, so that inequality in access to electricity also falls.
How can it be achieved?
The poverty effects of the supply of electricity are not automatic, however, and a number of intermediate goals need to be achieved for benefits to occur. Firstly, once electricity is generated, grid-connected generation needs to be reliably fed into the system and off-grid solutions need to provide a durable and sufficient level of access to electricity. Secondly, this additional supply must be made accessible and affordable for the poor. With on-grid energy, this is a matter of extending the grid to areas with high poverty incidence, ensuring the quality and reliability of supply and setting connection costs and consumption tariffs which are affordable for the poor. For off-grid energy, it is a question of situating the generating capacity in areas of high poverty incidence, using business models that make upfront costs affordable for the poor and ensuring durability of the generation technology. Thirdly,
electricity needs to be used at a sufficient level and for a diversity of activities, crucially including income generation activities, if it is to translate into poverty reduction. Fourthly and finally, increased electricity supply can also indirectly reduce poverty by boosting economic growth provided that redistribution mechanisms are in place which allow the poor to benefit from this growth.
What are the main challenges for Kenya to follow a pro-poor,
green electrification strategy?
An analysis of electrification and poverty rates and geography in Kenya, financial sustainability of green electricity and affordability delivers two main conclusions:
1. Without an explicitly pro-poor electrification strategy, Kenya’s poor will be left behind The large gap between poverty levels and electrification rates in Kenya points at a significant supressed demand: 93 per cent of the rural population has not got access to electricity, but ‘only’ 50 per cent is below the poverty line. Thus a large share of the rural population would be able to afford grid electricity tariffs at their current level. Private developers of off-grid alternatives are also finding willingness to pay for higher tariffs, and while excessive
connection costs are a major hurdle to grid connections, these could be addressed with finance plans like the recently piloted ‘stima loan’.
The Government of Kenya (GoK) does not have an explicit mandate to target the poorest first and private investors naturally look for the most profitable ventures. Therefore, centralised and decentralised electrification strategies in Kenya are likely to target those people living in dense settlements close to the existing grid and where poverty levels are lower than lack of access. Besides, a large share of public investments focuses on guaranteeing supply for commercial and industrial users in order to achieve ambitious economic growth targets. Consequently, a strong or even a weak form of pro-poor electrification is not likely to happen in Kenya without further public intervention.
Interventions that try to reach the poor through subsidies on final consumption or capital costs risk crowding out much needed private investment and benefiting the better off. However, acknowledging the importance of equitable access to energy requires public funders to focus on the worse-off, who would not be able to afford a minimum level of consumption otherwise.
2. High costs of finance compromise affordability for the poor
The high cost of equity (close to 20 per cent) and debt (around 10 per cent) for renewable energy projects in Kenya as compared to international benchmarks reflect investors’ high perceived risks. Providing financiers with their required rates involves charging expensive tariffs, which damages affordability. To protect consumers from excessive prices, the
government has set a pricing cap for all grid-connected plants. The cap is considered too low for many wind, biomass and especially solar projects. This means that for these
technologies, only those projects located in sites with exceptional resources are commercially viable. Additionally, for rural connections to the grid to be financially sustainable there needs to be a sufficient level of household demand as well as enough connection requests to pay for distribution lines. These conditions are often not met.
Decentralised supply does not enjoy much government support but on the other hand is not subject to tariff caps. Given the large suppressed demand in rural areas, project developers are finding willingness to pay the high prices of electricity that are compatible with a 20 per cent return on equity (RoE). While this solves the problem of lack of access for those who can pay, it is not a solution for pro-poor provision.
Which policies could address these challenges?
A two-tiered approach to electrification in Kenya could be followed consisting of a large off-grid programme to cover the basic lighting needs of the rural poor and a off-grid intensification strategy for the urban poor, while more ambitious, market-based, electrification efforts that allow for productive uses are continued in parallel. The most challenging aspects of this approach are tracking the most vulnerable that require support while avoiding rent seeking or crowding out of the private sector. Previous experiences in reaching the most vulnerable with social protection, mainly cash transfer programmes, could be highly valuable to address these challenges, but Kenya’s cash transfer programmes are still mainly in their early stages. The issue of large financing costs which are incompatible with affordability can be addressed in three ways. Firstly, by directly addressing the risks which are the root-cause of those high costs. These include deficient power purchase agreement (PPA) procurement processes, a lack of clear and credible regulations for decentralised small power producers, an unstable feed-in tariff (FiT) policy, weaknesses in grid management, risk of non-payment by the national utility, and bottlenecks in the financial sector or political risks. Secondly, for those risks that are difficult to mitigate with policy, financial de-risking instruments like guarantees
or political risk insurance can be used to transfer investors’ risks to public actors such as development banks. Finally, and in line with the proposed two-tiered approach, impact investors and donors willing to accept lower than market RoE could address the least advantaged segments of the population.
1 Introduction
Is Kenya on track to follow an electrification strategy that is green and pro-poor? What are the main challenges to following this path? The two questions guiding this study are particularly relevant in a country with exceptional renewable energy resources, but where 80 per cent of the population lacks access to electricity and 50 per cent lives in poverty. This study looks at four particular issues relating to access to green electricity for the poor: accessibility; commercial viability for project developers; financial sustainability for the State; and affordability. We will focus on grid electricity and mini-grids. For grid-connected
generation, once electricity is fed to the grid, the issues of accessibility and affordability for the poor depend on national policies determining who gets electricity and at what price, making it impossible to differentiate between green and non-green electricity. However, our study will show whether or not on-grid renewable generation can be financially sustainable in Kenya while providing affordable fees. For off-grid electricity, targeting the poor is a matter of situating generation capacity in the right places and affordability is a matter of setting prices that allow for cost recovery without being excessively expensive for the poor.
This report can support decision-making for development and climate finance institutions, as well as private investors in Kenya seeking a pro-poor green electrification strategy. It shows how to target the poor, which electrification alternatives to use, at what price, whether or not this is commercially viable and which policies would be required to make it so. Our
methodology for data collection is primarily desk-based and draws from Maximisation of Benefits for the Poor of Investments in Renewable Electricity: A Policy Tool for Project Planning, which has been developed as part of IDS’ pro-poor access to electricity research
programme (Pueyo, Spratt and DeMartino 2014). These data were complemented by interviews with Kenyan practitioners and insights from a focus group discussion held in Nairobi in February 2015.
The report is structured as follows: Section 2 defines the concept of pro-poor access to electricity. Section 3 provides details of the methodology and data used. Section 4 analyses some key issues of targeting the poor: how many people do not have access to electricity and where they are located; the current plans to improve Kenya’s electricity system; how many people are poor and where they are located. Section 5 looks at the financial issues of least cost mix of grid and off-grid electricity, the commercial viability of renewable energy projects and the existing financial support from the State or external donors. Section 6 analyses affordability for the poor on the basis of predefined subsistence levels of consumption and affordability thresholds. Section 7 concludes by showing the main challenges that need to be addressed for Kenya to deliver an electrification strategy that is clean and pro-poor.
2 Conceptual background: what is pro-poor
access to electricity?
Pro-poor access to electricity is access that is good for the poor. However, interpretations of this are likely to differ. Firstly, there is a need to clearly define ‘access to electricity’. Access to electricity involves not only the availability of supply (i.e. in the form of a home system, a mini-grid or a distribution network in a community) but also accessibility (i.e. whether or not poor households can actually connect and pay the costs of connection and supply) and use (i.e. the energy services actually provided by electricity). Besides, a simple measure of access to electricity glosses over variation in the amount, quality and reliability of supply. There can be large differences in the amount of power being delivered, from, say, a 50-watt solar home system up to a grid-connected source with unlimited power; or in its quality, from low and fluctuating voltage to high voltage quality. There can also be widely varying
experiences in the reliability of supply. In many developing countries, power may be available only for a few hours a day on a regular basis; in other situations supply may be interrupted in an unpredictable way.
For the reasons above, the Global Tracking Framework (GTF) of the Sustainable Energy for All (SE4ALL) initiative proposes to measure access to electricity along various dimensions related to potential energy services (Banerjee et al. 2013). Multiple tiers of access to electricity are defined by increasing levels of supply attributes, including quantity (peak available capacity); duration/availability (number of hours); reliability (unscheduled outages); quality (level and stability); health and safety (electrocution, air pollution, burning risk,
drudgery); legality; affordability; and convenience (time and effort to source energy). Higher attributes lead to higher tiers and more and more electricity services become feasible. The use of electricity services can also be measured using multiple tiers based on ownership of appliances categorised by tier, each corresponding to the equivalent tier of electricity
required for their adequate operation. The GTF proposal is technology neutral and only looks at the services enabled by electricity, regardless of whether it is provided through on-grid, off-grid or mini-off-grid solutions. We propose to follow this approach when defining access to electricity and considering the poverty impacts that it could achieve.
Secondly, access to electricity that is ‘pro-poor’ should improve the availability and actual use of electricity as well as its impacts on a number of poverty dimensions for the poor. Benefits of electricity use for the poor include improved household productivity, which may liberate time (particularly for women), for paid employment, education, entertainment, or unpaid care work; improved education for children who are able to study in the evenings; and new income generation opportunities. A thorough review of the evidence of these impacts is provided in Pueyo et al. (2013).
In its weak form, access to electricity would be considered pro-poor when it results in
absolute increases in its use and outcomes for the poor, regardless of how access improves for the non-poor. Under this definition, it would be expected that progress along the different tiers of access to electricity in a country will eventually benefit the poor, whether or not they are specifically targeted. In its strong form, pro-poor access requires that availability, use and outcomes of electricity increase more for the poor than for wealthier groups, so that
inequality in access to electricity also falls.
The preference for one or the other definition of pro-poor access to electricity depends on one’s objectives and ideology. For example, one of the three objectives of SE4ALL is to ensure universal access to modern energy services by 2030. In this case, the absolute
definition is better, as the emphasis will be put on electrification programmes that can reach the scale required to increase the number of customers. If instead, the aim is to reduce the energy poverty gap between the poor and the wealthy, a relative definition would be
preferable, and electrification programmes that target the bulk of their resources to target the poor would be prioritised. This report adopts the second approach, showing Kenya’s status and prospects of electrification for the poor.
3 Methodology
The assessment of Kenya’s potential for the provision of green and pro-poor access to electricity is based on a methodology for the Maximisation of Benefits for the Poor of Investments in Renewable Electricity (Pueyo et al. 2014) developed by IDS after a comprehensive review of the evidence of poverty impacts of electrification (Pueyo et al.
2013). The review concluded that electricity access does not automatically lead to poverty reduction. A number of intermediate goals need to be achieved for benefits to take place. Firstly, once electricity is generated, grid-connected generation needs to be reliably fed into the system and off-grid solutions need to provide a durable and sufficient level of access to electricity. Secondly, this additional supply must be made accessible and affordable for the poor. With on-grid energy, this is a matter of extending the grid to areas with high poverty incidence, making connection costs affordable and providing a high quality of supply. For off-grid energy, it is also a question of situating the generating capacity in areas of high poverty incidence, using business models that make upfront costs affordable for the poor and ensuring durability of the generation technology. Thirdly, electricity needs to be used at a sufficient level and for a diversity of activities, in particular including income generation activities, if it is to translate into poverty reduction. Fourthly and finally, increased electricity supply can also indirectly reduce poverty by boosting economic growth if redistribution mechanisms are in place that allow the poor to benefit.
When planning electrification projects, decisions can be taken at each of the steps above to lead to greater impacts on poverty. This country brief intends to inform pro-poor electrification initiatives in Kenya by looking in particular at the following aspects:
1. Targeting the poor 2. Financial sustainability 3. Affordability for the poor
Addressing each of these issues requires collection of national and project data such as that detailed in Table 3.1.
Table 3.1 Data for the assessment of the poverty impact of electrification
alternatives
Topic Country level data
Targeting the poor
Number and location of people with no access to electricity Number and location of poor people
Rural electrification plans
Electricity consumption per capita Demand projections
Quality of the existing grid: Technical losses of the national grid, ease of getting a connection, number and duration of outages, voltage and frequency fluctuation
National current and planned generation capacity and transmission and distribution network
Table 3.1
(Cont’d.)
Topic Country level data
Financial sustainability
National discount rates (for example: government bond rates, cost of finance for electricity projects based on bankers’ views and private equity investors/funds)
Internal rate of return and payback periods of different generation alternatives
Subsidy schemes and tax incentives for renewable energy
Equity of subsidies: share of the subsidy captured by households living under the poverty line divided by the percentage of households in the population that live under the poverty line
Infrastructure investments required for different generation alternatives (i.e. transmission and distribution network)
Affordability Household budgets
Household expenditure on non-transport fuels National overall and food poverty line
Connection costs and credit for these Consumption fees
Cost of a subsistence level of consumption
Customer’s control over their bill through, for example, prepayment meters, pay-as-you-go or lease-to-buy schemes
These data were collected using publicly available sources and complemented by interviews and discussions with local practitioners as well as the insights provided during a focus group discussion held in February 2015 in Nairobi.
4 Targeting the poor
4.1 Access to electricity
Recent figures on access to electricity1 show that 33.6 million people (80 per cent of a
population of 42 million) in Kenya lacked access to electricity in 2011 (International Energy Agency 2013). This means that Kenya has the seventh highest deficit in access to electricity in the world, making it a priority country on the list of several organisations working towards universal access to electricity. For example, Kenya is one of the ‘high-impact’ countries of the SE4ALL initiative, one of the six target countries of USAID’s Power Africa initiative, a key beneficiary of the World Bank’s Lighting Africa initiative and one of the target countries of DFID’s ambitious plans to promote green mini-grids in Africa under the International Climate Fund (ICF).
The attention Kenya receives is well justified. Electricity consumption per capita was 155kWh per year in 2011, as compared to an average 219kWh in all low income countries, 535kWh in sub-Saharan Africa and a world average of 3,045kWh. Generation capacity as of March 2014 was 1,810MW (Republic of Kenya 2014). Countries such as Honduras, Albania or Panama, with a similar level of capacity, serve populations 18 per cent, 6 per cent and 9 per cent the size of Kenya’s, respectively. Honduras and Albania also have much smaller economies. Argentina, Ukraine and Spain, with a similar population size to Kenya, have generation capacities of 33, 55 and 100GW respectively.
Electricity provides only 9 per cent of the total final energy consumption in Kenya, after petroleum, which provides 22 per cent and biomass, which contributes 69 per cent (Republic of Kenya 2014). This is a common division of energy sources for countries with high levels of poverty but the shares of electricity and petroleum increase as countries’ welfare levels increase. Electricity is an aspirational source of energy for the Kenyan government, which sees it as crucial to fulfil the economic growth and industrialisation targets set in its National Development Strategy Vision 2030 (Republic of Kenya 2007). Electricity consumption has experienced a dramatic growth in Kenya in the past decade. The number of Kenya Power (KPLC) customers has trebled since 2005, reaching 2,330,962 in 2014 according to the national utility’s latest annual report (Kenya Power 2014). Around 80 per cent of customers are served by the national grid and 20 per cent by mini-grids.
The electrification gap is larger in rural areas, where only 7 per cent of the population has access, as compared to an urban electrification rate of 58 per cent (International Energy Agency 2013). There are also significant differences across counties and
constituencies/districts. Figures 4.1 and 4.2 reveal disparities in electrification levels across districts, based on the 2009 Census (Kenya National Bureau of Statistics 2010), which is the most up-to-date regional information available. Total urban and rural electrification rates provided by this source are different from those of the International Energy Agency (IEA), but they usefully demonstrate the wide differences between the least electrified Northern and Eastern counties, with close to 0 per cent rural electrification rates, and the over 60 per cent urban electrification rates of Nairobi, Kiambu, Kajiado or Lamu.
1 The IEA defines access to electricity at the household level as involving both a supply connection to the household and the consumption of a specified minimum level of electricity, 250kWh per year for rural households and 500kWh per year for urban households. Energy poverty is defined as consumption levels lower than 650kWh per year, including all energy sources required to meet basic needs of lighting, heating and cooking (Pereira, Freitas and da Silva 2010).
Figure 4.1 Urban household electrification levels
Source: Adapted from Parsons Brinckerhoff (2013).
Figure 4.2 Rural household electrification levels
Source: Adapted from Parsons Brinckerhoff (2013).
Figure 4.3 shows total electrification rates per county, highlighting in red those counties that are off-grid. The larger towns in these off-grid territories are supplied by mini-grids mostly powered with diesel generators, and in some cases backed up with renewable power sources such as solar PV.
Figure 4.3 Total electrification levels and off-grid counties
Source: Author’s own, based on data from Parsons Brinckerhoff (2013).
There is no clear relationship between the electrification rate, the amount of population and population density per county, with the exception of the extremes: the two largest urban counties with the highest population densities are also those with the highest electrification rates and the five counties with the lowest electrification rates also have very low population densities. In the middle, there are several counties with relatively high population densities but low electrification rates (for example: Bungoma, Vihiga, Kisii) as well as counties with very low population densities but relatively high electrification rates (Nakuru, Baringo, Kajiado).
Figure 4.4 Electrification levels, population density and total population
per county (%)
Source: Author’s own, based on data from Parsons Brinckerhoff (2013) and the final report by the Independent Electoral and Boundaries Commission (IEBC) as ratified in the National Assembly Constituencies and County Assembly Wards Order, 2012.
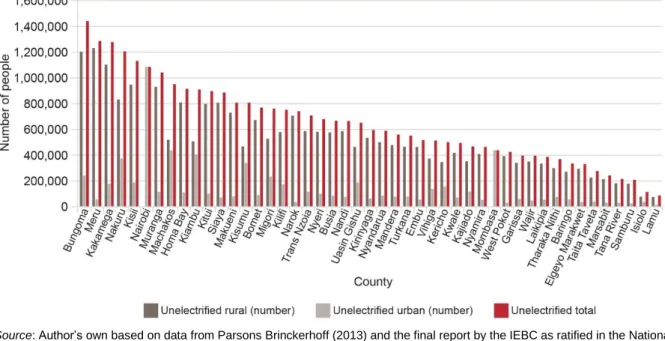
The final graph shows that most of the people without electricity are located in Western and Central counties with large rural populations and within reach of the existing transmission and distribution network.
Figure 4.5 Number of people without electricity
Source: Author’s own based on data from Parsons Brinckerhoff (2013) and the final report by the IEBC as ratified in the National
Assembly Constituencies and County Assembly Wards Order, 2012.
Information on off-grid access to electricity beyond the mini-grids operated by KPLC is very limited and is mostly provided by academics and donors. It suggests that there has been a great success of solar home systems (SHSs) driven by a thriving demand for energy
services, mainly lighting, TV and mobile phones. The estimated number of SHSs installed in Kenya by 2010 amounted to 320,000 (Ondraczek 2013), with around 4.5 per cent of rural households predicted to own a SHS by 2013 (ibid).
Electricity demand is expected to be 14 times higher in 2031 than in 2010, which will put the Kenyan system under high strain, according to the official Kenyan demand forecast
presented in the Least Cost Power Development Plan (LCPDP) (Republic of Kenya 2011). Rural consumption would represent 2 per cent of the total consumption in 2031, urban consumption 13 per cent, industrial and commercial 79 per cent. A further 6 per cent would be required to power Vision 2030 flagship projects, which are expected to promote economic growth and include several energy-intensive projects such as a Technology Park, railways, the development of the iron and smelting industry and resort cities. Demand predictions assume an increase in urbanisation from 32 per cent in 2009 to 63 per cent in 2031, and close-to universal access to electricity in urban areas with approximately 60 per cent
coverage in rural areas (Parsons Brinckerhoff 2013). Expected residential uses are therefore much lower than those observed in OECD countries where they represent 31 per cent of total consumption (International Energy Agency 2013). It shows a prioritisation of industrial development over the provision of universal access to electricity. County demand forecasts show the largest increase in Nairobi, growing from 400MW peak demand in 2011 to close to 4,500MW in 2030, followed by Mombasa and Kiambu. Nairobi alone would represent more than one-third of the country’s peak demand in 2030. Off-grid counties (some of which will be connected to the national grid by 2030) will represent less than 2 per cent of total
4.2 Current and planned electricity infrastructure
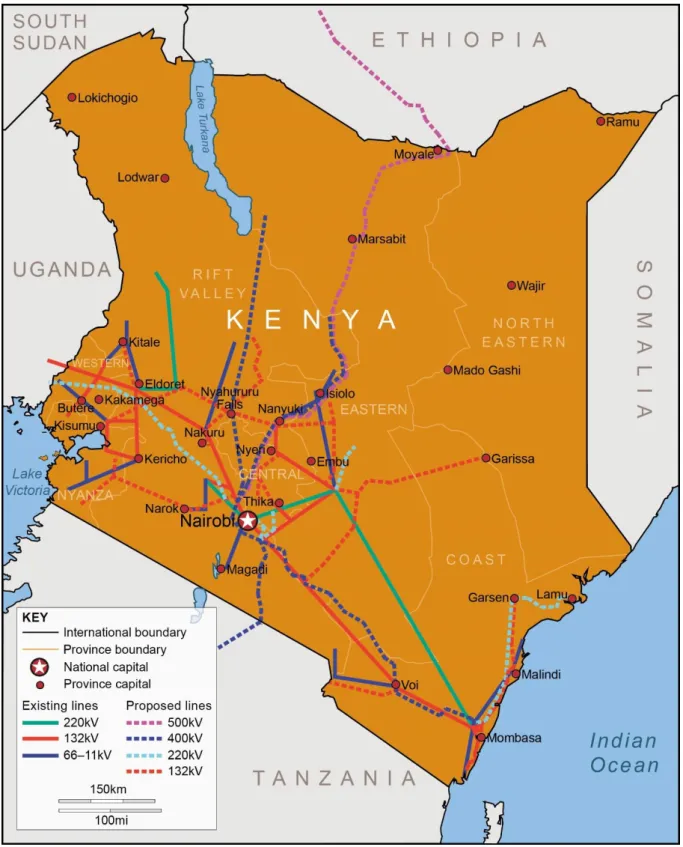
Kenya’s national grid operates in four regions: Nairobi, Coast, Western and Mount Kenya, as shown in Figure 4.6. Eight Kenyan counties are totally off grid: Lamu, Tana River, Garissa, Mandera, Wajir, Marsabit, Samburu and Turkana. There are ongoing projects to connect off-grid power plants in Garissa and Lamu to the national off-grid. Kenya’s Distribution Master Plan also indicates an economic case for the extension of the grid to off-grid plants in Lodwar (Turkana), Marsabit (Marsabit), Wajir (Wajir) and Habaswein (Wajir) (Parsons Brinckerhoff 2013).
Out of the four regions where the national grid operates, the Nairobi region is the best interconnected, being supplied from the transmission network via several 220/66kV and 132/66kV transmission substations or bulk supply points (BSPs). The distribution network in the regions outside Nairobi is less interconnected, with many radial 33kV and 11kV feeders and generally with long distances between BSPs.
Most rural areas within the regions where the national grid operates have not got a supply point due to the limitations of the distribution network. Rural communities with a connection to the grid suffer frequent and prolonged outages and poor voltage levels. The dire condition of the distribution network in rural areas, with long and undersized feeders, also causes high losses and long response times. Electric power losses in transmission and distribution
(including pilferage) reached 17 per cent of output in Kenya in 2011, compared to 11 per cent in sub-Saharan Africa as a whole and 8 per cent in the world (World Bank 2014 – World Development Indicators). The demand forecast as shown in Kenya’s Distribution Master Plan Study assumes that grid efficiency will not improve in the period 2011–31, projecting
transmission and distribution losses of 19 per cent by 2031. Losses will account for almost twice as much as all residential consumption by 2031, which urgently calls for improvements in the transmission and distribution network as a sound strategy to provide electricity for the poor.
Figure 4.6 Transmission and distribution network in Kenya
Source: Adapted from Republic of Kenya (2011) and Kenya Power (2013).
World enterprise data presented in Table 4.1 shows a large number and duration of electrical outages, with significant consequences for enterprises in terms of lost sales. The high
prevalence of own generators is an indicator of the bad quality and coverage of the national grid. The large number of days required to obtain a connection is due to the backlog of businesses (and households) on waiting lists, which indicates a strong demand for electricity and constraints in the national utility.
Table 4.1 Enterprise survey data on the quality of electricity
infrastructure, 2013
Kenya SSA* All countries
Number of electrical outages in a typical month 6.3 7.8 5.6
Duration of a typical electrical outage (hours) 4.9 5.0 2.7
Losses due to electrical outages (% of annual sales) 5.6 4.9 2.5 Percentage of firms owning or sharing a generator (%) 56.8 45.7 32.1
Proportion of electricity from a generator (%) 7.8 12.6 7.0
If a generator is used, average proportion of electricity
from a generator (%) 14.2 24.6 18.8
Days to obtain an electrical connection (upon
application) 42.4 32.8 31.1
Percentage of firms identifying electricity as a major
constraint 22.9 44.8 33.5
Note: * sub-Saharan Africa.
Source: Author’s own, with data from World Bank (2013).
Kenya’s existing transmission network comprises 1,331km of 220kV and 2,436km of 132kV. Kenya’s National Energy Policy shows the Kenya Electricity Transmission Company’s (KETRACO) plans to extend the national transmission network to enable the evacuation of additional generation capacity planned by 2016, to provide interconnection links with the neighbouring countries, reduce transmission losses and link off-grid areas to the national grid. This will require 6,270km of transmission lines between 2011 and 2017 and 16,000km by 2031. Plans to improve the distribution network are equally ambitious in facilitating new connections, reducing system losses and enhancing reliability and quality of supply. They involve more than 200,000km of new distribution lines and 100,000MVA (megavolt-ampere) of substation and transformer capacity (Republic of Kenya 2014).
The GoK has received a KSh12.2bn (US$133m) loan from the African Development Bank (AfDB) to finance the Last Mile Connectivity project, through which the distribution network will be extended to reach households within 600 metres from the around 35,000 distribution transformers spread across the country. This proposed project would involve the construction of a distribution system, which entails 11,723 metres of low voltage distribution lines, and the installation of equipment for the connection of 250,809 households and 27,868 commercial customers. There is no clarity, however, about which households in which counties will be targeted by the project. The total cost of the project is estimated at US$147m, with GoK contributing the remaining US$14m (Otieno 2014). This complements the effort of the Rural Electrification Programme (REP) to provide electricity to public facilities in rural areas,
including trading centres, secondary schools and polytechnics and health centres. As of June 2014, the government had reached 23,167 out of the existing 25,873 facilities.
There are also plans to increase electricity generation capacity by 5,000MW from October 2013 to reach 6,762MW by 2017 (Republic of Kenya 2014). This would involve massive investments including 24MW of hydro, 630MW of wind, 1,643MW of geothermal, 1,920MW of coal, 1,050 of LNG, 250MW of diesel and 18MW of co-generation. Coal and geothermal sources would account for the largest share of the electricity generation mix by the end of 2016. These targets are more ambitious than those set up in the latest Least Cost Power Development Plan (2013), which estimated 1,815MW of committed generation between 2010
and 2015, 1,009MW from independent power producers (IPPs) and the remaining 806MW from the national utility, Kenya Electricity Generating Company (KenGen). Most of the committed capacity in the LCPDP would come from renewable energy, mostly geothermal (400MW) by KenGen and wind power (430MW). Coal would contribute with 600MW of new capacity and diesel with 340MW.
The Kenyan government puts a special emphasis on large-scale on-grid generation and transmission investments that enable industrial development. Industrial large power consumers already account for more than 60 per cent of KPLC’s revenue (Kenya Power 2013). Vision 2030 aims to transform Kenya into ‘a newly industrialising, middle-income country providing a high quality of life to all its citizens in a clean and secure environment’ (Republic of Kenya 2007). The economic pillar of Vision 2030 aims at an average growth rate of 10 per cent per annum until 2030 (ibid.), which is the main driver for the ambitious plan of increasing generation capacity by 5,000MW by 2017. Vision 2030 includes a number of flagship projects intended to increase economic activity across the country. The most energy-intensive projects are expected to significantly increase electricity demand and require additional generation capacity. These are detailed in Table 4.2. Other planned activities requiring significant power consumption include the operation of petroleum
pipelines for both crude and refined fuel oils, petrochemicals production and manufacturing of steel-based products, such as vehicle body parts (Republic of Kenya 2014).
Table 4.2 Estimated electricity requirements of Vision 2030 flagship
projects
Flagship projects County Completed Energy (GWh)
Capacity (MW)
Information Communications Technology (ICT) Park
Machakos 2015 2,930 440
2nd Container Terminal and
Mombasa Free Port
Mombasa 2014 746 2
Juma-Lamu railway Lamu, Garissa,
Isiolo, Marsabit
2014 19 9
Lamu port and resort cities Lamu 2014 200 30
Special Economic Zones Kisumu,
Mombasa, Lamu
2015 333 50
Iron and steel smelting industry in Meru area Meru 2015 2,097 315 Mombasa-Nairobi-Malaba-Kisumu railway Several Southern counties 2017 27 18
Light rail for Nairobi and suburbs Nairobi 2017 16 8
Resort cities (Isiolo, Kilifi and Ukunda)
Isiolo, Kilifi, Kwale
2017 200 30
Total 6,568 902
Source: Author’s own.
The performance of Kenya’s economy has been far from the targets set in Vision 2030, with growth rates below 5 per cent in the past two years and forecasts below 5 per cent for the coming two years (World Bank 2014). In any case, prospects are optimistic, with the International Monetary Fund (IMF) indicating that ‘Kenya’s medium-term growth prospects are favourable, supported by rising infrastructure investment in energy and transportation; the expansion of the East African Community market; deepening financial inclusion, which
fosters a more dynamic small- and medium-sized enterprise sector; and the positive impact of large-size irrigation projects on agricultural productivity’ (IMF 2014). Some potential constraints for Kenya’s economic growth are exogenous shocks related to the global economy, security or the weather; fiscal expansion, inflationary pressure, high electricity costs, and implementation of devolution (IMF 2014; World Bank 2014).
4.3 Poverty
Data from the latest household budget survey carried out in Kenya in 2005–06 showed the following poverty estimates (Kenya National Bureau of Statistics 2007):
Food poverty: 46 per cent of Kenyans were food poor, reporting food consumption levels insufficient to meet their basic daily energy requirements (2,250 kilocalories per adult equivalent per day). In rural areas incidence of food poverty is 47 per cent, while in urban areas it is 40 per cent.
Overall poverty: 46 per cent of Kenyans were poor, having levels of consumption insufficient to meet basic food and non-food needs. In rural areas overall poverty was 50 per cent in 2005–06, while in urban areas it was 34 per cent in the same period.
Extreme poverty affects 19 per cent of the population, with consumption levels inadequate to meet basic food needs alone, even if all non-food consumption was foregone to afford food. Extreme poverty reaches 22 per cent in rural areas and 8 per cent in urban areas.
These figures have gotten worse since this census was undertaken. The Kenya Institute for Public Policy Research and Analysis (KIPPRA) (2013) estimates that the number of poor people increased from 17.8 million in 2006 to 20.1 million in 2012. This involves an increase in the poverty rate from 46 per cent in 2006 to nearly 50 per cent. Rural poverty has
remained higher than urban poverty and is estimated at 55 per cent of the population in 2012 as compared to 35.5 per cent of urban poverty. The rise in the number of people falling into poverty since 2006 is as a result of the violence that resulted from the disputed 2007 elections, and low and inequitable economic growth.
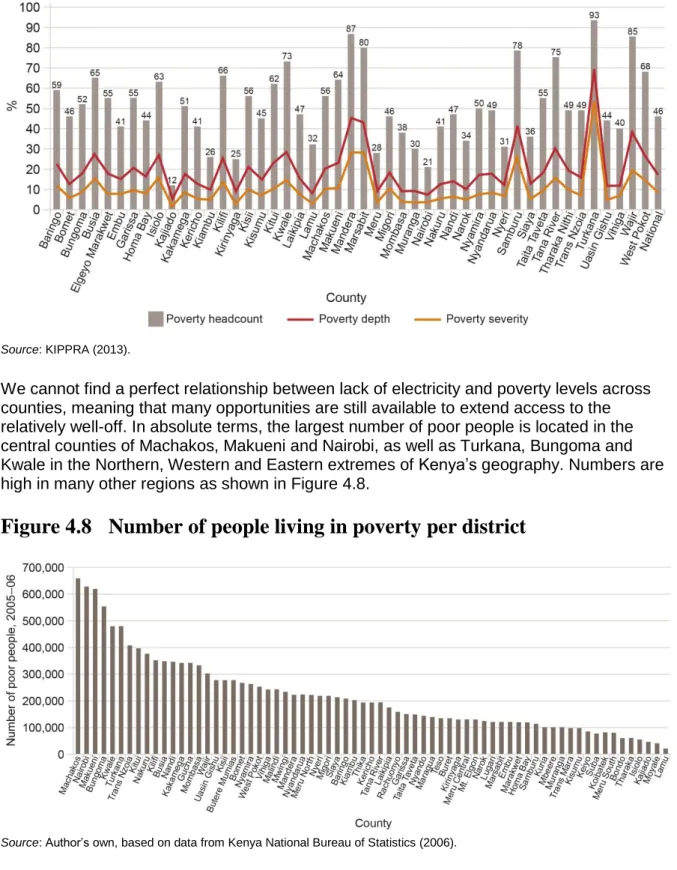
There is wide variation in the incidence of poverty across counties, as illustrated in Figure 4.7. It is highest in Kwale, Mandera, Marsabit, Samburu, Tana River, Turkana and Wajir, with poverty levels above 70 per cent. Except for Kwale, they are all large counties with harsh weather conditions, low population density and very low levels of electrification compared to the national average. On the other side, the counties with the lowest poverty rates, below 30 per cent, are Kajiado, Kirinyaga, Kiambu, Meru, Murang’a and Nairobi. Nairobi, Kajiado and Kiambu also have some of the highest electrification rates in the country, and the other three counties have electrification rates above average.
Figure 4.7 National poverty profile by county, 2005–06
Source: KIPPRA (2013).
We cannot find a perfect relationship between lack of electricity and poverty levels across counties, meaning that many opportunities are still available to extend access to the relatively well-off. In absolute terms, the largest number of poor people is located in the central counties of Machakos, Makueni and Nairobi, as well as Turkana, Bungoma and Kwale in the Northern, Western and Eastern extremes of Kenya’s geography. Numbers are high in many other regions as shown in Figure 4.8.
Figure 4.8 Number of people living in poverty per district
5 Financial sustainability
5.1 Least cost mix of centralised and decentralised power
The least cost mix of centralised and decentralised power depends on the cost of grid distribution, which is conditioned by population density, demand and the distance to the existing grid. More than half of the Kenyan population resides in 3 per cent of the country’s land area and lives at densities of over 250 inhabitants/km2 (Parshall et al. 2009; Innovation
Energie Développement 2013).Kenya also has a substantial medium voltage (MV) infrastructure that covers an area where 63 per cent of its population lives (Republic of Kenya 2014). However, penetration rates are very low. For example, Lee et al. (2014) observe electrification rates as low as 5.5 per cent and 22.3 per cent for households and businesses respectively within 600 metres of a distribution transformer in Western Kenya. Other sources quote 40 per cent connection rates in Kenya as a whole for rural households within reach of an existing transformer (African Development Bank 2014). Low connectivity for households ‘under grid’ is blamed on high connection charges (Lee et al. 2014), but several practitioners also point to the low quality of the existing grid as an important reason to decline a connection. Low demand reduces the viability of household connections even when they are very close to the grid.
Figures of population density and distance to the existing grid indicate a case for the bulk of electrification to take place through a grid intensification strategy, together with an
improvement in the quality of supply and financial support to reduce connection costs. The average cost per connection to the grid has been estimated at US$2,427 by Lee et al. (2014) based on actual cost data supplied by the Rural Electrification Authority and observed
electrification rates. Yet, the authors argue that if every structure within reach of the transformer was to be connected, this figure would drop to US$210. Parshall et al. (2009) estimate an average connection cost per household for grid electrification of US$1,907 under a realistic penetration scenario.2 The average connection cost for households within reach of
an MV transformer would be US$1,564 and for those that do not have an MV backbone the average cost would be US$2,615 (Parshall et al. 2009).3
Three analyses estimating the least cost mix of centralised and decentralised power in Kenya are reviewed. Their results are not conclusive, as they disagree on the importance of off-grid alternatives as compared to grid extension.
Firstly, Innovation Energie Développement (IED) (2013) uses a geographic information system (GIS) to estimate the optimal population shares served by mini-grids and stand-alone systems using different renewable and non-renewable resources and by grid extension. The analysis is based on three parameters: population density, distance to the grid and
renewable resources available. Households within communities with a population density higher than 250 people/km2 and outside a 5km perimeter from MV lines are considered ideal
for mini-grids. Households that are also outside the 5km perimeter but in areas more sparsely populated are better served by stand-alone systems. Those within a 5km distance from MV lines are considered better served by the national grid. According to these
parameters, 14.5 million, or 34 per cent of the population, would be better served by the grid; 10.2 million, 24 per cent of the population, are better served by mini-grids; and 18.9 million or 44 per cent of the population would need to rely on stand-alone systems. Solar energy would take the largest share of mini-grids, serving 63 per cent of their customers, followed by wind
2 This realistic scenario assumes a 65 per cent penetration rate in dense, non-poor areas, 30 per cent penetration in dense, poor areas, 26 per cent in sparse, non-poor and 22 per cent in sparse, poor areas.
3 Cost assumptions for national grid extension in Parshall et al. (2009) are based on meetings with KPLC in Nairobi in October/November 2007.
with 22 per cent, and hydro and biomass, both with 10 per cent. The share of grid as
compared to off-grid electricity provision is very low as compared to other studies and taking into account the high density and proximity to the grid of most of the Kenyan population. However, IED’s estimates are not precise as they could not get the updated national MV network GIS layer and they have probably underestimated the amount of people who live within 5km of the existing grid.
Secondly, Zeyringer et al. (2011) estimate and forecast the latent electricity demand and use it as an input parameter for a spatial-explicit supply-side least cost optimisation model
assessing three electrification alternatives: grid extension, diesel generator and PV stand-alone systems. The aim of their model is to minimise total energy system costs in order to find the least cost electricity solution for every grid cell, defined as equal areas of 1,971km2.
Total costs are composed of electricity grid distribution costs, electricity grid transportation costs, solar panel and diesel generator costs. Demand is estimated below 8kWh per month and household for urban and rural quintiles two to five. In quintile one, urban connected households consume 60kWh per month and rural households on average 24kWh. Their model shows that for most grid cells, the implementation of off-grid electricity represents the best solution due to low demand, low population density and large distances from the
existing grid. Grid electricity would only be an affordable option for districts with high demand per household, high population density and which are close to the existing grid. However, under a strong economic growth scenario, for a significant number of grid cells grid electricity becomes the most cost-efficient solution as construction costs of transmission lines decrease on a per kWh basis. Because the results are provided graphically, no information could be gathered on the amount of households that would be supplied under each of the alternatives, but it is expected that even though grid electricity takes up a small number of cells, these cells contain most of the Kenyan population.
Finally, Parshall et al. (2009) develop a spatial electricity planning model to estimate connection costs for different regions in Kenya taking into account electricity demand,
geographic characteristics, poverty, distance to an MV backbone and population distribution. They divide Kenya’s geography into 6,612 demand nodes, with a node defined as the
smallest political administrative unit in the country, and estimate the least cost alternative under two scenarios: full penetration and a realistic penetration, the latter involving a 65 per cent penetration rate in dense, non-poor demand nodes and a 30 per cent penetration rate elsewhere. Their results show that 93 per cent of all households are located within sub-locations where grid electrification is the most cost-effective option. This indicates that in the long term, if the relative costs of technologies remain the same, grid electrification is likely to be the most cost-effective technology for much of Kenya’s population. The total capital cost of connecting 3.1 million households under the realistic scenario would be approximately US$6bn. Under a full penetration scenario, the total cost of connecting 8.7 million
households would be US$13.4bn. The total cost for each scenario varies according to the total number of households covered. The marginal cost of connecting additional households rises as households in the hardest to reach demand nodes are covered. Their estimates show that the first 75 per cent of households in the full penetration scenarios could be reached for US$6.7bn, but reaching the full 8.7 million would raise the bill to US$13.4bn.
5.2 Commercial viability for project developers
Financial sustainability for project investors can be assessed by directly comparing costs and revenues and by looking at the project’s internal rate of return (IRR). Information on capital and operating costs, revenues and IRR was gathered for on-grid, large-scale renewable energy projects that have started the registration process under the Clean Development Mechanism (CDM), as this information is required as part of their project design documents (PDD). Most large-scale renewable electricity projects in Kenya have requested CDM registration, which makes our sample highly representative. Four wind power generation
projects (Turkana, Corner Baridi, Kipeto and Kinangop) totalling approximately 520MW and three geothermal generation projects (Olkaria I, II and IV) with 315MW capacity were analysed.
Most projects show debt/equity ratios of 70/30, which is in line with renewable energy projects globally. There are some exceptions, though, such as the Kinangop wind project which has an equal share of debt and equity, or Olkaria II, with 76 per cent debt. Loan interest rates are close to 10 per cent in most cases, although Olkaria I and IV geothermal projects enjoy much lower rates as provided by several bilateral and multilateral agencies, ranging between 0.02 per cent by the Japan International Cooperation Agency (JICA) and 4.85 per cent by the European Investment Bank (EIB).
The Lake Turkana Wind project presents the highest pre-tax IRR, at 19.6 per cent, selling power at 0.105US$/kWh, a lower rate than the 0.11US$/kWh agreed in the latest revision of the feed-in tariff (FiT) policy. Turkana wind project plan shows an exceptionally high load factor of 46 per cent, which makes it highly profitable. This is the same load factor shown by the Kipeto wind farm. Kinangop and Kipeto present 9.6 per cent and 14.4 per cent IRR before tax. Corner Baridi is estimated to have an 8 per cent IRR after tax. These three wind parks expect to sell at 0.12US$/kWh, even though this is higher than the tariff set in the latest revision of the FiT. The pre-tax IRRs for Olkaria I, II and IV geothermal projects are 10.48 per cent, 12.2 per cent and 10.66 per cent, with Olkaria I and IV selling power at 0.08US$/kWh and Olkaria II selling at 0.06US$/kWh. The standard FiT for geothermal power is 0.088 in the latest FiT revision, but all geothermal plants belong to KenGen and cannot benefit from the FiT.
The estimated IRRs do not take into account the additional revenue from certified emissions reductions (CERs), but the contribution of carbon credits is expected to be very low given the sharp decrease in the price of CERs, currently trading at less than €0.5/tCO2.
The equity IRR for wind and geothermal projects, except in the case of Turkana, is considered low taking into account a benchmark equity IRR of 20 per cent for energy projects quoted informally by investors and representatives of financial institutions in the region; or the default values of 13.25 per cent in real terms (close to 20 per cent adding inflation) recommended for Kenya as part of the guidelines provided by the United Nations Framework Convention for Climate Change (UNFCCC) to project developers for the
demonstration of additionality of their projects (UNFCCC 2011). It is also low as compared to minimum required rates of return for Kenyan government projects of 15 per cent, as specified by the Treasury Circular No 1/2007 dated 3 January 2007, referred to in the PDD of Olkaria geothermal projects.
It is worth noting that these estimated equity IRRs do not take into account significant investments made by the government or external donors to ensure feasibility or reduce risks for investors. For example, the Turkana wind power plant requires a 400kV transmission line of approximately 428km in length to evacuate power generated costing KSh16.5bn (around US$181m4) (KETRACO 2013). Olkaria geothermal plants have benefited from government
support for drilling activities costing US$328m. Our estimates show that if these costs had been covered by the project investors, the IRR of the project Olkaria I would have been reduced from 10.5 per cent to 7.9 per cent.
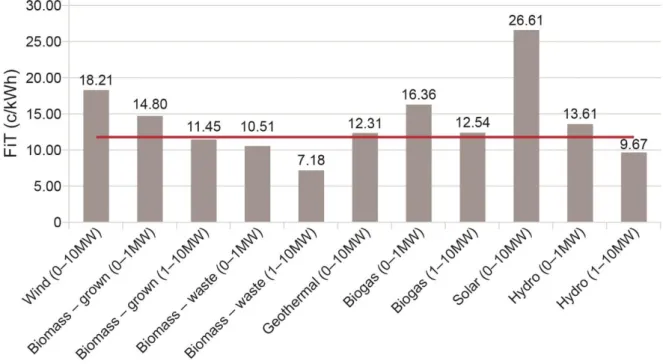
Some data on the financial sustainability of small-scale renewable energy projects in Kenya are provided in a study to inform the level of FiT for on-grid small-scale projects, defined as those below 10MW (ECA and Ramboll Management Consulting 2012). The study defines a level of FiT that allows investors to achieve 18 per cent IRR pre-tax, as this is understood to
be an acceptable return for equity investors. The study’s model includes a number of general and technology-specific assumptions to calculate standard FiTs that allow this rate of return. However, Kenya’s policy that the offered FiTs must not exceed the national long-run
marginal cost (LRMC) means that an effective cap of 0.12US$/kWh is set for wind,
geothermal, biogas and solar, hence below a level that would allow financial sustainability, as shown in Figure 5.1. In the case of solar, the FiT is less than half of what would be required. The LRMC is estimated as part of the LCPDP, which is the main electricity planning
document. The rationale for the cap is to ensure that electricity consumers are not penalised by the introduction of small-scale renewables onto the grid.
Figure 5.1 Standard small-scale FiTs
Source: ECA and Ramboll (2012).
A project developer of solar grids in Kenya, currently operating more than 20 micro-grids, quotes an average IRR of 20 per cent across his portfolio, which is the rate of return required by equity investors. However, this requires charging between US$2 and US$5/kWh to consumers, as there are no subsidies that allow lower fees.5
Investors in energy generation and in renewables specifically enjoy depreciation allowances and tax breaks which should allow for a post-tax RoE quite similar to the pre-tax return during the first ten years of the projects (ECA and Ramboll 2012).
5.3 Financial sustainability for the State
Achieving rates of return in line with investors’ requirements, hence keeping investment in much needed generation infrastructure, while providing affordable rates for the consumer, requires some type of public support from the GoK and external donors. Kenya offers a life-line tariff of KSh2.5/kWh to all domestic consumers for the first 50kWh of consumption and adds a number of surcharges for all consumers on top of the consumption tariff. Whereas this is highly regressive as it is only the better-off who can afford a connection, by having a uniform national tariff, with no geographic differentiation, Kenya is also effectively subsidising
rural consumers, who are more expensive to serve. Direct subsidies to electricity
consumption are nevertheless minimal and far below many other sub-Saharan countries. Tariffs are indeed set at a level that allows cost recovery and huge profit-taking from emergency power suppliers (Barnett 2014). While this has contributed to the financial sustainability of the national utility, it has also given place to some of the highest electricity prices in Africa, which has choked off demand and limited accessibility for the poor. In spite of the large role of off-grid small-scale generation for the provision of access to electricity for a large share of the population, public support of energy projects is mainly focused on attracting private investment in large-scale, grid-connected renewables and includes, for example, the following expenditures or lost revenues:
Transmission lines for remote renewable energy plants. A 430km, 400kV transmission line is required to evacuate electricity from the 300MW Lake Turkana Wind Farm. It is also expected to provide capacity to evacuate power from future power plants to be located along the Rift Valley geothermal fields and wind farms in Marsabit. The project has a total cost of KSh16.5bn, with KSh12bn funded by the Spanish government and the remaining KSh4.5bn paid by GoK (KETRACO 2013). Another project involves the construction of two 25km 220kV double circuit lines from the new 280MW Olkaria IV and I plants. The lines are financed by JICA, Agence Française de Développement (AFD), EIB and GoK (shares unknown) at a cost of KSh0.9bn. Finally, a 5km 132kV single circuit line that links 21.2MW Sangoro hydro power station to Sondu Miriu hydro power station was funded by JICA and GoK at a cost of KSh1.2bn.
Tax holidays for renewable energy projects. The GoK has shown willingness to offer private investors tax breaks including a seven-year income tax holiday for renewable energy projects and longer period breaks for geothermal and hydro plants of over 50MW of capacity. The incentives would be maintained until 70 per cent of the population is connected to electricity (USA–Kenya Chamber of Commerce 2010).
Drilling costs for geothermal projects. The GoK covers these costs to reduce the risk profile of geothermal projects for private investors. For example, Olkaria I and IV geothermal projects involved US$328m that was mostly covered by GoK (US$313m) with the remaining US$15m covered by the German government-owned bank, KfW. In addition to these, there is some support to reduce connection fees. Estimated connection costs within the range of KSh170,000 to KSh220,000 are significantly higher than the connection fees of KSh35,000 required by KPLC from each new customer. The additional cost is borne by KPLC and since 2013 also partially by a KSh2.7bn subsidy introduced by the Treasury to prevent a hike in connectivity fees that were already unaffordable for most of the population (Kenya Power 2013; Mutegi 2014). In addition to this, KPLC has started to avail credit to potential customers who require financing to pay for their connection to the grid, with the support of AFD. Under this arrangement, a KSh450m revolving fund pilot loan has provided credit to 44,000 customers. There are plans to avail an additional KSh3.3bn to fund 330,000 customers over a five-year period, starting in June 2014 (Kenya Power 2013).
6 Affordability
Affordability to the poor of different alternatives of electricity supply is defined as the possibility to purchase a subsistence level of consumption without spending more than a given share of the household budget. The subsistence level of consumption and the
affordability threshold need to be predefined but will always be partially subject to subjective values and calculations.
Two subsistence levels of monthly consumption are set to allow comparisons: 21kWh, according to the IEA’s definition of access, requiring this minimum amount of consumption among rural households; and 50kWh, a threshold commonly used in Africa as a consumption level benchmark, and that sets the upper limit for Kenya’s lifeline tariff.
The affordability threshold is set at 5 per cent of household expenditure, based on historic trends of household expenditure patterns and results of willingness to pay surveys in Africa (Banerjee et al. 2008; Briceño-Garmendia and Shkataran 2011). Kenyan statistics on monthly food and non-food consumption show an average expenditure on fuels of 5.16 per cent of total expenditure in Kenya, which would involve fuel consumption for energy services that can be provided by electricity, as well as those that cannot or are usually not provided by electricity, such as cooking and transport.
Poor people’s household budgets can be defined in terms of the overall national poverty line, estimated at KSh1,562 and KSh2,913 in monthly adult equivalent terms in 2006 for rural and urban areas respectively (Kenya National Bureau of Statistics 2007). Considering a mean household size of 5.1 people, this would represent poor household budgets of KSh5,467 in rural areas and KSh10,195 in urban areas. We have updated these figures to reflect current purchasing power by using price indices as provided by the Kenya National Bureau of Statistics, according to which the rural and urban overall poverty line in 2014 would be KSh13,426 and KSh25,042 monthly respectively, or around US$150 and US$275 per household.6
A 5 per cent threshold means that monthly subsistence electricity tariffs affordable for the poor in 2014 should not exceed KSh670 or US$7.5 for rural consumers or KSh1,250 (US$14) for urban consumers. These figures are consistent with estimated monthly expenditures on energy services that can be provided by electricity of US$7 to US$23 pre-electrification in Kenya (Tenenbaum et al. 2014).
We now estimate how much a subsistence level of monthly consumption would cost through grid electricity and micro-grids and compare it to that affordability threshold.
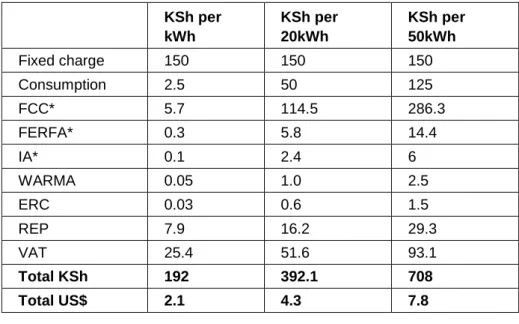
Starting with grid electricity, consumption of electricity up to 50kWh per month is charged at the so-called ‘lifeline tariff’, a subsidised rate of KSh2.5/kWh, in addition to a fixed charge of KSh150 and several surcharges: fuel cost charges (FCCs), foreign exchange rates
fluctuation adjustment (FERFA), inflation adjustment (IA), water levy for the use of hydro resources (WARMA) at 5 cents/kWh, Energy Regulatory Commission levy (ERC) at 3 cents/kWh, Rural Electrification Programme (REP) levy at 5 per cent of the base rate and VAT at 16 per cent on everything except the water, ERC and REP levies and inflation
adjustment (ERC 2013). The FCC, FERFA and IA change every month. For low consumption levels the surcharges cost more than the base rate itself and are applied to all tariffs.
Estimates of the grid electricity cost per kWh and for consumption levels of 20kWh and 50kWh are presented in Table 6.1.
Table 6.1 Electricity price per kWh and for subsistence consumption of
20kWh and 50kWh
KSh per kWh KSh per 20kWh KSh per 50kWh Fixed charge 150 150 150 Consumption 2.5 50 125 FCC* 5.7 114.5 286.3 FERFA* 0.3 5.8 14.4 IA* 0.1 2.4 6 WARMA 0.05 1.0 2.5 ERC 0.03 0.6 1.5 REP 7.9 16.2 29.3 VAT 25.4 51.6 93.1 Total KSh 192 392.1 708 Total US$ 2.1 4.3 7.8Note: * Estimated as average surcharge during the period November 2013–November 2014. The rest are as per November 2014.
Source: Author’s calculations based on Energy Regulatory Commission (2013) and https://stima.regulusweb.com/.
These figures show, therefore, that a subsistence level of grid electricity consumption is affordable for those with budgets at the level of the poverty line in Kenya, as it would not take more than 5 per cent of the household budget.
Information on the cost of electricity consumption from off-grid electricity could only be obtained for solar micro grids operated by a single company, and were validated by a practitioner in Kenya with knowledge of prices charged by other operators of micro grids.7
Fees charged per kWh are highly variable, depending on the type of consumer (residential or commercial), their location and the amount of electricity purchased. Our informant company charges higher fees to residential consumers because they consume very little during a specific time of the day and because the fuel that electricity is replacing (kerosene) is very expensive. Rates are within a range of KSh150 to KSh500 (US$1.65 to US$5.5) per kWh. A subsistence consumption of 50kWh would cost between KSh7,500 and KSh25,000 (US$82 and US$275). A subsistence consumption of 20kWh would cost between KSh3,000 and KSh10,000 (US$33 and US$110). These fees are clearly beyond the means of poor people, representing between 22 and 73 per cent of the budget at the rural poverty line for
20kWh/month consumption or between 55 and 183 per cent for 50kWh/month.
Another, arguably more important, element of affordability refers to upfront costs, which include connection fees, wiring, light bulbs and additional appliances such as a radio or mobile phone. Affordability can be assessed in terms of the share of the household budget of the poor that these costs represent. Household connection fees to the main grid are
KSh35,000 (US$385). This represents close to three times the monthly rural household budget and one and a half times the urban household budget at the poverty line. This is not affordable for the poor. Besides, some news reports anticipate that this fee may double as
7 Interview with Sam Duby, co-founder and technical director of Access:Energy, 18 November 2014, and discussions with George Michieka, Green Empowerment, 16 February 2015.
the Treasury plans to remove a large subsidy (see, for example, Mutegi 2014). Recent news shows a willingness to address this important barrier to grid connection through large
subsidies provided by KenGen with support from the World Bank. The subsidies target informal urban settlements in various parts of the country, including the counties of Kisii, Busia, Kisumu and Kakamega. This support is expected to benefit approximately 150,000 consumers by reducing their connection fee to KSh1,160 (Kenya Power 2015a).
Additionally, a finance facility exists to provide credit for grid connection charges (stima loan). The loan is provided by KPLC in partnership with the French Development Agency and allows customers to pay upfront only 20 per cent of the connection fee and spread the remaining 80 per cent over a period of 24 months at a 5 per cent administration fee (one-off payment) (Kenya Power 2015b). This would reduce the burden of the first payment to around half of the monthly budget at the rural poverty line, still representing a significant effort. Connection costs of solar micro-grids are instead very low and affordable for those at the poverty line, at KSh1,000, including wiring, light bulb and socket. This is a symbolic fee to ensure commitment from the user.
Both grid and off-grid include prepayment options. KPLC has installed 335,018 pre-paid meters at customer premises, as of June 2013, to enable customers to control their power bill. Mobile money transfer platforms such as Mpesa allow customers to pre-pay for their energy consumption and can access their balance at any time.