INSURANCE RISKS FROM VOLCANIC
ERUPTIONS IN EUROPE
Professor Robin Spence & Dr Rashmin Gunesekara Willis Research Network
51 Lime Street London EC3M 7DQ +44 (0) 20 3124 7482
and
Professor Giulio Zuccaro The Plinus Centre University of Naples Federico II
+39 081 2538925
KEYWORDS: volcano, seismic, risk management, insurance, modelling
Executive Summary
This paper highlights the need for a better understanding of volcanic hazards within the insurance industry and sets out some preliminary steps towards insurance risk assessment for volcanic hazards, in relation to volcanic risks in Europe.
The potential impacts of volcanic eruptions on insurance is explored (Section1). Potential impacts on property insurance could be the most serious, but given the importance of many of the European volcanoes as tourist destinations, business interruption policies could also be seriously affected. Impacts on motor and aviation, agricultural and health insurance are also likely. Although insurance cover of property in some of Europe’s volcanic risk zones is low, it is likely to grow in the future, notably in Italy.
A risk ranking for European volcanoes has been proposed, identifying in a uniform way, and based on recent scientific data and population databases, the populations which may be at risk from the expected eruptions of Europe’s most dangerous volcanoes (Section 2). This study identifies the 10 European volcanoes with potentially affected populations greater than 10,000, and with an aggregated exposed property value at risk of US$85 billion. Over 87% of this property value in concentrated in the Neapolitan region, around Vesuvius and Campi Flegrei. The analysis is taken a step further, in relation to one case study volcano, Vesuvius, which is the most intensively studied volcano in Europe (Section 3). Using results from a recently-completed project funded by the EU (the EXPLORIS Project 2002-2006), an impact scenario is presented for hypothetical eruption scenario at a scale consistent with historical events and corresponding to a possible next eruption of Vesuvius.
The scenario is based on detailed inventories of the population and settlements exposed, derived from recent survey work, and the most extensive volcanological understanding of the characteristics of a future eruption. It identifies potential building losses of US$17 billion, 8,000 deaths and 13,000 serious injuries from this eruption scenario.
Although there has been extensive academic study of the main European volcanoes, at present there are no insurance risk models for volcanoes in Europe. In conclusion (Section 4), it is argued that such risk modelling is now possible with the modelling tools available, and urgently needed to identify the scale of the potential future impacts.
1. Insurance risks from volcanic eruptions
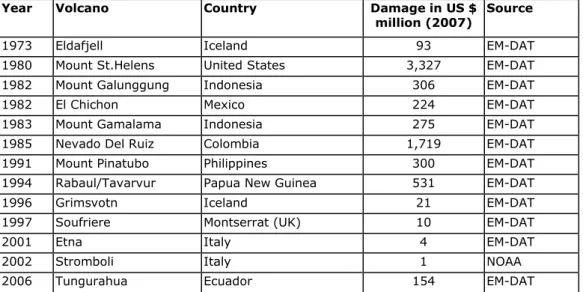
Large explosive volcanic eruptions are rare events, but when they do occur they have the potential to cause devastation to property and activities over a wide area, and thus to cause huge economic and human losses. There are also no other natural catastrophes (with the exception of meteorite impact and tsunamis) that devastate such wide areas with such intensity. In principle, volcanic eruption is an insurable risk. Apart from a few exceptions, however, the rarity of loss occurrences means that the technically necessary rate is marginal. There are around 1500 active volcanoes in the world (Simkin and Siebert, 1994), although most are remote and pose little to no threat to human populations. However, at least 170 volcanic eruptions in the last century have caused human casualties, and the increase in global population continues to put more people, property and economic activities at risk. Table 1 lists some of the more notable eruptions of the last 50 years worldwide and their economic consequences.
Table 1: Notable economic losses from volcanic eruptions in the last 50 years with damage costs in US$ 2007 values. Sources: EM-DAT (University of Louvain, 2007), (NOAA, 2007). Price inflators from World Bank.
Year Volcano Country Damage in US $
million (2007) Source 1973 Eldafjell Iceland 93 EM-DAT 1980 Mount St.Helens United States 3,327 EM-DAT 1982 Mount Galunggung Indonesia 306 EM-DAT 1982 El Chichon Mexico 224 EM-DAT 1983 Mount Gamalama Indonesia 275 EM-DAT 1985 Nevado Del Ruiz Colombia 1,719 EM-DAT 1991 Mount Pinatubo Philippines 300 EM-DAT 1994 Rabaul/Tavarvur Papua New Guinea 531 EM-DAT 1996 Grimsvotn Iceland 21 EM-DAT 1997 Soufriere Montserrat (UK) 10 EM-DAT
2001 Etna Italy 4 EM-DAT
2002 Stromboli Italy 1 NOAA
2006 Tungurahua Ecuador 154 EM-DAT
Estimating the economic costs associated with volcanic eruptions is very difficult, because of their duration and variety of impacts (Annen and Wagner, 2003). However, insured costs are better known, and insured costs from some recent eruptions have been considerable. Etna, the biggest volcano in Europe, caused enormous damage when it erupted in 2001 and again in 2002/03. In 2002, rain combined with ash fall alone caused economic losses of around US $960m (Munich Re, 2007). The 1994 Rabaul eruption cost the government of Papua New Guinea an estimated US $91m while the private sector incurred losses of US $180m (Blong and McKee, 1995).
The need to better understand volcanic hazards within the insurance industry has been highlighted by examples of insurance cover for volcanic eruptions being withdrawn in the aftermath of volcano crises and subsequent heavy losses to the industry. These examples include the eruptions of Montserrat (UK), Pinatubo (Philippines) and Mt. St. Helens (USA). As durations of volcanic eruptions are much larger than those of other natural perils, application of the standard 72 hour clause defining a natural catastrophe appears to be inadequate. There have been suggestions from the scientific community for an alternative hours clause of 672 hours for volcanic crises (Benfield Hazard Research Centre).
Defining the distinction between direct and indirect impacts is also important when considering insurance cover for volcanic hazards. In the United States coverage is included for direct loss to insured property by airborne volcanic blast or airborne shock waves, ash, dust particulate matter or lava flow. However, policies specify that there is no coverage for the removal of ash, dust or particulate matter that does not cause direct physical loss to covered property (Marti and Ernst, 2005).
Illustrating the need for better understanding of volcanic hazards this study is focussed on the risk from volcanic eruptions in Europe, where the infrastructure is highly developed, where property values are considerable, and where insurance cover is already widely available. There are significant numbers of highly active volcanoes in the wider European region taking into account those in Iceland, the Spanish Canary Islands, the Portuguese Azores and the French islands of the Lesser Antilles. Italy and Greece also have active volcanoes, among them Vesuvius, Etna and Santorini, all volcanoes posing threats to human life and property.
Types and magnitude of eruptions
Volcanoes can be classified in different ways, according to the style and size of their eruptions. There is wide range in eruption styles which can generally be categorised as effusive (fire fountaining and effusion of fluid flows) or explosive. The effusive style of eruption common in most shield volcanoes is significantly less hazardous, but these are more frequent than explosive eruptions. Volcanic eruptions are also commonly described by comparing the styles of eruption to those of well known volcanoes. Large, violent and dangerous explosions are called plinian or sub-plinian eruptions. Intermediate styles of eruption are referred to as pelean, vulcanian, strombolian and surtseyan (For further information refer to http://pubs.usgs.gov/gip/volc/eruptions.html).
How do we rate the relative magnitude of eruptions?
For explosive eruptions, volcanologists use the Volcanic Explosivity Index (VEI), as a crude measure of eruption size, determined by estimating the total volume of ejected tephra, and the eruption column height (Simkin and Siebert, 1994). Each unit on the VEI scale relates to an order of magnitude increase in the tephra volume ejected, from VEI1 which means less than 106 m3 of tephra up to VEI8, involving 1012 m3 (or 103 km3). Eruptions of magnitude greater than VEI3 (over 107 m3 of tephra), are very likely to be damaging, causing deposition up to 5 km or more from the source of as much as 25 cm of ash, sufficient to cause the collapse of some roofs. But such events are relatively rare; globally around 5-10 eruptions of such a size occur annually, but only a small number occur in Europe, where about 150 such events have occurred in the last 2 millennia (Table 2). It is from these infrequent larger (VEI≥3) eruptions that the greatest risk occurs, though smaller eruptions can also be damaging locally. Although VEI scale is commonly used, it is limited by its dependence on volcano eruptive mass (or volume) which can be quite difficult to estimate. Recently, other volcano magnitude scales have been proposed to overcome this limitation.
Volcanic hazards
There are numerous distinct but interconnected hazards associated with volcanic eruptions, each of which is threatening to different aspects of human activities (Blong, 1984). These are described in the Box 1. For any one volcano, not all of these hazards may be significant, and individual eruptions also differ in the extent and importance of the different hazards. The next eruption at any volcano may be quite unlike those of the past. Indeed, 12 of the 16 biggest eruptions of the past 200 years have occurred at volcanoes which have not erupted in recorded history (McGuire, 2003). Thus in assessing the risks from any particular volcano, a well-informed scientific opinion is needed to assess the potential risks, and a precautionary approach should be adopted in risk assessment, including all potential hazards whether they have occurred in the recorded history of the volcano or not.
Potential insurance impacts
Given the range of hazards associated with volcanoes and their extent, it is clear that many different lines of insurance may be involved. A key impact will be on property insurance, for residential, commercial and industrial insurance lines. In a large eruption, both buildings and contents may suffer losses over a wide area; and physical losses are likely also to extend to roads, power and telecommunications infrastructure, and facilities. Because of their fertile soils, the slopes of many volcanoes are highly productive agricultural areas, and crops and livestock as well as agricultural buildings and infrastructure will be at risk. And increasingly, the volcanic areas of Europe are popular tourist destinations (the volcano itself, and the environment it creates, being the central attraction), and much tourist infrastructure is located in areas of potential impact. Santorini in Greece, the Bay of Naples, Eastern Sicily, the Canary Islands, the Azores and the Caribbean islands are all successful tourist destinations, and much of the infrastructure (including airports) has been put in place with little regard to the volcanic hazards. Thus it is likely that business interruption as well as property insurance lines could be seriously affected. As mentioned earlier, unlike other natural catastrophes, volcanic crises could last from a few weeks to several years, leading to potentially extensive business interruption losses.
The damaging effects of even small amounts of volcanic ash on machinery mean that Motor and Aviation insurance lines will be affected by tephra from explosive eruptions Blong, 1984; Tiedemann, 1992). There are several well-documented cases of aircraft in flight losing power through flying into ash clouds (Tiedemann, 1992), with potentially appalling consequences. Even relatively minor eruptions of Etna, with minor tephra-fall at the ground have led to the closure of local airports and the grounding of aircraft (DPC Italy, 2007). During the June 1991 Mt Pinatubo eruption, a number of jets flying far to the west of the Philippines encountered ash that was dispersed by intense storm winds, causing damage that was estimated at the time in excess of US $100 million (Casadevall et a.l, 1995) Health and life insurance lines may also be affected. Near well-monitored volcanoes, loss of life from a major eruption may be relatively small as a result of the precautionary approach to evacuation normally adopted by civil protection authorities. But inhabitants of a volcanic area are likely to return soon after an eruption, at a time when there may still be a significant carpet of ash, and there are increasingly well-understood long-term health effects from inhaling such ash (Hincks, 2006; Bonadonna et al., 2002); and toxic gas emissions may occur at any time.
An even greater risk is the threat from an eruption large enough to affect the entire global weather system. This has happened quite regularly in the past, for example following the 1815 Tambora eruption (Self, 2005).
To what extent the loss of revenue (in tourism, agriculture and food production) caused by (and clearly attributable to) the resulting lowering of global temperatures would be a loss to insurance is not known.
The extent of insurance coverage of these risks may today be relatively low, even in European volcanic areas, but it is likely to be growing and to become more substantial in the years ahead. In Italy today there is little residential insurance cover, partly because the Italian government has, in the event of major disasters in the past, always set up a fund to provide compensation for those whose property has been lost or damaged. But, partly because of the huge tax burden involved, this is set to change in the near future; there is now in existence a government-backed insurance pool aimed at increasing residential insurance against natural disasters, which is likely to lead to the availability of commercial cover, and a diminution of post-disaster recovery grants (DiPasquale, 2007). France has a government-backed catastrophe insurance pool offering insurance for a relatively low premium, resulting in very extensive residential and other property insurance. Iceland has virtually universal insurance covering most natural perils (AXCO, 2007).
The scale of the losses which could be caused and the lack of recent insurance loss experience (and thus lack of damage data for analysis) make the modelling of potential impacts based on scientific knowledge of possible scenarios a necessity. Over the last two decades there has been a substantial increase in the understanding of the basic processes and the associated risks from volcanic eruptions worldwide, and European volcanology has been in the forefront of these developments. Yet to date there appears to be very few insurance-directed catastrophe model for volcanic areas (E.g. Auckland, New Zealand, McGill and Blong, 2005). This is an omission that needs to be corrected with some urgency. Aims of this paper
This paper sets out to take some first steps towards insurance risk assessment for volcanic hazards, in relation to volcanic risks in Europe. In the next section we propose a risk ranking for European volcanoes, identifying in a uniform way, and based on recent scientific data and population databases, the populations which may be at risk from the expected eruptions of Europe’s most dangerous volcanoes. This ranking is based on the total population at risk rather than insured values, because the data for the latter is not widely available; but indicative values for the financial exposure are also calculated. The following section shows how to take the analysis a step further, in relation to one case study volcano, Vesuvius, which is the best-studied in Europe. Using results from a recently-completed project funded by the EU (the EXPLORIS Project 2002-2006), impact scenarios are presented for hypothetical eruption scenarios at a scale consistent with historical events and corresponding to a possible next eruption of Vesuvius. The scenario is based on detailed inventories of the populations and settlements exposed derived from recent survey work, and the best volcanological understanding of the characteristics of a future eruption. It identifies building losses and human casualties from the major volcanic hazards likely to affect the area. In the final section some conclusions are drawn about the insurability of volcanic risks, and proposals made for further work which will enable tools of direct value to insurance risk assessment to be built.
2. A preliminary risk ranking of European volcanoes
In this section we present a new risk ranking of European volcanoes, designed to compare the risks to human populations on a consistent basis, in order to identify those volcanoes on which further and more detailed studies are likely to be worthwhile. The risk ranking uses newly available population data combined with statistical data on the impacts of volcanic eruptions to identify the number of people who may be at risk from different volcanic hazards.
It does not consider the relative vulnerability of the building stock, which would need to be the subject of more detailed investigations volcano by volcano, like those described in Section 3.
The risk ranking was conducted in three steps. First, a list was compiled of all European volcanoes which have had eruptions estimated to have been of magnitude VEI2 or above in the last 2 millennia. Secondly, statistical data from global eruptions was used to identify the areas of probable influence of tephra fall at different levels, and also of Pyroclastic Density Currrents (PDC) – commonly known as pyroclastic flow run out, for each volcano. Finally, a global population dataset was used to produce an estimate of the population exposed to each level of hazard, leading to a table of risk ranking in terms of population affected. The population exposed was also used to estimate the residential property value exposed. Each of these steps will be described in more detail.
Table 2: Volcanoes with eruptions of VEI2 or greater since AD79 affecting European populations (lf=lava flow, pf= pyroclastic flow). Data from Smithsonian Institute (www.volcano.si.edu).
Number of eruptions with
Region Country Volcano VEI2 VEI3 VEI4 VEI5 VEI6 Start
date of largest
Type of
volcano Style of largest eruption Zone 1
Europe Italy Vesuvius 7 29 4 1 79 Strato
Campi Flegrei 1 1538 Caldera Explosive, pf Stromboli >50 5 1930 Strato Explosive, lf Vulcano 2 12 1888 Strato Explosive, pf Etna many 18 1 1787 Shield Explosive, lf Greece Santorini 4 4 1 1650 Shield Explosive,
submarine, lf
Nisyros 4 Strato
Zone 17 Iceland Hekla 4 7 8 1 1104 Strato Explosive
Katla 4 11 1756
Sub-glacial Explosive 33 other volcanoes 5 5 1 1704
Zone 18
Atlantic Canary Islands La Palma 7
Tenerife 4 1 1798 Strato Explosive, lf Lanzarote 1 1 1730 Fissure
vents Explosive, submarine, lf Azores Fayal 2
Pico 2
San Jorge 1 1 1580 Fissure vent
Terceira 1 1 1867 Strato Explosive, submarine Sete Cidades 6 2 4 1444 Strato Explosive
Don Joao 6 2 3 Submarine
Agua de Pau 1 1 1563 Explosive, lf
Furnas 3 1630 Explosive, pf
Zone 16 West Indies
Montserrat Soufriere
Hills 1995 Strato Explosive, pf
Guadeloupe Soufriere
Guadeloupe 5 3 P 1530 Strato Explosive, pf Martinique Mt Pelee 2 1 2 1902 Strato Explosive, pf St Vincent Soufriere
Data on the European volcanoes was obtained in a consistent way from the summary volume “Volcanoes of the World” produced by the Smithsonian Institute (Simkin and Siebert, 1994), with updates from the Institute’s website as needed. The volcanoes considered include all those on European territories, including the Spanish Canary Islands, the Portuguese Azores, and the French Antilles Islands of Guadeloupe and Martinique, and also include those in Iceland. Two volcanoes in the Lesser Antilles which are not on European territory were also included, because of their proximity to European territory. The volcanoes listed have all had eruptions which have been assessed as being at or greater than VEI2 since AD79. This date was chosen because it is generally agreed to represent the birth of historical observations of volcanic eruptions in Europe. This long list contains the 24 volcanoes shown in Table 2. These have between them been responsible for about 150 eruptions of VEI3 or greater, and 47 eruptions of VEI4 and greater since AD 79, plus 2 of VEI5 (both in Iceland). The largest, and only, VEI6 eruption to have occurred in Europe in historical times, was that of 79 AD at Vesuvius.
A smaller group of just 13 volcanoes was then identified for further analysis, namely those volcanoes with eruptions of VEI3 and above since AD 79. Those whose eruptions are primarily submarine were also excluded. These 13 volcanoes are shown in Table 4, which also shows the largest eruption in terms of VEI which has occurred since AD 79. The largest eruption since AD79 was then taken as an indication of the possible scale of a future eruption, and calculated extents of impact are based on this important assumption.
A VEI 6 plinian eruption of the scale which caused the destruction of ancient Pompei and Herculaneum in 79 AD is currently unlikely and has not been considered further. However, it also needs to be acknowledged that the size of the largest eruption in the historical past is not necessarily the best indication of potential risk. As stated earlier, most of the largest eruptions of the last 200 years globally have occurred at volcanoes which had no large eruption in recorded history; larger eruptions than those recorded may also occur. However, recent scientific understanding of volcanoes has greatly improved and this paper has the logic of identifying known risks; and, with this assumption, we have a consistent basis for considering impacts.
The area of impact of each eruption was then estimated using the statistical analysis developed by Newhall and Hoblitt (2002). In that paper, an assembly of data on tephra fall depth from 125 separate eruptions of VEI3 or greater was analysed, and tables were presented giving the tephra depth at different distances from the vent and with different exceedence probabilities, with subdivision by the VEI of the eruption. A similar compilation of data on pyroclastic flow runouts from 113 eruptions of VEI3 or greater was also used to provide a table of runout distances at different probabilities, again with subdivision by VEI. In the published paper the tephra data for all VEI4 and greater eruptions are grouped together; but for this present study the authors (Newhall, 2007) have provided an additional dataset for the 32 VEI4 eruptions only.
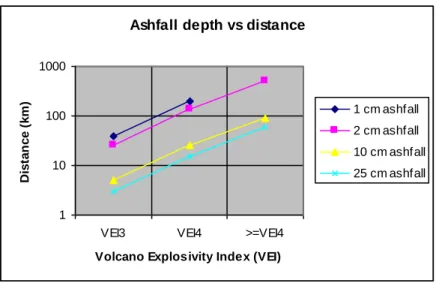
These tables have been used to estimate the likely radius of impact of three levels of volcanic hazard, namely tephra fall depth of 2cm and 25 cm, and pyroclastic flow runout, each at 50% probability, related to three scales of eruption (VEI3, VEI4 and ≥VEI4) as shown in Table 3. The ashfall depth versus VEI data are also illustrated by Figure 1.
Table 3: Volcanic hazards and their radius of impact.
Hazard Exceedence
probability VEI3 VEI4 ≥VEI4
2 cm ashfall depth 50% 25 km 150 km 400 km 25 cm ashfall depth 50% 5 km 15 km 60 km Pyroclastic flow runout 50% 6 km 11 km 11 km
Figure 1: Estimated ashfall depth at 50% probability from different magnitude eruptions based on data from Newhall and Hoblitt (2002).
These levels of the hazard have been chosen for the following reasons. A depth of 2 cm of ash is the level at which ashfall can be disruptive to sensitive facilities, such as airports, can close roads, and can be disruptive to agriculture. Ashfall of this depth is also likely to result in significant health effects (Bonadonna et al., 2002). A depth of 25 cm of ash is sufficient to cause the collapse of some roofs (Spence et al., 2005a), and will thus result in significant property damage. Pyroclastic flows, at any point within their potential runout, are likely to be seriously damaging to all buildings and infrastructure, and lethal to people whether inside buildings or in the open. However, these three measures are indicative levels of hazard, not definite thresholds.
A study of the (VEI4) 1906 eruption of Vesuvius (Mastrolorenzo et al., 1993) shows that tephra fallout reached a depth of 25cm at 12km and 5cm at a distance of 24 km from the vent; in the Azores, the study by Cole et al (1999) of the (VEI4) 1630 eruption of Furnas showed a tephra depth of 25cm at 10km, with a similar depth at 10km downwind being inferred from studies of the VEI4 Caldeira Seca (600BP) eruption of Sete Cidades (Cole et al., 2008). For the VEI3 vulcanian explosion at Soufriere Hills Montserrat on 26.9.97, tephra depth reached 15 cm at about 6km from the vent (Bonnadonna et al, 2002a). For small island volcanos, the extent of the radius of 2cm of ash or lower is difficult to determine.
Pyroclastic flow (or density current) runouts are difficult to assess from studies of the residual deposits since these may easily be eroded, and they depend on the height from which the flow originates; however firm evidence suggests that in the VEI4 1631 AD Vesuvius eruption, pyroclastic flows reached at least 7.5km on the southern flank (Rosi et al., 1993). Likewise at La Soufriere of Guadeloupe scoria pyroclastic density currents in the VEI4 1530 eruption reached at least 4 km from the summit (Boudon et al., 2008), while in the 1996-97 eruption at Montserrat, flow deposits reached the sea both to north and south of the vent at distances of about 6-7km (Cole et al., 1998). These runout distances are comparable with the figures in Table 3.
A further refinement of the hazard zone has been carried out for each volcano by taking account of the prevailing wind direction. Tephra is carried and deposited downwind, thus those living downwind of the volcano have a much greater risk of a given ash depth than those upwind. Wind directions of course vary, and the wind direction in the lower atmosphere may not be the same as at higher levels. For each volcano, wind data has been analysed to determine the average prevailing wind direction, and the population within a +/-30º degree sector centred on this direction has been calculated.
Ashfall depth vs distance
1 10 100 1000
VEI3 VEI4 >=VEI4
Volcano Explosivity Index (VEI)
D is ta n c e ( k m ) 1 cm ashfall 2 cm ashfall 10 cm ashfall 25 cm ashfall
Intersections at these radii and sectors have been done for each volcano using the 2005 Landscan Data on global population (Table 4). Details are given in the adjacent text box and Figures 2 to 5 show the population within the sectors of highest risk.
The results, giving expected populations at risk for each of the three hazards considered: 2 cm ashfall, 25 cm ashfall and pyroclastic flow runout – and the ranking in terms of population threatened, (see detail in Technical Box) are shown in Table 4. Vesuvius, with a risk ranking of 6.2 is by some margin the most dangerous volcano in the European region, and the only one creating life-threatening hazards to more than one million people. But two other volcanoes have a risk ranking exceeding 5 (more than 100,000 people exposed to life-threatening hazards); these are Campi Flegrei, also close to Naples, and Soufrière of Guadeloupe. A further 8 volcanoes have risk indices greater than 4, i.e. threatening to more than 10,000 people, one each in Italy and Iceland, three in the Caribbean and three in the Azores; and the remaining 5 volcanoes on the list have much smaller risk indices. The maps (Figures 2 to 5) show the locations, population densities and potentially affected areas in the region of the most dangerous volcanoes, both over the whole 360º without making allowance for wind direction, and also in the 60º with the highest wind risk.
Figure 3: Estimated area and population at risk from an eruption of Tiede, Tenerife, Canary Islands at VEI3.
Figure 4: Estimated area and population at risk from eruptions of Hekla, Iceland at VEI5 and Katla at VEI4.
Figure 5: Estimated area and population at risk from eruptions of volcanoes Sete Cidades, Agua de Pau and Furnas on S Miguel Island, Azores at VE14.
Table 4: Population at risk from tephra fall and pyroclastic flow hazards from European volcanoes.
A further column has been added to Table 4 to give an indicative value to the total residential property exposed to severe damage or destruction, taking into account the total number of dwellings within reach of the pyroclastic flow or 25 cm ashfall contours, at their full current reconstruction cost. Considering all the volcanoes, this residential property value exposed reaches US $85 billion, of which over 85% is accounted for by the two volcanoes (Vesuvius and Campi Flegrei), threatening the Neapolitan region.
VEI 2cm ash a ff e ct e d p op ( 3 6 0 deg) 25 c m a sh a ff e ct e d p op (3 6 0 d e g ) P DC a ff e ct e d p op ( 3 6 0 deg) log (a ff e ct e d p op u la tio n ) V a lue o f re sid e n ce a t ri sk (US $ b n ) Vesuvius 4 7,916,000 1,651,950 861,364 6.2 66.1 Campi Flegrei 3 2,482,970 144,144 196,229 5.3 7.8 Soufriere Guadeloupe 4 554,604 94,037 79,955 5.0 3.8 Etna 4 4,916,930 70,819 4,466 4.9 2.8 Agua de Pau 4 123,509 34,307 21,744 4.5 1.4 Soufriere St Vincent 4 722,291 24,493 16,146 4.4 1.0 Furnas 4 123,509 19,862 12,062 4.3 0.8 Sete Cidades 4 142,059 17,889 9,704 4.3 0.7 Hekla 5 239,105 10,024 13 4.0 0.4 Mt Pelee 4 775,570 10,002 5,987 4.0 0.4 Soufriere Hills 4 532782 9341 9327 4.0 0.4 Vulcano 3 16,675 357 433 2.6 0.02 Stromboli 3 468 202 202 2.3 0.01 Tenerife 3 264,469 73 146 2.2 0.01 Katla 4 146,155 1 0 0.0 0.000
Limitations of this approach
Any interpretation of Table 4 needs to take its limitations into account. It is based on a rather coarse set of population maps, and the zones of influence of the hazards have been considered without probabilistic analysis. This approach also does not take into account the vulnerability of the building stock; thus the actual risks to life or property loss of the population which may be affected by the hazards may be greater or lower depending on the quality of construction and the extent to which it is either designed to or has the ability to resist damage from volcanic hazards. And most importantly, there is no element of eruption frequency in the estimate. The ranking is based purely on the largest event which occurred in the last 2 millenia. Thus, important considerations for each individual volcano, such as its current or recent states of unrest, and the frequency of its eruption history, are omitted. And there is a possibility that other volcanoes, not listed, could in the future have eruptions of a comparable magnitude. Thus, the study omits several essential components needed for the calculation of insurance risks. These will need to be developed by more detailed studies of the individual volcanoes, which will look both at recent history to assess the current state of unrest and at the vulnerability of the building stock.
However, in spite of its limitations, it is thought that the risk index proposed clearly identifies the scale of the risk, and the risk ranking, based on historical experience, and therefore shows which volcanoes demand more detailed study of risks needed for insurance purposes. In the next section we give details of a recent study of the highest risk European volcano, Vesuvius, as an indication of the kind of study needed.
3. Case study: eruption impacts for European volcanoes, the example of Vesuvius
3.1 Introduction
As shown in Section 2, a number of European settlements are at risk from the impact of explosive volcanic eruptions, which could pose insurance risks now or in future. Insurers need to know about the scale of eruption which could occur and the associated hazards; they need also to know what impact each possible style of eruption may have on the territory and human settlements which it will affect, both in terms of possible damage to buildings and other built facilities, and also to human casualties.
Increasingly eruption models are able to provide, for an assumed eruption scenario, a detailed map of the possible geographical distribution of the eruption products, with point by point estimates of the key parameters – depth and composition of tephra fall, dynamic pressure, velocity and particle concentration in pyroclastic flows, as well as time sequences of these variables. Where these parameters are known, it becomes possible to develop estimates of the impact of the eruption on buildings and infrastructure, and also on their occupants.
New work under the 2002-2006 EU-funded EXPLORIS project has developed a new 3D model of an explosive eruption for Vesuvius (Esposito-Onagaro, et al., 2008), as well as a new, more detailed tephra dispersion and fallout model for the same volcano (Macedonio et al., 2006). The project has also extended the eruption modelling to three other European volcanoes, Tiede in the Spanish island of Tenerife, La Soufrière of the French island of Guadeloupe, and Sete Cidades in San Miguel Island in the Portuguese Azores (Toyos et al., 2007). Current research into volcanic hazard has been complemented by the development of a new computer model for the estimation of the impacts on the potentially affected territories for Vesuvius and for Soufrière of Guadeloupe. The model is described in Box 3 (Spence et al., 2005).
3.2 Impact model application: Vesuvius
Vesuvius: the context
As shown in Table 4, within Europe, Vesuvius is by some margin the volcano with the greatest potential impact on the population. Vesuvius is best known for the huge (VEI6) 79 AD eruption which buried Pompeii and Herculaneum, and was recorded by the Pliny the Younger, thus beginning the age of observational volcanology. There were even larger eruptions in pre-historical times, and since AD 79, Vesuvius has had a series of explosive and destructive eruptions, including 29 of magnitude VEI3 and 4 of magnitude VEI4. In 1631 AD, a VEI4 sub-Plinian eruption occurred which involved major pyroclastic flows and caused over 4,000 deaths. There has been an average recurrence of eruptions exceeding VEI3 of about 20 years over the last 3 centuries: the last two of these were in 1906 and 1944. Each of those eruptions resulted in a major tephra fall, spreading over the settlements (at that time villages) to the northeast of Vesuvius and causing the collapse of many roofs, dozens of casualties and substantial disruption to economic life.
Vesuvius is located just 10 km from the centre of Naples which, with 1.2 million inhabitants, is Italy’s third largest city. Since 1944, the population living within range of such a destructive tephra fall has grown from a few tens of thousands to over a million people, and although building standards have improved to some extent, there is still cause for concern about the safety of the roofs of many dwellings; worse, the increasing dependence of economic and commercial as well as domestic life on sophisticated transport, energy and communications technology means that disruption is likely to be far more costly and prolonged than was the case in 1944.
But the longer than usual quiescence of Vesuvius raises an even greater threat – the possibility of a sub-plinian eruption with extensive pyroclastic flows such as were devastating to several communities when they last occurred in 1631 AD. However, it is not considered that a plinian eruption of the scale which caused the destruction of ancient Pompei and Herculaneum in 79 AD is currently likely. It is of vital importance for insurers as well as for the civil protection authorities to understand the potential impact of a new eruption, assuming different scales of eruption magnitude and different possible sequences of hazardous events: of particular importance in the case of Vesuvius are tephra fall and pyroclastic flow. But the impact of each of these hazards may be increased by the simultaneous or previous occurrence of earthquakes.
In the EXPLORIS Project, a deterministic impact modelling tool was developed by the University of Naples PLINIVS Laboratory (Zuccaro et al., 2008). The model aims to estimate the impact of a future eruption extending over several days or weeks in which a precise sequence of events occurs at given times (earthquakes EQ, tephra fall, TF, pyroclastic flow, PF) and during which an evacuation of the population is taking place. The estimated impacts of one possible (but of course hypothetical) sub-plinian eruption sequence will be shown in this section. Historical evidence has been used to estimate a realistic time-sequence of events for such an eruption, and recent modelling work by INGV Pisa (Neri et al., 2008) and the Vesuvius Observatory (Macedonio et al., 2008) (also conducted within the EXPLORIS project) have been used to develop plausible scenarios for the pyroclastic flow and tephra fall distribution over the populated settlements consistent with the assumed eruption.
The elements at risk considered in the analysis are the building structures and the population in the Vesuvian villages of the Red Zone and of the Yellow Zone (these Zones have been identified in the Vesuvius Emergency Plan: the Red Zone has the highest risk of impact including that from pyroclastic flows and is thus to be evacuated first; the Yellow Zone has potential to be affected by ashfall, and is later to be evacuated). The inventory of buildings in the area has been derived from the census data (1991 - 2001) of the Italian Institute of Statistics (ISTAT) and from specific field surveys carried out by the PLINIVS Lab. A Geographic Information System (GIS) containing information, building by building, of all the factors influencing the building response for EQ, PF and AF has been set up, including details on vertical structure, horizontal structure, age, number of stories, roof typology, and type and size of the openings; and this has been used to develop appropriate classifications. The area has been divided into grid cells on a radial grid system, as shown in detail in Figure 7.
Figure 7 Detail of the grid used for subdivision of population and hazard, with the building stock subdivision by seismic class.
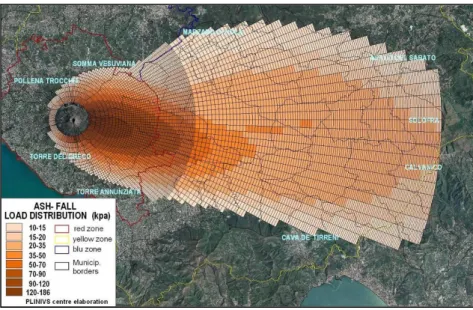
Figure 8 shows the assumed time sequence of one possible eruption scenario selected for modelling. During the first phase of 15 days, earthquakes of gradually increasing magnitude and frequency occur. Phase 2, the eruption proper, begins with a large explosive tephra emission, leading to tephra fall over a wide area, depending on the direction of the wind, and accumulating with gradually increasing depth on the roofs of the buildings; the most probable direction of this ashfall is towards the east, given the direction of the prevailing wind. Phase 2 is assumed to continue for 24 hours: earthquakes may continue, but with a reducing frequency. Phase 3, lasting a few hours, is assumed to involved a major sequence of pyroclastic flows reaching several kilometres from the summit of the volcano, far enough to invade the inhabited areas. The direction of these pyroclastic flows is governed by the topography of the volcano; they are thus assumed to flow preferentially towards the south rather than the north, which to an extent is protected by the old caldera wall of Mt Somma. Figure 9 shows the assumed ashfall distribution over the territory at the end of Phase 1, with contours of increasing depth and ashfall roof load. Notice that ashfall depth sufficient to cause the collapse of some roofs (over 10kPa of vertical load, assuming that the ash is water-saturated) extends over an area extending eastwards, to a distance of some 25km from the summit.
Figure 9: The assumed distribution of ashfall load (based on Macedonio et al, 2006).
EQs(15days) A F (1 day) PF (3hours)
5 10 15 Kpa
The Sub
Plinian
I
Time History chosen
1.5 Kpa 1.0 2.0
to
linear increment up to the Max vertical load on the cells involved.
3 impulsive events per cell
EQ
Phase I
Phase II
Phase III
V VI VII VIII
6 damaging EQ events of Intensity in the range [V – VII] .
Duration In t. & No.
Input from hazard
Credible Intervals
tT tF tE
Source
EQ Intensity sequence f rom
1631 Chronicles (Guidoboni,
Rosi)
AF Intensity dist ribution from
HazMapModel (Macedonio,
Cost a)
PF Intensit y distribution
from 3D Model (Neri,
Cineca)
EQs(15days) A F (1 day) PF (3hours)
5 10 15 Kpa
The Sub
Plinian
I
Time History chosen
1.5 Kpa 1.0 2.0
to
linear increment up to the Max vertical load on the cells involved.
3 impulsive events per cell
EQ
Phase I
Phase II
Phase III
V VI VII VIII Duration In t. & No.
Input from hazard
Credible Intervals
tT tF tE
Source
EQ Intensity sequence f rom
1631 Chronicles (Guidobonii,
Rosi)
AF Intensity dist ribution from
HazMapModel (Macedonio,
Cost a)
PF Intensit y distribution
from 3D Model (Neri,
Cineca)
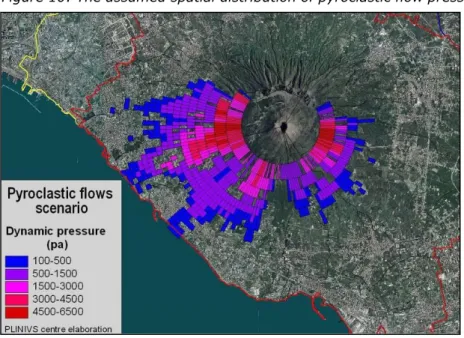
Figure 10 shows, in a similar manner, the assumed pyroclastic flow runout during Phase 3. In this case the key measure of the hazard is the dynamic pressure, which relates to the extent of physical damage to the buildings. Pressures exceeding 0.5 kPa are sufficient to break unshuttered windows; when pressures reach 3 kPa, doors and shuttered windows fail, and pressures exceeding 4 kPa begin to cause major collapse of weaker buildings. All of these effects will occur to some extent in the impacted area shown in Figure 10.
Figure 10: The assumed spatial distribution of pyroclastic flow pressure.
Figure 11 shows the final outcome of the assumed scenario, in terms of the numbers of buildings lost (or destroyed) in each of the cells of the grid, combining those lost by both pyroclastic flow and tephra fall, and taking account of the impact of the previous earthquakes. The number of buildings lost reaches several hundred in some of the most heavily impacted grid cells.
Table 8: The development of the impact through the eruption scenario, by phase, taking account of assumed evacuation.
Stage Typical event Casualties destroyed Buildings Economic Loss
Killed Seriously injured Million Euro
Phase 1 Earthquakes 25 104 1942 4819 Phase 2 Ashfall 5033 10367 22571 8652 Phase 3 Pyroclastic flow 3382 2985 7201 3767
Total 8440 13456 31714 17239
The map of Figure 15 provides a graphic illustration of the extent of the potential risk, and of the vital importance of evacuation. From an insurance perspective it indicates the scale of the accumulation of property damage which could be caused in one single eruption. Table 8 provides more detail of these impacts in terms of numbers of injuries, casualties, as well as building damage, as these develop through the eruption.
From an insurance perspective the most important consideration is property damage, which would be enormous. Although in this model, only residential building damage has been calculated, some 31,000 buildings are estimated to be lost, many of them large residential apartment buildings. Reconstruction costs associated with these dwellings alone would be more than US $12 billion, but a further US $5 billion will be needed to repair damaged properties, bringing estimated residential property damage alone to US $17 billion. To this would be added extensive damage to non-residential property, business and agriculture, as well as clean-up costs, motor and aviation costs and long-term health costs: a total economic loss well exceeding US $24 billion can be envisaged, of which the insurance share cannot at present be calculated.
In terms of human casualties, the impact depends on the extent of evacuation achieved, and a very effective evacuation is assumed in which 98.5% of the population have been evacuated by the end of Phase 1. However, given the immense population at risk there would still be an estimated 8,000 deaths and 13,000 injuries resulting from this large-scale eruption, and there are also certain to be insurance implications from these casualties.
4. Conclusion
In his book Earthquakes and Volcanic Eruptions, Tiedemann (1992) introduced the section about volcanic risks as follows:
“Whereas earthquakes and their damage potential have gradually entered into the consciousness of insurers, the risk from volcanism is rarely if ever discussed, and never analysed. Whether this is due to a belief that volcanism will not leave noticeable scars in insurance portfolios, because only few covers are given, or because volcanoes appear to be situated far from insured risks, or because, unlike earthquakes there has been no catastrophic experience so far, will not be discussed here”.
It remains the case that there has been comparatively little experience of insurance loss from volcanic eruptions. Perhaps the worst case is the loss from the 1980 Mt St Helens eruption, in which insurance losses were only US $27 million out of a total loss of nearly US $1billion (Johnson and Jarvis, 1980).
Subsequent major eruptions such as Pinatubo in the Philippines (1990) Rabaul/Taravur (1994) and Soufriere Hills, Montserrat (1997) have all had insurance costs in the tens of millions of dollars, but nevertheless have not had major impact on global insurance. The total loss from volcanic eruptions over the last 20 years is very small compared with that from earthquakes or floods.
Moreover, it remains true that specific cover for volcanic eruptions is frequently not provided in householders or commercial/industrial policies, even where, as in Europe, most householders have standard fire insurance policies. In Italy, earthquake and volcanic eruption cover, where available, are additional perils, subject to extra premiums, and are rarely covered, though the government has (up till now) normally compensated those who have had property damage from natural catastrophes. Iceland and France seem to be exceptions. In Iceland a compulsory insurance includes natural perils (AXCO, 2007); in France natural perils are covered in all household insurances, and catastrophe losses are met from the State-backed NAT-CAT fund (Spence, 2004).
Thus today, even in Europe, direct cover for volcanic eruptions in household and properties policies is still at a relatively low level. However the penetration of insurance for natural perils may be growing – as stated earlier, the Italian Government has recently passed a law to establish a fund to back such insurance. More significantly, it may be that even when excluded from household policies, losses from volcanic eruptions may hit the insurance industry in other ways – the losses may be deemed to have been the result of earthquakes (which accompany all big eruptions) or floods (if caused by mudslides); and they may hit motor, aviation policies and business interruption cover, or through insurance of agriculture. The last may be especially hard hit if a significantly large eruption occurs, sufficient to cause widespread climate impact.
The potential for large losses is demonstrated by the impact studies for Vesuvius presented in the previous section. These studies looked only at residential property, but showed the potential for substantial financial losses, with an estimated economic damage of around US $24 billion for the Vesuvius scenario, of which the insurance industry’s share is unknown.
Thus, even in the present state of cautious disengagement from volcanic risks, the insurance industry could face a very significant loss, and this alone is reason for more effort to be put into investigating and quantifying risks. But there are other reasons for thinking that a more active involvement of the insurance industry in covering volcanic risks is desirable.
From the point of view of the industry, volcanic risks are inherently insurable. The risk is clearly definable, and both individual losses and accumulations can be estimated. Conditions also exist for sharing the risks among those exposed, since even considering a single volcano, not all those around it and exposed will be affected in any single eruption, and the global market can ensure that the risks are spread worldwide. It would however be important for policies to be offered on a long-term basis because policy-holders will need to be sure that their insurer will not cancel the policy when the volcano shows signs of an impending eruption. From the point of view of the affected government or region, a sharing with the insurance industry of the costs of putting the area back on its feet after a major eruption will be a great benefit. And from the point of view of the affected community, the general introduction of insurance can be coupled with pre-conditions, or premium adjustments based on mitigation actions, which could significantly limit the impact of the eruption, as is commonly the case for fire or windstorm. For example, studies of volcanic impacts have shown that the risk of destruction from pyroclastic flow can be substantially reduced by the use of window shutters or “hurricane boards”; and the risk of roof damage to lightweight roofs can be substantially reduced if simple props are used to support the roofs during an eruption.
To enable the insurance industry to better understand and to extend its present cover of volcanic risks, detailed modelling of these risks from an insurance perspective is needed. Of the several hundred CAT models for country and peril now available, none covers volcanic risks. Tools for modelling the impacts of specific eruption scenarios are now available (Section 3); but more work is now needed to put these onto a probabilistic basis, based on the best understanding of the likelihood of different eruption types and magnitudes, using expert elicitation (Neri et al., 2008) where the scientific data is an insufficient basis for estimating return periods.
This study has identified the 10 European volcanoes with potentially affected populations greater than 10,000, with an aggregated exposed property value at risk of US $85 billion; there are of course many more such volcanoes worldwide. For most of these volcanoes which are within reach of human settlements, there has been extensive scientific investigation of the eruptive history and of the associated hazards, and in several cases some collection of information about the population and buildings at risk, as well as simplified impact studies (Marti et al., 2008, Gomes et al., 2006). The quantification of these risks in a way suitable for estimating insurance risks in aggregate and per property is now possible, and would facilitate a wider insurance coverage of these risks in the future.
Acknowledgements
This paper has been prepared as a part of the Willis Research Network research programme; the authors are grateful to Willis and particularly Rowan Douglas and Matt Foote for their encouragement and support. The paper has been independently reviewed and we are grateful for the reviewer’s comments and suggestions. The research on Vesuvius described was carried out within the EXPLORIS Project, (2002-2006), funded by the EU under its Environment and Climate Research Programme. Special thanks are due to Augusto Neri, Giovanni Macedonio, Jean-Christophe Komorowski and Peter Baxter for their contributions to that project and the data on the eruption scenarios used. The authors also gratefully acknowledge the help of Keiko Saito, Willis Research Fellow at Cambridge University, who prepared the GIS maps.
5.
ReferencesAnnen, C and Wagner, J-J, (2003),The Impact of Volcanic Eruptions During the 1990s, Natural Hazards Review,4(4), pp169-175
AXCO, 2007. Insurance Report
Baxter, P, Cole, P, Spence, R, Neri, A, Zuccaro, G, Boyle, R, (2005), The Impacts of Pyroclastic Surges on Buildings at the Eruption of the Soufriere Hills Volcano, Montserrat, Bulletin of Volcanology, 67:292-313, Springer-Verlag
Blong, R and McKee, C., (1995), The Rabaul eruption 1994: Destruction of a town, National Hazards Research Centre, Mcquarie University, Sydney. Blong, R, (1984), Volcanic hazards, A source book on the effects of eruptions,
Academic, Sydney, Australia, pp 1-424.
Bonadonna, C, Macedonio, G and Sparks, R.S.J, (2002a), Numerical Modelling of Tephra Fallout Associated with Dome Collapses and Vulcanian Explosions: Application to Hazard Assessment on Montserrat, in Druitt, T.H and Kokelarr,B.P (eds), The Eruption of Soufrière Hills Volcano, Montserrat
from 1995 to 1999, Memoir No 21, Geological Society of London.
Bonnadonna, C, Mayberry, G.C, Calder, E.S, Sparks, R.S.J, Choux, C, Jackson, P, Lejeune, A.M, Loughlin, S.C, Norton, G.E, Rose, W.I, Ryan, G and Young, S.R, (2002), Tephra fallout in the eruption of Soufrière Hills Volcano, Montserrat, in (Druitt, T.H and Kokelarr,B.P (eds), The Eruption of
Soufrière Hills Volcano, Montserrat from 1995 to 1999, Memoir No 21,
Geological Society of London.
Boudon G, Komorowski J-C., Villemant B, Semet M.P, (2008), A new scenario for the last magmatic eruption of La Soufrière de Guadeloupe (Lesser Antilles) in 1530 A.D.: evidence from stratigraphy, radiocarbon dating and
magmatic evolution of erupted products. J. Volcanol. Geotherm. Res. In press, manuscript number VOLGEO 03919.
Casadevall, T.J, Reyes, P.J.D, and Schneider, D.J, (1995), The 1991 Pinatubo Eruptions and their Effects on Aircraft Operations, in Newhall and Punongbayan, (eds) Fire and Mud, University of Washington.
Cole, P.D, Guest, J.E, Quieroz, G, Wallenstein, N, Pacheco, J.M, Gaspar, J.L, Ferreira, T, Duncan, A.M, (1999,. Styles of volcanism and volcanic hazards on Furnas volcano, Sao Miguel, Azores, Journal of Volcanological and
Geothermal Research, 92, pp 39-53.
Cole, P. D, Pacheco, J.M, Gunasekera, R, Quieroz, G, Goncalves, P, Gaspar, J.L, (2008), Contrasting styles of explosive eruption at Sete Cidades, Sao Miguel, Azores, in the last 5000 years: Hazard implication from Modelling,
Journal of Volcanological and Geothermal Research,
doi;10.1016/j.jvolgeores.2008.01.008.
Dilley, M, Chen R.S, Deichmann et al., (2005), Natural Disaster Hotspots: a
Global Risk Analysis, World Bank
Dipasquale, G, (2007), (personal Communication)
DPC, (2007), Dipartimento di Protezione Civile, Rome , Press Report
Esposti-Ongaro, E., Neri, A., Menconi, G., De'Michieli Vitturi, M., Marianelli, P., Cavazzoni, C., Erbacci, G., Baxter, P. J., (2008), Transient 3D numerical simulations of column collapse and pyroclastic density current scenarios at Vesuvius, Journal of Volcanological and Geothermal Research, 178 (3),pp 378-396
Ewart and Harpel, (2004), “In harms way”, Geotimes
Gomes, A, Gaspar, J. L and Queiroz, G, (2006), Seismic vulnerability of dwellings at Sete Cidades Volcano (S. Miguel Island, Azores), Natural
Hincks, T., (2006), Probabilistic Volcanic Hazard and Risk Assessment PhD Thesis, University of Bristol
Johnson, R.E and Jarvis J.S, (1980), The insurance industry response. In National disaster: Selected problems and implications, seminar sponsored by the Continuing Legal education Committee.
Kistler, R.E, Kalnay, W., Collins, S, Saha, G, White, J, Woollen, M, Chelliah, W, Ebisuzaki, M, Kanamitsu, V, Kousky, H, van den Dool, Jenne, R and Fiorino, M, (2001), The NCEP-NCAR 50-Year Reanalysis: Monthly Means CD- ROM and Documentation. Bull. Amer. Meteor. Soc., 82, pp 247-268.
Landscan (2008),
http://www.ornl.gov/sci/landscan/landscanCommon/landscan_doc.html#Census Macedonio, G, Costa, A, Folch, A, (2008), Ash fallout scenarios at Vesuvius:
Numerical simulations and implications for hazard assessment, Journal of
Volcanological and Geothermal Research, 178 (3),pp 366-377
Marti, J., Spence, R., Calogero, E., Ordoñez, A., Felpeto, A., Baxter, P., (2008), Estimating building exposure and impact to volcanic hazards in Icod de los Vinos, Tenerife (Canary Islands), Journal of Volcanological and
Geothermal Research, 178 (3), pp 553-561
Marti, J. and Ernst G. G (eds), (2005), Volcanoes and the environment, Cambridge University Press, Cambridge.
Mastrolorenzo, G, Munno, R, and Rolandi, G, (1993), Vesuvius 106: a case study of a paroxysmal eruption and its relation to eruption cycles, Journal of Volcanology and Geothermal Research, 58, pp 217-237.
McGill, C, and Blong, R, (2005), Volcanic risk ranking for Auckland, New Zealand I, Methodology and hazard investigation, Bull. Volcanol., 67, pp 331-339. McGuire, W, (2003), In the shadow of the volcano, The Guardian, October 16,
2003
MunichRe, (2007), Volcanism – Recent findings on the risk of volcanic eruptions,
Schadenspiegel, 1, pp 34-39
Neri, A., Aspinall, W.P., Cioni, R., Bertagnini, A., Baxter, P.J., Zuccaro, G., Andronico, G., Barsotti, S., Cole, P.D., Esposti Ongaro, T., Hincks, T.K., Macedonio, G., Papale, P., Rosi, M., Santacroce, R., Woo, G., (2008), Developing an Event Tree for probabilistic hazard and risk assessment at Vesuvius, Journal of Volcanological and Geothermal Research, 178 (3),pp 397-415
Newhall and Punongbayan, (eds) (1995), Fire and Mud: Eruptions and Lahars of
Mount Pinatubo, Philippines, University of Washington
Newhall, (2007), (Personal Communication)
Newhall, C.G, and Self S (1982), The volcanic explosivity index (VEI): an
estimate of explosive magnitude for historical volcanism. J Geophys Res
(Oceans & Atmospheres), 87, pp 1231-38.
Newhall, C,G, and Hoblitt, R.G, (2002), Constructing event trees for volcanic crises, Bull. Volcanol., 64, pp 3-20.
NOAA, (2007), (NOAA) Climatic Diagnostic Centre (http://www.cdc.noaa.gov). Peduzzi, P, Dao, H, Herold, C, (2002), Global risk and vulnerability index trends
per year (GRAVITY): Phase II Development analysis and results, (http://www.grid.unep.ch/product/publication/download/ew_gravity2.pdf) Rosi, M, Principe, C, and Vecci, R, (1993), The 1631 eruption. A reconstruction
based on historical and stratigraphical data, Journal of Volcanology and
Self, S, (2005), Effects of volcanic eruptions on the atmosphere and climate, Chapter 5 , Marti, J and Ernst, G.G.J (eds) Volcanoes and the
Environment, Cambridge University Press.
Simkin T, and Siebert, L (1994), Volcanoes of the World, 2nd edition. Geoscience Press in association with the Smithsonian Institution Global Volcanism Program, Tucson AZ, pp 368.
Spence, R, (2004), Risk and regulation: can improved government action reduce the impacts of natural disasters?, Building Research and Information,
32(5), pp 391-402 ISSN:0961-3218
Spence, R, Kelman, I, Calogero, E, Toyos, G, Baxter, P and Komorowski J-C, (2005), Modelling expected physical impacts and human casualties from explosive volcanic eruptions, Natural Hazards and Earth Science Systems,
5, pp 1003-1015, European Geosciences Union.
Spence, R.J.S, Kelman, I, Baxter, P.J, Zuccaro, G and Petrazuolli, S, (2005a), Residential building and occupant vulnerability to tephra fall. Natural
Hazards and Earth System Sciences, 5, pp. 477–494.
Tiedemann, (1992), Earthquakes and Volcanic Eruptions, SwissRe
Toyos, G, Cole, P.D, Felpeto, A, Marti, J, (2007), A GIS methodology for hazard mapping small volume pyroclastic Density currents. Natural Hazards,41, 99-112
Zuccaro, G., Cacace, F., Spence, R., Baxter, P., (2008), Impact of explosive eruption scenarios at Vesuvius, Journal of Volcanological and Geothermal
Box 1: Volcanic hazards
Lava flows are rivers of molten rock produced from non-explosive volcanoes, through overtopping of the summit lava-lake, though sometimes also associated with explosive eruptions (as Vesuvius 1944). Their relatively slow progress (often less than 1 km/hour), and limited extent mean that hazards to population are low, and buildings are rarely affected. Exceptions were Catania in 1669, where the lava flow from Etna reached the centre of the city, and Heimaey in Iceland, reached by a lava flow in 1973. They are not considered in this paper
Tephra is a term used for the various solid materials ejected into the atmosphere from a volcano; ash
refers to particles up to 2mm diameter, lapilli are 2-60 mm in diameter, blocks or bombs over 60 mm diameter. The smaller the particles the higher into the atmosphere they reach and the further they travel. Blocks and lapilli may be hot when they are deposited, and have the potential to do serious damage to property and infrastructure eg penetrate roofs, but they rarely fall more than 5-10 km from the source. Ash may spread over a much wider region. Ash fall of 25 cm or more may be of sufficient weight to cause the collapse of sheet or tiled roofs, and will disrupt water and power networks. Such depths are typically found up to 15km from the source in VEI4 eruptions and up to 60km in VEI5 or greater eruptions. But only a few millimetres of ash can be disruptive to sensitive facilities, such as airports, can close roads, and can be disruptive to agriculture, as well as resulting in health hazards. Depending on the direction and strength of the wind such a thickness of ash can be found up to several hundreds of km from the source.
Very fine tephra can persist in the atmosphere for some time, causing a hazard to air traffic; and after major eruptions the concentration of dust in the atmosphere has been of sufficient density and duration to affect the global climate, reducing global temperatures for months, and causing havoc to agricultural production
Volcanic earthquakes can precede impending volcanic eruptions, and often reach their peak in frequency and magnitude in the early stages of an eruption. Their magnitude is rarely larger than M=5.5, but they are relatively shallow, so they can be damaging locally to weaker buildings; and their effects have been found to be cumulative (Zuccaro et al, 2008).
Pyroclastic Density Currents (more commonly known as pyroclastic flows) are hot clouds of volcanic ash with entrained gases which are either blasted laterally from the volcano under pressure, or fall under gravity from the ejected ash cloud; they can move down the slopes of the volcano at high speeds. With temperatures up to or even exceeding 500 deg, they can be devastating to buildings and their occupants and to any other built facilities in their path. The area affected in any one event is limited, but they can typically reach 6km in VEI3 eruptions and 11km in VEI4 eruptions. Pompei was destroyed by a massive pyroclastic flow from Vesuvius in AD 79; and St Pierre in Martinique was destroyed by a pyroclastic flow associated with the 1902 eruption of Mt Pelée. Their effects on buildings have become better understood since observations of the flows associated with recent eruptions such as the 1997 Montserrat eruption (Baxter et al, 2005).
Noxious gases can accompany volcanic eruptions of any severity or occur independently of the other hazardous phenomena. Carbon dioxide, carbon monoxide and sulphur dioxide are the most common gases produced; in sufficient concentration all are lethal to human populations and animals. Even in apparently quiet periods, gas emissions can be sufficient to cause health effects.
Lahars are mudflows generally caused by the mixing of ash deposits with subsequent rainfall, or the melting of snow and ice. Where large volumes of tephra have been deposited, lahars can be very extensive, and have huge destructive power, destroying buildings, bridges, roads, power networks etc in the valleys through which they flow. The lahars associated with the 1991 Mt Pinatubo eruption continued for several years, and altogether around 3 km3 was transported from the volcanoes slopes
into the surrounding lowlands, burying completely numerous towns and villages (Newhall and Punongbayan, 1995)
Tsunamis are caused by the sudden deposition of a large volume of volcanic material in the sea, and are often associated with the eruption of island volcanoes. Tsunamis can travel very large distances, and cause very large run-up (many metres) on distant coasts. Because of the distance they travel, and their impact on coastal communities they can be more destructive than the primary hazards. A famous example was the 1883 eruption of Krakatoa in Indonesia which killed thousands of people on nearby coasts and was observed as far away as Bombay in India (Tiedemann, 1992); a European example was the tsunami believed to have been generated by the massive Santorini eruption of c1650 BC.