S1
Supporting Information for
Modulating Oxygen Vacancies of TiO
2Nanospheres by
Mn-doping to Boost Electrocatalytic N
2Reduction
Haijun Chen,†,# Tongwei Wu,‡,# Xue Li,‡ Siyu Lu,§ Fang Zhang,║ Yan Wang,† Haitao
Zhao,‡ Qian Liu,‡ Yonglan Luo,‡ Abdullah M. Asiri,ʃ Zhe-sheng Feng,*,† Yanning
Zhang,*,‡ and Xuping Sun*,‡
†School of Materials and Energy, University of Electronic Science and Technology of
China, Chengdu 611731, China, ‡Institute of Fundamental and Frontier Sciences,
University of Electronic Science and Technology of China, Chengdu 610054, China,
§Green Catalysis Center, and College of Chemistry, Zhengzhou University,
Zhengzhou 450001, China, ║National Engineering Research Center for Nanotechnology, No. 28 East Jiang Chuan Road, Shanghai 200241, China, and ʃChemistry Department, Faculty of Science & Center of Excellence for Advanced Materials Research, King Abdulaziz University, P.O. Box 80203, Jeddah 21589, Saudi Arabia, #These authors contributed equally to this work
*E-mail: [email protected] (Z.F.); [email protected] (Y.Z.);
[email protected] (X.S.)
Content
Experimental Section
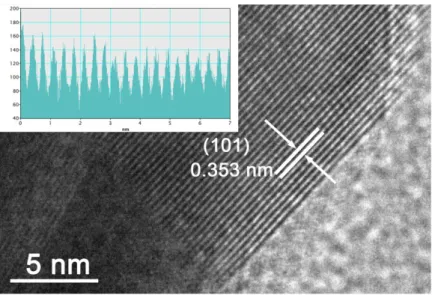
HRTEM image……….…….…..………Figure S1
EDX spectrum………...………....…..…Figure S2
XPS image………...………Figure S3
UV-Vis absorption spectra and calibration curve...Figure S4
UV-Vis absorption spectra and calibration curve... Figure S5
LSV curves...Figure S6
Ion chromatogram curves and calibration curve...Figure S7
Comparison of NRR performance with different electrolytes………...Figure S8
Nyquist plots...Figure S9
UV-Vis absorption spectra...Figure S10
UV-Vis absorption spectra...Figure S11
The mass of produced NH3 vs. reaction time...Figure S12
Time-dependent current density curves and UV-Vis absorption spectra...Figure S13
Photographs of pH test papers...Figure S14
S3
SEM image ...………...Figure S16
XPS spectra………...………..Figure S17
The structure diagram of anatase TiO2(101) surface.………...Figure S18
The atom configuration of NH2NH2 and NNH3 for NRR……….Figure S19
The DOS of bi-Ti3+ in Mn-TiO
2.………...Figure S20
Experimental section
Materials: Tetrabutyl titanate (C16H36O4Ti, TBT), absolute ethanol (C2H5OH),
potassium permanganate (KMnO4), sodium sulfate anhydrous (Na2SO4), ammonium
chloride (NH4Cl), sodium hypochlorite (NaClO), sodium hydroxide (NaOH), sodium
salicylate (C7H5O3Na), hydrazine hydrate (N2H4H2O), concentrated hydrochloric acid
(HCl), and carbon paper were purchased from Beijing Chemical Co., Ltd.. Sodium nitroferricyanide (III) dihydrate (Na2Fe(CN)5NO·2H2O), para-(dimethylamino)
benzaldehyde (C9H11NO), and Nafion solution (5 wt%) were purchased from Aladdin
Co., Ltd. (Shanghai, China). The deionized water used throughout all experiments was purified by a Millipore system. All reagents were analytical reagent grade without further purification.
Preparation of Mn-TiO2 and pristine TiO2 nanospheres: In a typical synthesis procedure, 3 mL of TBT and 1 mmol of KMnO4 were sequentially added into 30 mL
of absolute ethanol and stirred for 30 minutes. Then, the obtained mixture was transferred to a round bottom flask followed by refluxing in an oil bath at 60 °C for 24 h. After cooling to room temperature naturally, the product was thoroughly filtered several times with deionized water and ethanol, followed by drying at 60 °C overnight. Finally, the Mn-TiO2 nanospheres were obtained after annealing at 600 °C for 2 h in
air. Pristine TiO2 was prepared via the same procedure without the addition of
S5
Preparation of Mn-TiO2/CP:
Carbon paper (CP) was cleaned via brief sonication in absolute ethanol and deionized water for several times. To prepare the catalyst ink, 10 mg of Mn-TiO2 and 40 L of 5
wt% Nafion solution were dispersed in 960 L deionized water/ethanol (V : V = 1 : 3) by sonication for 1 h to form a homogeneous dispersion. 10 L of the ink was loaded onto the CP (1 1 cm2) and dried under ambient conditions.
Characterizations: X-ray powder diffraction (XRD) patterns were measured using a Shimadzu XRD-6100 diffractometer (Shimadzu, Japan) with a Cu Kα radiation. X-ray photoelectron spectroscopy (XPS) was performed using an ESCALABMK 250Xi instrument with a monochromatic Al Kα radiation source. The morphology of the samples is characterized by a tungsten lamp-equipped SU3500 field-emission scanning electron microscope (FESEM, Hitachi, Japan) at an accelerating voltage of 20 kV. The TEM images, high-resolution TEM images and the corresponding X-ray energy dispersive spectroscopy (EDS) elemental mapping images were obtained by a Zeiss Libra 200FE transmission electron microscope operated at 200 kV. Electron paramagnetic resonance (EPR) spectrum was recorded on a Bruker EMXmicro spectrometer at room temperature. The absorbance data were obtained by Shimadzu UV-1800 UV-Vis spectrophotometer. The ion chromatography data were obtained by using a ThermoFisher ICS 5000 plus ion chromatograph with the dual temperature heater, injection valve, conductivity detector and AERS 500 anion suppressor.
Electrochemical measurements: The electrochemical measurements were carried on the CHI760E electrochemical workstation (Shanghai, Chenhua) using a standard three-electrode setup. A gastight H-type cell separated by Nafion 117 membrane was used as electrolytic cell. The membrane pretreated by heating in the deionized water, 3% H2O2 solution and 0.5 M H2SO4 at 80 °C for 1 h, respectively, and then washed
with ultrapure water. The Mn-TiO2/CP, Ag/AgCl electrode, graphite rod and 0.1 M
Na2SO4 were used as working electrode, reference electrode, counter electrode and
electrolyte, respectively. During the test, high purity N2 was continuously flowed into
the cathodic chamber of the cell with a flowing rate of 25 mL min-1. Before feeding
N2 gas into the electrolyte, it was purified through 0.05 M H2SO4 solution to remove
impurities. All potentials were measured with Ag/AgCl reference electrode are converted to the RHE scale using the following equation: E (vs. RHE) = E (vs. Ag/AgCl) + 0.197 V + 0.0591 × pH. (S1)
Determination of NH3: The produced NH3 concentration was detected with the
indophenol blue method by a spectrophotometer. In detail, 4 mL of the electrolyte from the cathodic chamber was mixed with 50 µL oxidizing solution (ρCl = 4 − 4.9
NaClO and 0.75 M NaOH), 500 µL coloring solution (0.4 M C7H6O3Na and 0.32 M
NaOH), and 50 µL catalyst solution (1 wt% Na2[Fe(CN)5NO]•2H2O) for 1 h. The
stained solutions were tested by a UV-Vis spectrophotometer. The standard curve (y = 0.516x + 0.019, R2 = 0.999) was calibrated using NH
4Cl solution with a series of
S7 value and NH4Cl concentration.
NH3 yield was calculated by the following equation:
NH3 yield = c(NH3) V / (tm) (S2)
Faradaic efficiency (FE) was calculated by the following equation: FE = 3Fc(NH3) V / (17 Q) 100% (S3)
where c(NH3) is the measured NH3 concentration, V is the volume of the electrolyte, t
is the reduction time, m is the mass loading of the catalyst on carbon paper, F is the Faraday constant, Q is the total quantity of applied electricity.
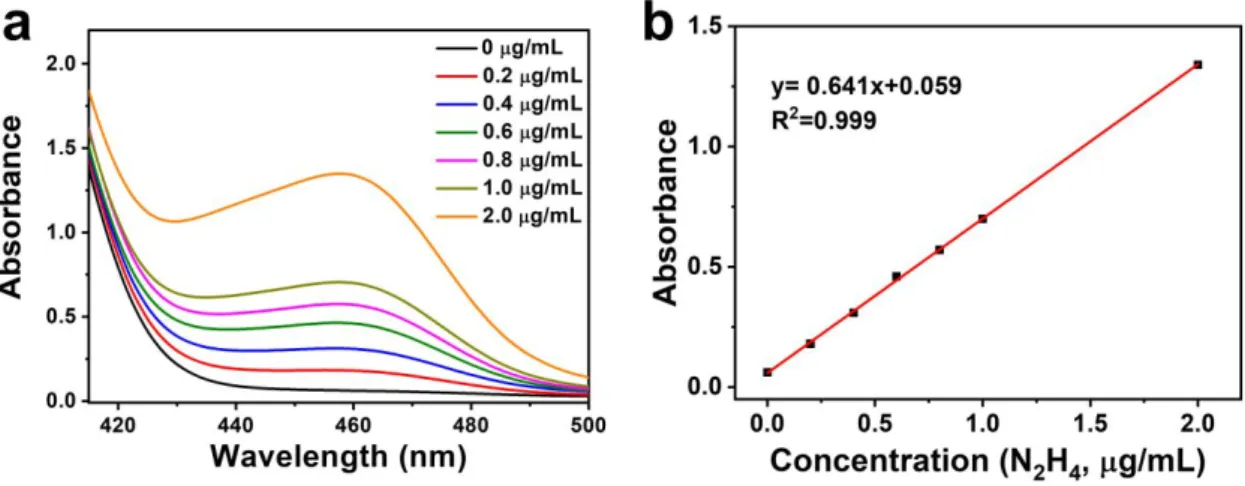
Determination of N2H4: The N2H4 content was determined by the method of Watt
and Chrisp. 5.99 g of p-C9H11NO, 30 mL of concentrated HCl, and 300 mL of
C2H5OH were mixed and used as a color reagent. Specifically, a series of N2H4
solutions with known concentrations are first prepared as standard solutions. Then, 5 mL of the color reagent was added into the above N2H4 solutions to stand for 10
minutes. Finally, the absorbance of the resulting solution was measured at 460 nm and the calibration curve of N2H4 was obtained. The fitting curve shows a good linear
relationship between absorbance and N2H4 concentration (y = 0.641x + 0.059, R2 =
0.999).
Details of Density Functional Theory (DFT) Calculations: Spin-polarized density functional theory (DFT) calculations were performed by using the plane wave-based Vienna ab initio simulation package (VASP).1,2 The generalized gradient
to describe the exchange-correlation interaction among electrons.3 The van der Waals
(vdW) correction with the Grimme approach (DFT-D3) was included in the interaction between single molecule/atoms and substrates.4 The energy cutoff for the
plane wave-basis expansion was set to 500 eV and the atomic relaxation was continued until the forces acting on atoms were smaller than 0.01 eV Å−1. The surface of TiO2 (101) was modeled using a 2 × 2 slab with four trilayers (O-Ti-O), of which
the bottom trilayer was fixed and separated by 15 Å of vacuum. The Brillouin zone was sampled with 3 × 3 × 1 Gamma-center k-point mesh, and the electronic states were smeared using the Fermi scheme with a broadening width of 0.1 eV.
The free energies of the reaction intermediates were calculated by ΔG = ΔEads +
ΔZPE – TΔS, where ΔEads is the adsorption energy, ZPE is the zero point energy, and
S is the entropy at 298 K. In this study, the entropies of gas phase molecules are obtained from the literature.5
The formation energies of oxygen vacancy on TiO2 (101) and Mn-TiO2 (101) is
defined as the following equation:
EV = E (MnxTin-xOm-y) + y/2 E (O2) – E (MnxTin-xOm) (S4)
where EV is the formation energy of oxygen vacancy, E (MnxTin-xOm-y) and E
(MnxTin-xOm) are the total energies with and without oxygen vacancy, respectively. E
(O2) is the total energy of single oxygen. x, n, and m are the number of Mn, Ti, and O
atoms in the surface supercell, respectively. y represents the number of oxygen vacancy.
S9
S11
Figure S4. (a) UV-Vis absorption spectra of indophenol assays with NH3
concentrations after incubated for 1 h at room temperature. (b) Calibration curve used for calculation of NH3 concentration.
S13
Figure S5. (a) UV-Vis absorption spectra of various N2H4 concentrations after
incubated for 10 min at room temperature. (b) Calibration curve used for estimation of N2H4 concentration.
S15
Figure S7. (a) Ion chromatogram curves for the NH4+ ions. (b) Calibration curve used
for estimation of NH4+. (c) Ion chromatogram for the electrolytes at a series of
potentials after electrolysis for 2 h. (d) NH3 yields and FEs for Mn-TiO2/CP at
Figure S8. NH3 yields and FEs of Mn-TiO2/CP at −0.50 V in 0.1 M Na2SO4 and 0.5
S17
Figure S10. UV-Vis absorption spectra of 0.1 M Na2SO4 electrolytes stained with
S19
Figure S11. UV-Vis absorption spectra of the electrolytes estimated by the method of Watt and Chrisp before and after 2 h electrolysis in N2 atmosphere at −0.50 V.
Figure S12. The mass of produced NH3 vs. reaction time at −0.50 V over
S21
Figure S13. (a) Time-dependent current density curves of Mn-TiO2/CP under
recycling tests for NRR at −0.50 V in 0.1 M Na2SO4. (b) UV-Vis absorption spectra
Figure S14. Photographs of pH test papers in 0.1 M Na2SO4 before and after 24 h
S23
S25
Figure S17. XPS spectra of Mn-TiO2 in (a) Ti 2p, (b) O 1s, and (c) Mn 2p regions
Figure S18. The structure diagram of anatase TiO2(101) surface and the total energy
S27
Figure S19. (a) The atom configuration of NH2NH2 for NRR on VO1-decorated
Mn-TiO2 surface. (b) The atom configuration of NNH3 for NRR on VO2-decorated
Figure S20. The DOS of bi-Ti3+ (Ti
S29
Table S1 Comparison of the catalytic performances of Mn-TiO2 with reported Mn-
and Ti-based NRR catalysts under ambient conditions.
Catalysts Electrolyte NH3 yield
(g h-1 mg-1 cat.)
FE (%) Ref.
Mn-TiO2 0.1 M Na2SO4 20.05 11.93 This work
Y-TiO2-C 0.1 M HCl 6.3 11.0 (6) V-TiO2 0.5 M LiClO4 17.76 15.3 (7) C-doped TiO2 0.1 M Na2SO4 16.22 1.84 (8) TiO2 0.1 M Na2SO4 5.6 2.5 (9) TiO2-rGO 0.1 M Na2SO4 15.13 3.3 (10) B-doped TiO2 0.1 M Na2SO4 14.4 3.4 (11) d-TiO2/TM 0.1 M HCl 7.58 9.17 (12) Mn3O4 nanocube 0.1 M Na2SO4 11.6 3.0 (13) Ti3C2Tx nanosheet 0.1 M HCl 20.4 9.3 (14)
Zr-doped TiO2 0.1 M KOH 8.9 (g h-1 cm-2) 17.3 (15)
TA-reduced Au/TiO2 0.1 M HCl 21.4 8.11 (16) Mn3O4@rGO 0.1 M Na2SO4 17.4 3.52 (17) MnO/TM 0.1 M Na2SO4 7.92 8.02 (18) TiC/C NF 0.1 M HCl 14.1 5.8 (19) TiO2/Ti3C2Tx 0.1 M HCl 26.32 8.42 (20) MnO-CNF 0.1 M Na2SO4 35.9 1.52 (21)
References
(1) Kresse, G.; Furthmuller, J. Efficiency of ab-initio total energy calculations for metals and semiconductors using a plane-wave basis set. Comp. Mater. Sci.1996,
6 (1), 15−50, DOI 10.1016/0927-0256(96)00008-0.
(2) Kresse, G.; Furthmuller, J. Efficient iterative schemes for ab initio total-energy calculations using a plane-wave basis set. Phys. Rev. B 1996, 54 (16), 11169−11186, DOI 10.1103/PhysRevB.54.11169.
(3) Perdew, J. P.; Burke, K.; Ernzerhof, M. Generalized gradient approximation made simple. Phys. Rev. Lett. 1996, 77 (18), 3865−3868, DOI 10.1103/PhysRevLett.77.3865.
(4) Grimme, S.; Antony, J.; Ehrlich, S.; Krieg, H. A consistent and accurate ab initio parametrization of density functional dispersion correction (DFT-D) for the 94 elements H-Pu. J. Chem. Phys.2010, 132 (15), 154104, DOI 10.1063/1.3382344. (5) https://janaf.nist.gov/.
(6) Yang, L.; Choi, C.; Hong, S.; Liu, Z.; Zhao, Z.; Yang, M.; Shen, H.; Robertson, A. W.; Zhang, H.; Lo, T. W. B.; Jung, Y.; Sun, Z. Single yttrium sites on carbon-coated TiO2 for efficient electrocatalytic N2 reduction. Chem. Commun.
2020, 56 (74), 10910−10913, DOI 10.1039/D0CC01136C.
(7) Wu, T.; Kong, W.; Zhang, Y.; Xing, Z.; Zhao, J.; Wang, T.; Shi, X.; Luo, Y.; Sun, X. Greatly Enhanced Electrocatalytic N2 Reduction on TiO2 via V Doping.
S31
(8) Jia, K.; Wang, Y.; Pan, Q.; Zhong, B.; Luo, Y.; Cui, G.; Guo, X.; Sun, X. Enabling the electrocatalytic fixation of N2 to NH3 by C-doped TiO2
nanoparticles under ambient conditions. Nanoscale Adv. 2019, 1, 961−964, DOI 10.1039/C8NA00300A.
(9) Zhang, R.; Ren, X.; Shi, X.; Xie, F.; Zheng, B.; Guo, X.; Sun, X. Enabling Effective Electrocatalytic N2 Conversion to NH3 by the TiO2 Nanosheets Array
under Ambient Conditions. ACS Appl. Mater. Interfaces2018, 10, 28251−28255, DOI 10.1021/acsami.8b06647.
(10) Zhang, X.; Liu, Q.; Shi, X.; Asiri, A. M.; Luo, Y.; Sun, X.; Li, T. TiO2
nanoparticles-reduced graphene oxide hybrid: an efficient and durable electrocatalyst toward artificial N2 fixation to NH3 under ambient conditions. J.
Mater. Chem. A2018, 6 (36), 17303−17306, DOI 10.1039/C8TA05627G.
(11) Wang, Y.; Jia, K.; Pan, Q.; Xu, Y.; Sun, X. Boron-Doped TiO2 for Efficient
Electrocatalytic N2 Fixation to NH3 at Ambient Conditions. ACS Sustainable
Chem. Eng.2019, 7, 117−122, DOI 10.1021/acssuschemeng.8b05332.
(12) Yang, L.; Wu, T.; Zhang, R.; Zhou, H.; Xia, L.; Shi, X.; Sun, X. Insights into defective TiO2 in electrocatalytic N2 reduction: combining theoretical and
experimental studies. Nanoscale 2019, 11, 1555−1562, DOI 10.1039/C8NR09564G.
(13) Wu, X.; Xia, L.; Wang, Y.; Lu, W.; Liu, Q.; Shi, X.; Sun, X. Mn3O4 Nanocube:
14, 1803111, DOI 10.1002/smll.201803111.
(14) Zhao, J.; Zhang, L.; Xie, X.; Li, X.; Ma, Y.; Liu, Q.; Fang, W.; Shi, X.; Cui, G.; Sun, X. Ti3C2Tx (T = F, OH) MXene nanosheets: conductive 2D catalysts for
ambient electrohydrogenation of N2 to NH3. J. Mater. Chem. A 2018, 6,
24031−24035, DOI 10.1039/C8TA09840A.
(15) Cao, N.; Chen, Z.; Zang, K.; Xu, J.; Zhong, J.; Luo, J.; Xu, X.; Zheng, G. Doping strain induced bi-Ti3+ pairs for efficient N
2 activation and electrocatalytic
fixation. Nat. Commun.2019, 10, 2877, DOI 10.1038/s41467-019-10888-5. (16) Shi, M. M.; Bao, D.; Wulan, B. R.; Li, Y. H.; Zhang, Y. F.; Yan, J. M.; Jiang, Q.
Au Sub‐Nanoclusters on TiO2 toward Highly Efficient and Selective
Electrocatalyst for N2 Conversion to NH3 at Ambient Conditions. Adv. Mater.
2017, 29 (17), 1606550, DOI 10.1002/adma.201606550.
(17) Huang, H.; Gong, F.; Wang, Y.; Wang, H.; Wu, X.; Lu, W.; Zhao, R.; Chen, H.; Shi, X.; Asiri, A. M.; Li, T.; Liu, Q.; Sun, X. Mn3O4 nanoparticles@reduced
graphene oxide composite: An efficient electrocatalyst for artificial N2 fixation to
NH3 at ambient conditions. Nano Res. 2019, 12 (5), 1093−1098, DOI
10.1007/s12274-019-2352-5.
(18) Wang, Z.; Gong, F.; Zhang, L.; Wang, R.; Ji, L.; Liu, Q.; Luo, Y.; Guo, H.; Li, Y.; Gao, P. Electrocatalytic Hydrogenation of N2 to NH3 by MnO: Experimental
and Theoretical Investigations. Adv. Sci. 2018, 6, 1801182, DOI 10.1002/advs.201801182.
S33
(19) Yu, G.; Guo, H.; Kong, W.; Wang, T.; Luo, Y.; Shi, X.; Asiri, A.; Li, T.; Sun, X. Electrospun TiC/C nanofiber for ambient electrocatalytic N2 reduction. J. Mater.
Chem. A2019, 7 (34), 19657−19661, DOI 10.1039/C9TA07096F.
(20) Zhang, J.; Yang, L.; Wang, H.; Zhu, G.; Wen, H.; Feng, H.; Sun, X.; Guan, X.; Wen, J.; Yao, Y. In Situ Hydrothermal Growth of TiO2 Nanoparticles on a
Conductive Ti3C2Tx MXene Nanosheet: A Synergistically Active Ti-Based
Nanohybrid Electrocatalyst for Enhanced N2 Reduction to NH3 at Ambient
Conditions. Inorg. Chem. 2019, 58 (9), 5414−5418, DOI 10.1021/acs.inorgchem.9b00606.
(21) Zheng, X.; Zhang, Z.; Li, X. M.; Ding, C. MnO-carbon nanofibers composite material toward electro-chemical nitrogen fixation at ambient conditions. New J. Chem. 2019, 43 (21), 7932−7935, DOI 10.1039/C9NJ00869A.