Trade Liberalization and Employment in the Moroccan
Manufacturing Sector
Firm-level Analysis
ByLahcen ACHY1 and Khalid SEKKAT2 July 2004
Abstract
This paper uses firm level data to investigate the impact of trade liberalization on manufacturing sector employment in Morocco. This paper extends the existing research in various dimensions. First, it analyses the effect of trade openness on different skill levels of the manufacturing labor force. Second, the paper investigates the role of technology in explaining the magnitude of employment response following trade liberalization reforms. Our empirical results indicate that technology, as measured by capital intensity, and the share of new capital matters relatively more than trade in accounting for employment changes. In terms of policy implications, trade protection does not appear to be an effective tool in terms of saving jobs. Moreover, Moroccan commitments to further liberalize its trade means that manufacturing firms will have to face more competitive pressures on both domestic and foreign markets. Those firms that are endowed with upgraded technology are more likely to maintain or potentially raise their market shares, and hence create more jobs.
Our results indicate that openness to foreign trade induces a significant skill composition effect. However, it also appears that skilled labor demand is highly sensitive to relative wages, which is consistent with the dominance of low value added products in the Moroccan manufacturing industries for which labor cost largely matters.
The challenge for policy-makers is to design an appropriate support policies that stimulate domestic firms to invest and upgrade their technologies, ensure some degree of labor market flexibility, and create a business environment attractive for foreign investment.
Table of Contents
1. INTRODUCTION ...2
2. LITERATURE OVERVIEW ...3
3. OVERVIEW OF MACRO-ECONOMIC AND TRADE REFORMS IN MOROCCO ...6
4. PRELIMINARY ANALYSES OF SURVEY DATA ...9
4.1. DATA COVERAGE... 9
4.2. SKILL COMPOSITION OF THE MANUFACTURING LABOR FORCE... 10
4.3. CAPITAL VINTAGES AND INVESTMENT DECISION... 12
4.4. FOREIGN TRADE PATTERNS OF MANUFACTURING FIRMS... 14
5. ECONOMETRIC INVESTIGATION ...15
5.1. THEORETICAL BACKGROUND OF LABOR DEMAND FUNCTIONS... 15
5.2. ECONOMETRIC RESULTS... 17
6. CONCLUSIONS AND POLICY IMPLICATIONS ...25
1. Introduction
Over the nineties, Morocco has strengthened its trade liberalization policy that begun in 1983. As explicitly asserted in the “Foreign Trade law” (1992), trade liberalization intended to promote exports; integrate the Moroccan economy into the world economy; and contribute to consolidate the multilateral trading system. By implementing the foreign trade law, Morocco committed itself to liberalize imports and exports of goods and services, abolish any quantitative restrictions, and use exclusively tariffs in protecting domestic production. When joining the GATT in 1987, Morocco bound 156 tariff lines, which accounted for 30 per cent of its total imports at the time. By the year 2000, bound tariff lines covered 100 percent of its imports.
Morocco has also signed a Free Trade Agreement with the European Union (EU) in 1995, which has been effectively implemented since 2000. This agreement aims at establishing by the end of a 12-year transition period (starting from 2000), a free trade area (FTA) for most products and seeks to promote and enhance economic growth. The main features of the agreement are as follow. First, progressively eliminate all tariffs on industrial goods over 12 years. This implies that Morocco has to dismantle the protection on the industrial goods imported from EU since its industrial exports already received preferential customs treatment. Second, gradual and limited liberalization for agricultural products. Third, adoption of a wide range of trade-related regulations such as harmonization of rules and regulations in the fields of competition, intellectual property, and industrial standards. In addition to the FTA with EU, Morocco have implemented or negotiated other bilateral and regional trade agreements such as the free-trade agreement with EFTA (1997), the Arab FTA (1998). More recently, Morocco signed free trade agreements with the United States (2004) and Turkey (2004).
This paper uses firm level data to investigate the impact of trade liberalization on manufacturing sector employment in Morocco. Measuring the real impact of trade liberalization on employment as it has been shown in the literature reviewed, among others, by Lall (2004), Vivarelli (2004), and Spiezia (2004) is a very delicate issue. Employment can be affected by many factors other than trade liberalization, such as macroeconomic cycle, technological change, and labor market institutions. Rama (1995) found that Latin American economies with more flexible labor markets tend to experiment higher productivity and faster economic growth compared to those economies with more restrictive labor market regulations. The multi-dimensionality of the openness phenomenon requires a careful control for non-trade factors as to isolate properly the impact of trade on employment. Moreover, it has been argued that the relationship between trade openness and labor market responses is largely context-specific and tends to vary from one country to the other. This paper deals with the
This paper is expected to contribute to the existing literature on the issue of trade liberalization and labor market outcomes in developing countries in three different dimensions. First, although tariff reductions are usually implemented at the industry level, it is reasonable to expect differences in their effects depending on firms’ characteristics such as size, export orientation, or capital intensity. Using firm level data over the period 1984-1989, Currie and Harisson (1997) found that trade reforms had almost no effect on aggregate employment in the Moroccan manufacturing sector. However, they found that publicly owned firms and export-oriented firms were strongly affected. After a decade of further trade reforms, a wide process of privatization of state owned enterprises, and an export promotion strategy, their conclusions need to be tested and updated. Second, this paper accounts for skill composition effect of the manufacturing labor force, and analyzes separately the impact of trade liberalization on skilled and unskilled labor. Although trade liberalization may lead to a sluggish impact on aggregate employment, it is not unlikely that this occurs with a different allocation of labor between skilled and unskilled workers. Third, this paper uses a new and detailed database drawn from the Firm Analysis and Competitiveness survey (FACS) conducted in (2000) jointly by the Moroccan Ministry of Industry and Trade, and the World Bank.
The rest the paper is organized as follows. The second section provides an overview of recent literature in the area. The third section presents briefly an overview of macro-economic background and trade reforms that took place in Morocco over the nineties The fourth section describes data sources and variables used in the paper. The fifth section presents the empirical approach and provides the econometric estimates. Finally, the last section discusses our findings and their policy implications.
2. Literature overview
Over the last two decades, there has been a widespread interest regarding the effects of trade on labor market in industrialized countries. In the USA, trade is often blamed for widening wage inequality between skilled and unskilled workers. In Europe, trade is sometimes associated with job losses and increasing unemployment. Although these arguments may appear plausible on the basis of standard theories of international trade, (Heckcher-Ohlin (HO) model), they are not generally supported by the empirical research (Dewatripont, Sapir & Sekkat 1999). More recently, attention has been paid to looking at the impact of trade on the labor market in developing countries. This interest has strengthened with trade reforms implemented in a large number of developing countries since the early eighties. It has also been reinforced by an increasing trend of regional and multilateral free trade agreements in which developing countries are involved, such as NAFTA, and Euro-Mediterranean free trade agreements (EUROMED). Using the same standard theoretical background (HO model), policy-makers and international organizations argue that trade liberalization would lead to higher labor demand in the manufacturing sector, in particular among unskilled workers. So the relative wage of
unskilled workers would rise, and wage inequality would decline. Spiezia (2004) shows that the H-O model and technology gap theory of trade lead to opposing predictions regarding the impact of trade openness on employment in developing countries. If the productivity gap between developing and industrialized countries were larger for labor than for capital, the former would end up exporting capital-intensive products and creating less employment.
Empirically, two methodological approaches have been generally applied to assess the effects of trade reforms on employment or other economic aggregates such as wages, output, exports, and imports.
A first set of papers is based on the computable general equilibrium (CGE) models to formalize trade patterns and their effects. The CGE modeling strategy has been largely applied since it offers a rich and flexible framework for assessing quantitatively various scenarios of economic policies such as dismantling of trade barriers, depreciation of exchange rate, productivity shocks, and changes in international environment. The general conclusion of CGE models is that trade liberalization, through competition pressures and productivity improvement, is expected to lead to substantial welfare gains in medium and long-run. However, these models exhibit large adjustment costs in the short-run that need to be tackled by implementing other economic and institutional reforms such as financial sector reforms, competition law, administrative and judicial reforms, flexible labor market and safety nets for the poor.
The CGE modeling methodology has been recently applied to the case of Morocco among others by Rutherford et al. (1997), Chater & Hamdouch (2001) and Achy & Milgram (2003). In their paper, which was mainly focused on assessing the Morocco’s free trade agreement (FTA) with the EU, Rutherford et al. (1997) found that the welfare benefits for Morocco are about 1,5 percent of GDP, and may reach 2,5 percent of GDP if Morocco further liberalized its trade with the rest of the world. Their model shows that the extra welfare gains occur without additional reallocation of labor and capital among sectors. The rationale behind this finding is the following. Not removing tariffs against non-EU countries induces resource movements toward sectors that are not the most efficient by world standards. In terms of employment, Morocco’s FTA with the EU would increase employment by 2,5 percent, and 3 percent under multilateral liberalization scenario. Although the authors performed various sensitivity analyses to check for the robustness of their results, Moroccan policy-makers have found them doubtful. Their argument is that the agreement involves large asymmetric reduction in tariffs, which grants the EU access to the Moroccan market, while Morocco benefited already from such access to the EU. Using a similar CGE methodology and assuming imperfect competition and increasing returns to scale, Chater and Hamdouch (2001) reached opposing results. The complete
skilled workers. Surprisingly, intermediate executives would also suffer under FTA with the EU, which is explained according to the authors by the expected investment decline in capital intensive industries highly protected before tariff dismantling such as food, and chemical industries. Using a computable general equilibrium framework, Achy and Milgram (2003) have shown that the FTA between Morocco and European union is likely to accentuate the Moroccan specialization in low value added industrial products. Their simulations reveal that at the aggregate level, trade liberalization leads to a small decline of output. Agénor and El Aynaoui (2003) constructed a very promising CGE model for Morocco that deals explicitly with different features characterizing the Moroccan labor market such as the existence of a large public sector, segmented labor market, powerful trade unions, and domestic and international labor migration. Although this model allows to investigate a variety of macroeconomic and structural policies as stated by the authors themselves, the paper focuses only on the impact of labor market policies (minimum wage, payroll taxes) on employment in Morocco and does not address explicitly the impact of trade liberalization on employment.
The second methodological approach is based on econometric models that investigate the impact of trade on labor market outcomes either using cross-country regressions, or disaggregated data on single country cases. Although the findings are still not clear cut regarding trade liberalization effects on the labor market, there is an emerging evidence showing that trade reforms tend to increase the relative demand for skilled workers and widen wage inequality between skilled and unskilled workers. This last finding turns to be at odd with the predictions of HO model. Hanson and Harisson (1999) investigate the changes in wages and employment of skilled and unskilled workers in Mexico in response to trade liberalization. They found little effect on total employment, but significant increase in the skilled workers’ relative wages. In the same vein, Currie and Harisson (1997) and Revenga (1997) have analyzed the cases of Morocco and Mexico respectively, and detected a modest impact of tariff and non-tariff reductions on employment. The lack of employment response is largely attributed by the authors to the context of imperfect competition. In Morocco, such as in many other developing countries, few players and high barriers to entry characterize some sectors. Adjustment to trade reform in such a context is likely to occur trough a reduction of profit margins or a productivity improvement.
Empirically and contrary to the standard trade theory, the impact of trade liberalization on the level of employment in import competing industries is found to be weak. It has also been shown that the magnitude of the employment effect depends on the nature of the labor market and the wage-setting mechanism (Revenga 1992). In a unionized labor market, where workers are endowed with relatively strong bargaining power, wages diverge from their equilibrium levels, and the adjustment process tends to be more complex and less predictable. Labor unions may either allow for more wage responsiveness than what would have occurred in a perfectly competitive labor market to preserve jobs. They may also reject any wage concession at the expense of employment. Trade liberalization
effects may also emerge through changes in the skill composition of the labor force and skill wage differentials.
A recent study by Dasgupta, Nabli, Pissarides and Varoudakis (2003) suggests that contrary to the experience elsewhere in developing countries, trade expansion did not have any significant impact on industrial employment in MENA countries. Two explanations have been given to rationalize this finding. First, the “quality gap” in MENA trade concentrated in primary commodities and low-value added products, and partly to poorly performing labor market institutions that constrain the medium-term benefits from increased trade openness while exacerbating the adjustment costs.
3. Overview of macro-economic and trade reforms in Morocco
The Moroccan government has embarked, since the early eighties, in a comprehensive macroeconomic stabilization program (the structural adjustment program -SAP ) with the support of the IMF, and the World Bank. The SAP aimed at addressing internal and external macro-economic imbalances and liberalizing the economy. A package of economic reforms has gradually been implemented such as trade liberalization, tax reform, financial sector reform, and finally public enterprise reforms and privatization.
Morocco is a country which succeeded to a large extent in implementing the stabilisation policies (low inflation rate, budget deficit relatively under control, and declining debt burden), yet Morocco is a case of low and highly volatile economic growth. Several studies point out the detrimental effects of excessive volatility in GDP growth rates on the level of these growth rates (Sekkat 2004). The stabilisation programs left very small room to the fiscal policy both in managing exogenous shocks, and in providing “non-market incentives” to potential investors. Quantitatively, the average growth rate of the Moroccan economy during the last two decades (80’s and 90’s) has been around 3 percent. It stood around 3,5 percent during the adjustment period (1983-1992) and declined to 2,2 percent over the period (1993-2000).
The substantial and persistent trade balance deficit has been kept under control due to the upward trend remittances by Moroccan workers abroad, which exceeded $ 3,5 billion in 2003 and represented roughly 8,15 percent of GDP. On average, remittances of Moroccan abroad evolved at a yearly rate of 12,5 percent between 1998 and 2003. In addition to remittances, tourism receipts also play a critical role in providing foreign exchange and contributing to alleviate the burden of debt service. The tourism industry receipts amounted to more than $ 3 billions in 2003.
Table 1. Basic macroeconomic indicators
Indicators 1973-77 1978-82 1983-92 1993-00
GDP growth (annual %) 6,0 3,0 3,5 2,6
GDP per capita growth 3,6 0,8 1,4 0,9
Trade (% of GDP) 52,7 49,3 54,6 60,4
External balance on goods and services (% of GDP) -10,4 -13,2 -6,4 -4,3 Current account balance (% of GDP) -12,1 -10,2 -2,6 -1,0
Inflation, consumer prices (annual %) 10,1 10,1 6,4 2,6
Source: Authors’ computation from World Bank Indicators database (2001) and various issues of the Bank Al Maghrib report.
The employment performance of the manufacturing sector in Morocco increased in the late eighties by 9,5 percent yearly compared to 5,6 percent for the rest of the economy. Manufacturing employment continued its upward trend during the nineties but at a lower rate. It grew by a yearly average of 3,6 percent from 1990 to 1994, and only 1,42 percent from 1995-2000, which is very low compared to the urban labor force growth boosted by a substantial increase in female participation rates, and large migration flows from rural areas.
Morocco put special emphasis on the manufacturing sector as a pillar of its development strategy. However, the value added of this sector did not record any substantial growth during the nineties. Its contribution continues to stand around 18 percent of total GDP, with a net domination of textiles and clothing, chemical, and mineral industries. During the nineties, value added growth rate averaged a 2,7 percent compared to 4,1 percent during the eighties.
Tariff protection has declined over the nineties, notably for the manufacturing sector. Average protection rate estimated to 38,3 percent in 1990 taking into account non-tariff protection, which concerned roughly 10 percent of imports, declined to 23,5 percent in 19953. However, the conversion of the quantitative restrictions (quotas) previously imposed on imports of agricultural products into tariffs in 1996, and the incorporation of the “fiscal import levy” into the import duty contributed to increase the simple arithmetic average of tariffs to 33,4 percent in 2002 with a standard deviation of 22,8. Agriculture remains the most highly protected sector with an average rate of 40 percent, and tariff peaks that reaches 339 percent. Frequently used tariffs are 50 percent with one third of tariff lines, 40 percent with 17 percent of tariff lines and 2,5 percent with 14 percent of tariff lines.
Table 2. Customs duties by ISIC branch of activities, 2002 Rate applied (2002) ISIC Code Description Number of lines Simple average Range Standard deviation Share of Imports (2001) 1 Agriculture, hunting, forestry and fishing 827 39,9 2,5-339 38,5 0,96
2 Mining and quarrying 188 22,1 0-50 10,7 14,45
3 Manufacturing (including food products, beverages and tobacco) (excluding food, beverages and tobacco)
15660 33,2 2,5- 339 23,8 75,69
31 Manufacture of food products, beverages and tobacco
1727 55,8 2,5-339 46,6 5,97
32 Manufacture of textiles, wearing apparel and leather 3624 39,7 2,5-50 9,7 16,10
321 Manufacture of textiles 2973 38,0 2,5-50 9,6 13,98
322 Manufacture of wearing apparel 363 49,7 10-50 3,6 1,13
323 M anufacture of leather 192 42,9 2,5-50 7,2 0,69
324 Manufacture of footwear 96 50,0 50 0,0 0,31
33 Manufacture of wood and wood products, including furniture
453 40,2 2,5-50 11,0 1,53
34 Manufacture of paper and paper products, printing and publishing
531 41,6 2,5-50 13,3 2,07
35 Manufacture of chemicals and chemical, petroleum, coal, rubber and plastic products
3217 28,3 2,5-50 16,2 15,94
36 Manufacture of non-metallic mineral products, except products of petroleum and coal
501 36,7 2,5-50 13,9 0,92
37 Manufacture of basic metals 1354 24,4 2,5-50 11,6 4,47
38 Manufacture of fabricated metal products, machinery and equipment
3688 20,9 2,5-50 19,9 27,28
39 Other manufacturing industries 565 35,1 2,5-50 18,2 1,40
Total 16676 33,4 0-339 24,7 100
Source: « Trade Policy Review : Kingdom of Morocco », WTO Secretariat calculations.
The number of unique ad-valorem tariff amounts to 34. A consolidation of tariffs and associated imports reveal that more than 28 percent of imports have ad-valorem tariffs that are less than 10 percent, and that relatively high tariffs (over 50 percent) apply to less than 1 percent of imports. Morocco grants preferential treatment for imports from countries that are members of regional or bilateral trade agreements to which it takes part, on a reciprocal basis. These are for example the United Maghreb Arab countries (UMA), the Arab Free-trade Area, the Association Agreement with the EU, the European Free-trade Agreement (EFTA), and bilateral free-trade agreements with countries in the region such as Egypt, Jordan and Tunisia. Morocco also grants such treatment under trade and tariff agreements and the Global System of Trade Preferences (GSTP). In addition, in order to stimulate exports, firms benefit from the “temporary admission regime” under which imports of inputs are exempted from any import duties. Almost 30 percent of Moroccan imports in 2000 entered under temporary admission regime. This is particularly the case of textile industry since 74 of its imports in 2000 took advantage of temporary entry for inward processing.
4. Preliminary analyses of survey data
4.1. Data coverage
This paper uses two firm level databases to examine the implications of trade and technology variables on employment in the manufacturing sector in Morocco. The first database is drawn from the yearly survey conducted by the Ministry of Trade and Industry. This survey covers all manufacturing firms with at least 10 employees or with an annual turnover that exceeds 100 000 DH4. It collects firm level data on a set of variables such as turnover, output, value added, exports, investment, gross labor cost, and the number of permanent and temporary employees. The second database is constructed using data from the Firm Analysis and Competitiveness Survey (FACS) carried out in 2000 by the Ministry of trade and industry, and the World Bank. This survey covers a representative sample of 859 firms in seven most important industries in Morocco5. It provides very detailed data on the skill composition of the manufacturing sector labor force, wages by skill level, technology and other related variables. The same identification code is used in both surveys, which makes it possible to merge the two databases in order to study employment variation over the nineties.
Table 3 presents the FACS sample by industry on the basis of firms’ number, employment, output and exports. The seven industries covered by FACS are: food industry, textiles, garment industry, leather industry, chemicals, plastics and electrical industry.
Table 3. FACS survey sample by industry, export orientation and foreign ownership
Industry Number of firms Share of firms Employment structure Output structure Export structure Food industry 83 9,7 5,0 18,8 11,7 Textiles 200 23,3 25,3 25,3 24,8 Garment industry 316 36,8 52,4 26,6 50,5 Leather industry 68 7,9 5,5 3,7 6,6 Chemical industry 77 9,0 4,8 14,5 4,2 Plastic industry 77 9,0 4,1 5,1 1,0 Electrical industry 38 4,4 2,9 6,1 1,2 Total 859 100 100 100 100
Note: Authors’ computation from FACS data
4
Currently, One dollar is roughly nine Moroccan Dirham (MAD). 5
We faced many constraints in having access to firm level data. For the purpose of this paper, we had access to 1990’s database of the annual manufacturing survey, and FACS survey database.
Roughly 56,5 percent of these firms serve partially or exclusively foreign markets. On average they export, more than 78 percent of their output with wide variations that range from 24,2 percent for plastic industry to 92,9 percent for garment industry. Around 15 percent of the firms are foreign-owned6. However, the average participation of foreign capital in these firms amounts to 60,8 percent.
Table 4. Export orientation and foreign-ownership in the Moroccan manufacturing firms % Exporters Share of exports % Foreign firms share of foreign capital Food industry 44,6 84,0 10,8 49,9 Textiles 58,0 69,9 16,5 69,3 Garment industry 74,7 92,2 16,5 61,0 Leather industry 70,6 76,6 5,9 58,7 Chemical industry 24,7 29,0 20,8 58,5 Plastic industry 18,2 24,2 6,5 56,4 Electrical industry 39,5 27,2 15,8 50,8 Total 56,5 78,3 14,6 60,8
Note: “% exporters” is the fraction of exporting firms in total manufacturing firms, “Share of exports” is the average share of sales sold on foreign market by exporting firms, “% foreign firms” is the fraction of firms with at least 10% of capital held by foreigners, “share of foreign capital” indicate the average share of foreign capital among foreign firms.
4.2. Skill composition of the manufacturing labor force
The FACS survey provides rich data on employment by skill level in the seven industries covered. On average, a typical Moroccan firm offers 123 jobs, among which 38,8 percent are directed to skilled workers, and 47,9 percent to unskilled workers. The share of high executives, and executives do not exceed 1,8 and 3,8 percent respectively. The share of non-production workers is estimated to 7,7 percent.
Table 5. Employment structure in the Moroccan manufacturing industries
Industry H.E. EXEC. SKL USKL NPW Average
Food industry 3,5 4,8 18,8 52,8 20,1 61 Textiles 1,6 3,3 40,5 48,6 6,0 128 Garment industry 1,2 3,5 44,3 44,6 6,3 178 Leather industry 2,3 2,2 26,6 63,9 5,0 88 Chemical industry 5,1 8,8 21,4 44,9 19,7 65 Plastic industry 3,2 4,6 22,9 59,2 10,1 46 Electrical industry 2,6 4,2 29,4 53,8 10,1 103 Average size 1,8 3,8 38,8 47,9 7,7 123
Note: Data in the table are provided for five occupational categories. H.E (high executives), EXEC. (Executives), SKL (Skilled workers), USKL (Unskilled workers) and NPW (Non-production workers). The last column indicates for each industry, the average number of employees per firm regardless of their occupational categories.
Average figures need to be taken cautiously since there is substantial heterogeneity in terms of size, as measured by the number of employees, between industries and within firms belonging to the same industry. FACS data reveal a higher size for firms in the garment industry, textiles and to a lesser extent leather industries with respectively 178, 128 and 88 employees. Higher size in these industries is mainly attributed to their relatively high labor intensity. Conversely, firms located in more capital intensive industries such as plastics, food, and chemicals tend to provide relatively fewer jobs, with respectively 46, 61 and 65 employees. The structure of employment by skill level tends also to differ among industries. Chemical industry appears to be better endowed with highly qualified human capital. The executive rate7 in chemicals is roughly 14 percent followed by food industry with an executive rate of 8,3.
Unexpectedly, electrical industry and plastics are characterized by low executive rates. Finally, textile, garment and leather industries, which are the most export oriented industries; lag behind with executive rates less than 5 percent. These figures are consistent with the production model prevalent in these industries and their position in the international value-chain. Most of the Moroccan units continue to rely intensively on subcontracting activities of relatively low-value added products. The share of skilled workers in total employment ranges from 18,8 percent in food industry to 44,3 percent in Garment industry.
Paradoxically, the share of unskilled workers seems to be higher in plastics and electrical industry than in the garment industry. One explanation might be found in the definitions used by the survey, which rely on a subjective classification of workers into skilled and unskilled workers by interviewed owners or managers. Looking at the data on the average number of years of education, it can be seen that the average unskilled production worker has not completed primary education. For more than 5 percent of the sample, unskilled workers are with no education. The proportion of firms with no employees with university level (at least 13 years of education) is extremely high. This is very striking given the level of unemployment rate among university graduates in Morocco.
Female employees appear to be well represented with 58 percent of the total manufacturing labor force, compared to 35 percent of rural labor force and 22,7 percent of urban labor for the same period8.
7
Executive rate is defined as the ratio of executives to the total number of employees. 8 Direction de la Statistique “Activité Emploi et chômage” (2000), Rabat, Morocco.
Table 6. Share of female employment in the manufacturing industries by skill level
Industry H.E. Exec. SKL USKL NPW Average
Food industry 11,2 15,2 9,9 39,7 24,3 29 Textiles 11,4 22 50,4 56 38 52 Garment industry 18,6 19,3 80 77,7 31,7 73 Leather industry 6,6 20,3 30,5 53,2 39,4 45 Chemical industry 19,5 23,1 10,7 23,9 29 22 Plastic industry 8,8 29,6 9,7 37,4 31,6 29 Electrical industry 20,4 32,9 27,5 12,5 34,5 20 Total 15,1 21,1 64,2 61,7 32,1 58
Note: Data in the table are provided for five occupational categories. H.E (high executives), Exec. (Executives), SKL (Skilled workers), USKL (Unskilled workers) and NPW (Non-production workers). The last column indicates for each industry, the average number of employees per firm regardless of their occupational categories.
Female presence is particularly high in labor intensive export-oriented industries such as garment, and textile industries with respectively 73 and 52 percent of female employees. Female participation rate tends to be weaker in electrical and chemical industries with no more than 22 percent in both cases. These average female participation rates dissimulate wide differences depending on the qualification level. There are only 15 percent of females among high executives, and 21 percent among executives. Conversely, they account for more than 60 percent among skilled and unskilled workers, and around one third among non-production workers. In general, women tend to be relegated to jobs that require little training and can tolerate high levels of job turnover.
4.3. Capital vintages and investment decision
Trade liberalization increases manufacturing firms’ exposure to foreign competition in both domestic and overseas markets. It usually requires an upgrading of their equipment, and an improvement of their technology. This section examines the quality of capital equipment in the manufacturing sector, and investigates the main determinants of their investment decisions. There are reasons to expect exporting firms to be more reactive in terms of renewing their equipment and upgrading their technologies compared to non-exporting firms.
Table 7. Capital vintages (% of machinery in year group) in exporting and non exporting firms
Non-exporting firms Exporting firms Industry New1 New2 Old1 Old2 New1 New2 Old1 Old2 Food industry 36,8 36,2 21,1 5,8 46,4 39,7 11,8 2,2 Textiles 17,9 35,0 34,1 13,0 38,5 34,5 21,2 5,7 Garment industry 37,2 36,6 22,4 3,9 42,7 41,7 13,6 2,0 Leather industry 20,5 25,0 36,4 18,0 27,9 35,2 34,1 2,8 Chemical industry 29,9 28,9 30,9 10,3 31,9 41,1 17,2 9,8 Plastic industry 21,3 31,9 37,9 8,9 40,7 25,6 27,3 6,4 Electrical industry 16,5 37,6 34,8 11,1 46,7 39,0 10,3 4,0 Total 26,8 33,6 30,4 9,2 40,2 38,6 17,8 3,5 Note: data are provided on the share of equipment in four age categories. Less than 5 years (New1), from 5 to 10 years (New2), from 10 to 20 years (Old1), and more than 20 years (Old2).
FACS data confirm this expectation since overall, 40,2 percent of equipment in exporting firms has less than 5 years compared to 26,8 percent in non-exporting firms. Conversely, the share of equipment with more than 10 years is estimated to 39,6 percent in domestic market-oriented firms against 21,3 percent in foreign market-oriented firms. However, the differences are not statistically significant in all sectors. While exporting firms in textile, leather, chemical, and electrical industries tend to invest significantly more in new equipment with respect to non-exporting firms; this is not the case in food industry and chemicals. Within exporting firms, three industries seem to be in advance in terms of renewing their machinery. These are electrical, food and garment industries. Leather industry and plastics appear to be lagging behind with respectively 36,9 and 33,7 percent of their equipment aged more than 10 years compared to 14 percent in food industry and 14,3 percent in electrical industry.
The decision to invest by Moroccan manufacturing firms is primarily motivated by the extension of production capacity, 68 percent of exporting firms and 60,4 percent of non-exporting firms put forward this motivation. The second reason is to improve quality of existing products; 51,4 percent of exporting firms and 36,9 percent on domestic market-oriented firms have raised this motivation. The proportion of firms that invest in order to introduce new products tend to be low with only 23,6 among exporting firms and less than 20 percent among those producing exclusively for domestic market. However, the ranking of these motivations is not uniform across industries. In the case of exporting firms, there is relatively more stress on quality considerations in investment decision in electrical industry and plastics, while product innovation is more strongly accounted for in electrical industry and chemicals.
4.4. Foreign trade patterns of manufacturing firms
Overall, 56,5 percent of the Moroccan manufacturing firms export partly or totally their output with substantial heterogeneity both among firms in the same industry and between industries. The garment industry stands as the main export-oriented industry with three-quarters of its firms selling on foreign markets. Conversely, firms in plastics and chemicals tend to be less frequently engaged in export activity.
There seems to be returns to scale in exporting activity. Exporting firms sell a large share of their output abroad. This is the case of garment sector (92,2 percent), food (84 percent), leather (76,6 percent) and textiles (69,9 percent). In the Electrical industry, chemicals and plastics exporting activity is seen only as a complement of selling in the domestic market.
Although exporting firms tend to be larger, they face various difficulties on foreign markets. Overall 34 percent of firms attribute their export under performance to their lack of price competitiveness, 17,4 percent of firms to the lower quality of their products compared to their competitors, 12,2 percent to tariff barriers imposed by importing countries. Exporters do not evenly feel these difficulties in different industries. In food sector, two reasons emerge as the main obstacles: price competitiveness and high tariff rates. In textiles, garment and leather industries the main difficulties appear to be price competitiveness and lower quality products with respect to competitors. The constraint of quality is even much more felt by exporters of leather products. This is consistent with the fact that leather industry is characterized by the highest share of unskilled workers in its total employment, and lag behind in terms of renewing its equipment and upgrading its technology.
Table 8. Main difficulties faced by exporting firms on foreign markets
Industry Price
competitiveness
High tariff rates Higher quality products Unfair competition Food industry 51,7 27,6 17,9 17,9 Textiles 30,7 12,3 14,3 10,8 Garment industry 32,6 10,7 17,4 9,6 Leather industry 46,8 10,6 33,3 6,5 Chemical industry 29,4 17,6 11,8 11,8 Plastic industry 14,3 0,0 7,1 7,1 Electrical industry 28,6 14,3 7,1 21,4 Average 34,0 12,2 17,4 10,5
Manufacturing firms import roughly half of their raw materials. Large firms import 70 percent of their inputs compared to 35 percent for small firms. This is particularly the case of textile and garment
Geographical proximity of Morocco from Europe, low integration of manufacturing sector in Morocco, and the existence of special importing customs’ regimes for exporters explain to a large extent the high reliance on imports of raw materials. It has to be noticed; however that food industry represents an exception. This industry transforms mainly local agricultural and sea products and depends relatively less on imported raw materials.
To sum up, these preliminary descriptive analyses offers interesting insights and helps in exploring the channels through which trade and technology are likely to affect employment. However, an econometric investigation is needed in order to assess the marginal impact of each one of the variables, and understand their interaction. This is purpose of the next section.
5. Econometric investigation
This section investigates the impact of trade variables on employment of skilled and unskilled labor in the manufacturing sector in Morocco. Other variables such as firm’s size, capital intensity, and equipment age to proxy for technology have been included into the model in order to capture the partial effect of trade liberalization. The econometric methodology is similar to that used in the estimation of labor demand functions in trade and labor literature.
5.1. Theoretical background of labor demand functions
A reduced form model of labor demand can be derived from a structural model by assuming a Cobb-Douglas production function of a representative firm that maximizes its profit by using skilled and unskilled labor and capital. A similar formulation has been already suggested by Milner and Wright (1998), and Greenaway et al. (1999).
Production function takes a simple Cobb-Douglas form: b a d w NS S
L
L
K
A
Q
=
(1)Where
Q
is output,A
is an index of technological progress that reflects technical efficiency of the production process,L
S andL
NS are respectively skilled and unskilled labor, and finallyK
is capital stock.Under the assumption of competitive markets, firms are price and wage takers. The first order condition implies that a profit-maximizing firm will use labor and capital such that the marginal revenue product of capital equals its user cost (
r
), and the marginal revenue product of skilled(unskilled) labor equals skilled (unskilled) wage. Using first order conditions and solving the system to get rid of capital and unskilled labor from the output expression yields the following equation:
b a d w
a
b
a
d
]
[
]
[
NS S S S S Sw
w
L
L
r
w
L
A
Q
=
(2)Where
w
Sandw
NS refer respectively to skilled and unskilled labor wages. The firm’s derived demand for skilled labor is obtained by taking logs and rearranging terms such that skilled labor is on the left-hand side of the equation:)
log(
)
log(
)
log(
log
log
0 1 2 3 4r
w
w
w
A
Q
L
S NS S S=
l
+
l
+
l
+
l
+
l
(3)In a symmetrical way, the firm’s derived demand for unskilled labor takes the following form:
)
log(
)
log(
)
log(
log
log
0 1 2 3 4r
w
w
w
A
Q
L
NS NS S NS=
f
+
f
+
f
+
f
+
f
(4)Theoretically, the demand for skilled labor is positively linked to output, and technological progress proxy. The coefficient of relative wages of skilled to unskilled labor in equation (3) is expected to be negative. The demand for unskilled labor is also posively linked to output but negatively linked to technological progress proxy. The rationale behind is that, for a given level of output, more technological progress reduces the need for unskilled workers. Finally, the coefficient of relative wage variable in euqtaion (4) is expected to be positive.
One problem with this formulation is that technology is assumed exogenous and has a similar and uniform impact on different industries. The exogeneity assumption is not consistent with growing empirical evidence revealing that international competition through trade leads to productivity growth and technological change. Therefore, there are reasons supported by empirical literature to expect that technological progress proxy (
A
) to be largely determined by trade patterns. Following Greenaway et al. (1999), it is assumed thatA
depends on the level of import penetration and export orientation. Higher openness to trade increases competition in import competing and export oriented industries and put pressure on firms to improve their productivity and reduce their inefficiency. This implies that A can be written as follows:r j q
)
(
)
(
IMP
EXO
e
A
=
X (5)where
IMP
is import penetration,EXO
is export orientation, and X represents a vector of non-trade related variables that affect firms’ efficiency.Substituting equation (5) into equation (3) yields the following skilled labor demand equation:
)
log(
)
log(
log
)
log(
)
log(
Unskilled labor demand equation can be obtained in a simalr manner by substituting equation (4) into equation (3).
)
log(
)
log(
log
)
log(
)
log(
log
0 1 2 1 3 4r
w
w
w
Q
EXO
IMP
X
L
S NS S NS=
f
+
z
+
h
+
h
+
f
+
f
+
f
(7)Equations (6) and (7) form the basis of the empirical estimation conducted in the rest of the paper.
5.2. Econometric results
Labor demand function specified in equation (6) and (7) are estimated using data provided by the FACS survey. As outlined earlier this survey collected detailed information on employment by occupational categories (skilled workers, unskilled workers, executives and non-production employees). These labor demand equations are estimated in levels across manufacturing firms.
Using data from annual manufacturing survey, average employment changes between 1990 and 1999 for a panel of 541 firms has been computed. The estimation of labor demand changes by occupational categories were not possible, as no detailed data was available from the annual manufacturing survey. Table 9 presents the list of variables used in the econometric analysis.
Table 9. List and description of dependent and independent variables
Variable Description
Dependant variables EMPTOT Total full employment workers SKL Number of killed workers USKL Number of unskilled workers
EXR Executive rate computed as the ratio of executives to total workers Independent variables
SHEXPO Share of exports in total sales SHIMPO Share of imported raw materials
PROTEC Protection rates are nominal rates at the 4-digit level
wus, ws, we Average gross wage of unskilled, skilled and executive labor
respectively computed using data on total gross wage and employment numbers.
KL ratio Capital labor ratio. Capital is computed as the net value of machinery and equipment used by the firm. Labor is taken as the total number of workers regardless of their occupational categories
SHNEQ Share of new machinery and equipment (less than five years of age) SHOEQ Share of old machinery and equipment (more than twenty years of
age)
SALE Total sales taken as proxy for output
D_SIZE (i) Size dummies i=1 for small size firms (less than 25 employees), i=2 for medium size firms (25 up to 199) and i=3 for large firms (with more than 200 employees). Small firms are taken as reference. D-sector(j) Sectoral dummies, with j=1,2,3,4,5,6 and 7. Clothing industry is taken
a. Trade liberalization, technology and employment change
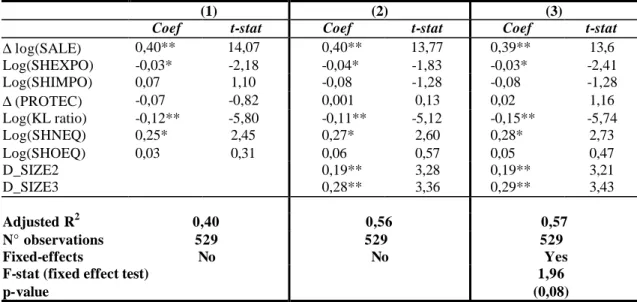
The purpose of this section is to investigate the impact of tariff dismantling on the job creation process in the manufacturing sector. Table 10 presents the results of regressing the change in (log) employment between 1990 and 1999 on the change in tariff protection rates and controlling for a set of openness and technology related variables. Three specifications are examined. The first specification neither accounts for size dummies, nor for industry-specific effects. The second specification control only for size dummies. Two size dummies are included (large and medium scale firm dummies, while small-scale firm is taken as reference). The last specification accounts for both size and sectoral dummies (six sectoral dummies are included and garment industry is taken as reference).
Data on sales and employment in 1990 are drawn form the annual manufacturing survey, while data on all other variables in 1999 are provided by FACS survey. Out of the 859 firms surveyed in 1999 541 firms can be traced in 1990’s database, and only 529 firms have the data needed to perform the econometric estimation. This shortcoming has to be taken into account in interpreting the results.
Size matters in understanding the process of job creation in the manufacturing sector in Morocco. Econometric estimates as presented in Table 10 indicate that the size effect is largely significant. Conversely, fixed-effect test of sectoral dummies appears non statistically significant at the conventional level. For these reasons, the focus is put on the second specification in discussing econometric results.
The results suggest that employment changes do not seem to be significantly driven by trade protection changes. To a large extent employment variation is explained by activity as measured by changes in firm’s turnover. Taken at their face value, our results indicate that one- percent change in total sales pushes up employment by 0,4 percent. However, this finding does not rule out the existence of an indirect impact of trade protection on sales. This hypothesis seems to be plausible as more open firms to foreign trade tend to create fewer jobs, compared to firms more strongly domestic market-oriented.
Our estimates show that both the share of exports in total sales and the share of imports of raw materials are negatively connected to changes in employment. However, only the former variable is statistically significant. These results may seem surprising since exporting firms may be expected to exert more dynamics in terms of job creation. However, it should be noticed that the impact on aggregate employment might dissimulate opposing effects between skilled and unskilled labor. To preserve their competitiveness on foreign markets, exporting firms may develop two alternative
unskilled labor, and hence not necessarily increasing their total employment. Second, exporting firms may also be engaged in upgrading equipment and relying on more capital intensive technologies. As expected capital intensity as measured by capital-labor ratio has exerted a negative effect on job creation in the manufacturing sector over the nineties. The estimated coefficient on capital-labor ratio is negative and statistically significant. Roughly, an increase in capital-labor ratio by 10 percent would lead, ceteris paribus, to an employment contraction of 1,1 percent.
Conversely the proportion of new equipment in total capital seems to positively affect the process of job creation. Firms with larger shares of new capital (less than 5 years of age) have created relatively more jobs over the nineties. The impact of new equipment share, which can be viewed as a proxy for investment dynamics and technology upgrading, appears to be robust across different econometric specifications presented in Table 10. The proportion of old equipment in total capital (more than 20 years of age) does not contribute significantly in explaining employment variation.
Regarding size, econometric estimates as presented in Table 10 indicate that the size effect is largely significant. A large body of economic literature has focused on the determinants of firm size, and shows that this is not a minor issue. Recently, Kumar, Rajan and Zingales (2001) find that two thirds of industrial output growth over the eighties in a sample of 43 countries comes from the growth in the size of existing firms, and only the remaining one third from the creation of new ones. They conclude that constraints to extending firm size represent potential constraints to economic growth. Regarding the case of Morocco, Harabi (2003) investigated the major forces behind the growth process of Moroccan firms on the basis of a cross-section of 370 firms. He found firm size to be negatively related to its growth as measured by the change in its turnover.
Table 10. Dependant variable ∆∆ Log(EMPTOT)
(1) (2) (3)
Coef t-stat Coef t-stat Coef t-stat
∆ log(SALE) 0,40** 14,07 0,40** 13,77 0,39** 13,6 Log(SHEXPO) -0,03* -2,18 -0,04* -1,83 -0,03* -2,41 Log(SHIMPO) 0,07 1,10 -0,08 -1,28 -0,08 -1,28 ∆ (PROTEC) -0,07 -0,82 0,001 0,13 0,02 1,16 Log(KL ratio) -0,12** -5,80 -0,11** -5,12 -0,15** -5,74 Log(SHNEQ) 0,25* 2,45 0,27* 2,60 0,28* 2,73 Log(SHOEQ) 0,03 0,31 0,06 0,57 0,05 0,47 D_SIZE2 0,19** 3,28 0,19** 3,21 D_SIZE3 0,28** 3,36 0,29** 3,43 Adjusted R2 0,40 0,56 0,57 N° observations 529 529 529 Fixed-effects No No Yes
F-stat (fixed effect test) p-value
1,96 (0,08)
Note: The stars indicate the level of statistical significance of the coefficients. **=1 percent, *=5 percent. The first specification does not account for any dummies., the second accounts for size dummies, and the third accounts for both size and sectoral dummies.
To sum up, it appears that in accounting for the manufacturing sector employment changes, it is technology (capital intensity, share of new capital) that matters more than trade. These finding is very important in terms of their policy implications. First, trade protection does not appear to be an effective tool in terms of saving jobs. Moroccan commitment to further liberalize its trade means that industrial sector will have to face more competitive pressure on both domestic and foreign markets in the near future. Second, employment can be stimulated through investment in technology. Those firms that are endowed with up to date technology are more likely to maintain and increase their market shares, and hence create more jobs. The challenge for policy-makers is to design appropriate support policies that stimulate firms to invest and upgrade technologies, and at same time create a business environment attractive for foreign investment.
b. Skilled labor demand, trade patterns, relative labor cost and technology
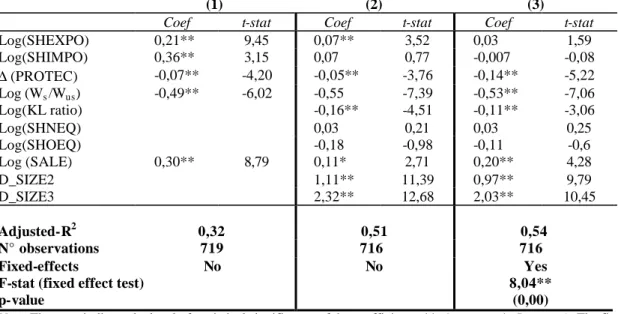
This section investigates the impact of trade, technology and labor cost on skilled labor employment on the basis of FACS survey data. The dependant variable is measured by the logarithm of skilled workers as drawn from the survey. Three different specifications are successively examined. Their general form derive directly from the theoretical model presented earlier. In addition to the three usual trade variables (share of exports in total sales, share of raw material imported, and protection rate variation), the first specification accounts for labor cost through the relative wage of skilled to unskilled workers, and the value of sales as an indicator of the level of firm’s activity. All variables expect protection rate variation are taken in logs.
Table 11. Dependant variable Log(SKL)
(1) (2) (3)
Coef t-stat Coef t-stat Coef t-stat
Log(SHEXPO) 0,21** 9,45 0,07** 3,52 0,03 1,59 Log(SHIMPO) 0,36** 3,15 0,07 0,77 -0,007 -0,08 ∆ (PROTEC) -0,07** -4,20 -0,05** -3,76 -0,14** -5,22 Log (Ws/Wus) -0,49** -6,02 -0,55 -7,39 -0,53** -7,06 Log(KL ratio) -0,16** -4,51 -0,11** -3,06 Log(SHNEQ) 0,03 0,21 0,03 0,25 Log(SHOEQ) -0,18 -0,98 -0,11 -0,6 Log (SALE) 0,30** 8,79 0,11* 2,71 0,20** 4,28 D_SIZE2 1,11** 11,39 0,97** 9,79 D_SIZE3 2,32** 12,68 2,03** 10,45 Adjusted-R2 0,32 0,51 0,54 N° observations 719 716 716 Fixed-effects No No Yes
F-stat (fixed effect test) p-value
8,04** (0,00)
Note: The stars indicate the level of statistical significance of the coefficients. **=1 percent, *=5 percent). The first specification does not account for any dummies., the second accounts for size dummies, and the third accounts for both size and sectoral dummies.
The second specification adds three technology related-variables (capital-labor ratio, share of new equipment and share of old equipment) and two size dummies (small firms are taken as reference). The third specification extends the second by adding six sectoral dummies (garment industry is taken as reference). The results are presented in Table 11.
The results of the first specification indicate that the three trade variables are statistically significant with the expected sign. The share of exports in total sales and the share of raw materials imported are positively associated with skilled labor employment. This result indicates that, other things being equal, openness to foreign trade induces a significant skill composition effect in favor of skilled labor. This finding is further confirmed by the negative and significant coefficient on protection change. According to this result, any reduction in protection rate would have a stimulating effect on the process of creating jobs for skilled workers.
The results of the first specification are not quite robust to the inclusion of size and sectoral dummies into the regression except for trade protection changes. Although the coefficient of the share of exports in total sales continue to be significant in the second specification, the magnitude of its elasticity with respect to skilled labor employment falls dramatically from 0,21 to 0,07. To a large extent, this result is due to the positive association between size and the propensity to export. Once size dummies are introduced, the remaining effect of export orientation on skilled labor employment tends to shrink. Moreover, once sectoral dummies are accounted for, which is statistically relevant as shown by fixed effect test, both export orientation and import penetration of raw materials loose their statistical significance. Interestingly, trade protection emerges as a strong explanatory variable of skilled labor employment. There seems to be a high connection between tariff dismantling and job provision for skilled workers in the manufacturing industries in Morocco. This finding contrasts with a strict interpretation of the theoretical expectation based on a standard HO model, according which the demand for skilled labor would fall in an unskilled-labor intensive country as a consequence of trade liberalization.
Labor cost variable, as measured by the relative wage of skilled to unskilled labor contribute significantly in explaining the observed variability of skilled labor employment across firms. As theory predicts, there is a negative and significant relationship between relative wages and skilled-job creation. The magnitude of the estimated elasticity appears to be high and fairly robust. It reveals that an increase by 10 percent of the relative wage of skilled to unskilled workers would reduce employment of skilled workers by more than 5 percent. This relatively high sensitivity of skilled labor employment to relative wages is consistent with the dominance of low value added products in the Moroccan manufacturing industries for which labor cost largely matters.
Surprisingly, capital intensity as measured by capital labor ratio seems to exert a negative effect on skilled labor employment. The estimated elasticity of capital intensity with respect to skilled labor is negative and statistically significant. It is estimated to (-0,11) as shown in Table 11, meaning that an increase of capital-labor ratio by 10 percent would lead to the destruction of 1,1 percent of skilled jobs. This finding is inconsistent with the conventional wisdom that would suggest that skill-intensity and capital-intensity move together. In other words, this result is not compatible with the existence of some complementarity between capital and skilled labor. However, this inconsistency may be driven by the quality of data used to measure capital. Firms with new machinery would appear more capital intensive although this may not be really the case. To account for the quality of physical capital in the manufacturing firms, the share of new equipment (less than 5 years of age) and the share of old equipment (more than 20 years) have been included into in the second and the third specifications. Unfortunately, in both cases theses two variables did not show any statistical significance.
The estimated elasticity associated with total sales is positive and statistically significant even when size and sectoral dummies are included in the regression. The magnitude of the elasticity is estimated to 0,20. Finally, to account for the impact of ownership structure on skilled employment, the share of foreign and state capital were introduced into the econometric specification. The results are not reported because both variables did not show any significant effect on skilled employment.
c. Trade liberalization, relative wages, technology and unskilled labor
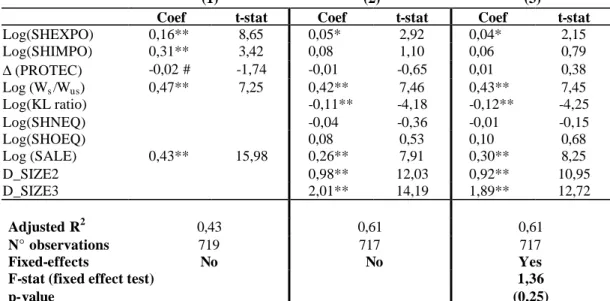
Using the same methodology, this section focuses on the effects of trade, technology and labor cost on the size of unskilled labor employment as measured by the logarithm of unskilled workers drawn from the FACS survey.
The first specification shows that unskilled labor is positively associated with export orientation, and import-dependence of the manufacturing firms. Tariff reduction exerts a positive effect on unskilled labor employment, although significant only at 10 percent. The magnitude of the elasticities indicates that an increase by 10 percent in the share of imported raw materials would have a stimulating effect of 3,1 percent on unskilled employment. Similarly, an increase of 10 percent in the share of sales on foreign markets would boost unskilled employment by 1,6 percent. These findings reveal that all being equal; the impact of imports on unskilled labor is stronger than that of exports. The same result has been detected previously in the case of skilled labor with an elasticity of 0,21 for export orientation and 0,36 for import–dependence. To a large extent, manufacturing industries in Morocco are largely involved in subcontracting activities for firms located overseas. They are supplied with raw materials, and instructions on the output to deliver. This is largely the case of the garment sector and to a lesser
firms are selected mainly for their cheaper labor cost, it is not surprising to end up with a strong connection between the share of imported raw materials and the demand for unskilled labor.
These findings, although promising, are not robust to the inclusion of size and sectoral dummies. However, fixed effect test fails to show any statistical significance and hence we focus our discussion on the second specification, which does not account for sectoral dummies.
On the basis of the second specification in Table 12, the share of sales on foreign markets continue to be significant but with a lower elasticity of roughly 0,05. As expected, the relative wage of skilled to unskilled labor has a positive and significant coefficient. The estimated elasticity associated with relative wage appears to be statistically robust. It reveals that as skilled labor becomes expensive compared to unskilled labor, firms tend to offer more jobs for the latter category at the expense of the former. Roughly, an increase of relative wages by 10 percent is expected to induce a 4 percent extra employment among unskilled workers.
The estimated coefficient on capital intensity is negative and statistically significant. This result lends support to the intuitive expectation according to which an increase in capital-labor ratio is usually done at the expense of unskilled labor. The rationale behind this intuition is as follows. Under competitive pressure generated by trade liberalization, manufacturing industries are expected to upgrade their equipment and machinery, which decreases their demand for unskilled labor in favor more capital intensive production technologies. Curiously, the magnitude of elasticity associated with capital intensity is roughly similar for both skilled and unskilled labor.
Table 12. Dependant variable Log(USKL)
(1) (2) (3)
Coef t-stat Coef t-stat Coef t-stat Log(SHEXPO) 0,16** 8,65 0,05* 2,92 0,04* 2,15 Log(SHIMPO) 0,31** 3,42 0,08 1,10 0,06 0,79 ∆ (PROTEC) -0,02 # -1,74 -0,01 -0,65 0,01 0,38 Log (Ws/Wus) 0,47** 7,25 0,42** 7,46 0,43** 7,45 Log(KL ratio) -0,11** -4,18 -0,12** -4,25 Log(SHNEQ) -0,04 -0,36 -0,01 -0,15 Log(SHOEQ) 0,08 0,53 0,10 0,68 Log (SALE) 0,43** 15,98 0,26** 7,91 0,30** 8,25 D_SIZE2 0,98** 12,03 0,92** 10,95 D_SIZE3 2,01** 14,19 1,89** 12,72 Adjusted R2 0,43 0,61 0,61 N° observations 719 717 717 Fixed-effects No No Yes
F-stat (fixed effect test) p-value
1,36 (0,25)
Note: The stars indicate the level of statistical significance of the coefficients. ** =1 percent, *=5 percent, and #.(10 percent). The first specification does not account any dummies., the second accounts for size dummies, and the third accounts for both size and sectoral dummies.
Regarding the value of sales, its effect is positive and highly significant. The elasticity of unskilled labor demand with respect to sales is estimated to 0,26 which is greater than the same elasticity for skilled labor estimated to 0,20. This comparison indicates that labor demand sensitivity with respect to activity is higher for unskilled labor compared to skilled labor.
d. Trade liberalization, relative wages, technology and executive rate
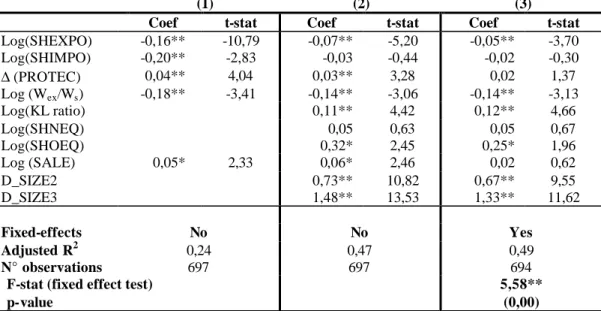
The aim of this section is to understand the determinants of the executive rate in the manufacturing sector in Morocco. The executive rate is defined as the ratio of high and medium executives to the total labor force. Executives may be involved either in administrative or technical tasks. Preliminary descriptive analysis has shown that executive rates are higher in chemical and food industries, medium in electrical industry and plastics, and extremely low in textile, garment, and leather industries. However, trade, technology, and relative cost variables may affect these sectoral differences. An econometric analysis is needed in order to assess the marginal contribution of different variables in explaining the level of the executive rate observed in the manufacturing firms in Morocco. Similarly, three specifications are investigated.
The relative wage of executives to skilled labor appears to be one of the key determinants of the observed level of executive rate. As might be expected, an increase of executive wages compared to skilled workers of 10 percent would roughly lead 1,4 percent reduction in the level of executive rate. This result is fairly robust across different specifications. The second key variable seems to be capital intensity. Its positive coefficient implies that there is some complementarity between skill intensity and the demand for executives. It is worth nothing that those firms with larger share of old capital equipment tend also to have higher executive rates.
The results reveal that the dismantling of trade barriers is negatively associated with the level of executive rate. In other words, ceteris paribus, executive rates tend to be higher in less liberalized industries and vice-versa. The magnitude of the elasticity is estimated to roughly 0,04, which means that a 10 percent reduction of trade tariffs would decrease the executive rate by 0,4 percent. This finding is consistent with the data on tariff reduction over the nineties, which indicate that the average annual change of protection was relatively low in chemicals and food industry with (-2,92) and (-2,34) percent respectively, and relatively high in textile, garment and leather industries with (-8,7) percent, (-4,70) and (-3,17) percent respectively. The positive relationship between trade protection and the executive rate is further confirmed when looking at the elasticities of export orientation and import-dependence ratios at least on the basis of the first specification. However, fixed effect test shows the relevance of accounting for sectoral dummies. Once, size and sectoral dummies are included in the
regression equation, only the share of sales on foreign markets preserve its negative and significant sign but with a lower elasticity in absolute terms compared to the first specification.
Table 13. Dependant variable log(EXR)
(1) (2) (3)
Coef t-stat Coef t-stat Coef t-stat Log(SHEXPO) -0,16** -10,79 -0,07** -5,20 -0,05** -3,70 Log(SHIMPO) -0,20** -2,83 -0,03 -0,44 -0,02 -0,30 ∆ (PROTEC) 0,04** 4,04 0,03** 3,28 0,02 1,37 Log (Wex/Ws) -0,18** -3,41 -0,14** -3,06 -0,14** -3,13 Log(KL ratio) 0,11** 4,42 0,12** 4,66 Log(SHNEQ) 0,05 0,63 0,05 0,67 Log(SHOEQ) 0,32* 2,45 0,25* 1,96 Log (SALE) 0,05* 2,33 0,06* 2,46 0,02 0,62 D_SIZE2 0,73** 10,82 0,67** 9,55 D_SIZE3 1,48** 13,53 1,33** 11,62 Fixed-effects No No Yes Adjusted R2 0,24 0,47 0,49 N° observations 697 697 694
F-stat (fixed effect test) p-value
5,58** (0,00)
Note: The stars indicate the level of statistical significance of the coefficients. ** =1 percent, *=5 percent. The first specification does not account any dummies., the second accounts for size dummies, and the third accounts for both size and sectoral dummies.
One plausible explanation of these unexpected results emerges when looking at the share of state ownership in manufacturing firms at the beginning of the nineties. State ownership was highly prevalent in chemical and food industries with respectively 59 and 27 percent of total capital. These industries have been more protected and relatively less open to import competition compared to other industries. Conversely, state ownership was by far less common in the garment and leather industries with respectively 1,9 and 0,57 percent of their total capital in 1990. Public owned firms tend to be larger, more capital intensive, and highly endowed with executives compared to private firms. Due to the process of privatization of manufacturing firms in which Moroccan authorities have embarked since early nineties, a large share of these state companies has been transferred to large private capital. Hence, it is not surprising to discover that high executive rates continue to be found in less liberalized industries.
6. Conclusions and policy implications
Morocco is a country which succeeded to a large extent in implementing the stabilisation policies (low inflation rate, budget deficit relatively under control, and declining debt burden), yet Morocco is a case of low and highly volatile economic growth. The Moroccan government has attempted to promote private sector development through a gradual process of trade liberalization, and a vast program of privatization of state-owned enterprises. A new legal and regulatory framework have taken place in the financial sector to promote financial intermediation and make more funds available to SMEs.