Available at http://journal.uii.ac.id/index.php/jep
EJEM
Econ. J. Emerg. Mark.
The impact of crime on foreign direct investment
Muhammad Mukhlis Afriyanto
Postgraduate Program in Economics, Universitas Indonesia, Jakarta, Indonesia.
E-mail:mukhlis.afriyanto@gmail.com Article Info Article history: Received : 21 March 2017 Accepted : 13 August 2017 Published : 1 October 2017 Keywords:
foreign direct investment, crime, panel data, fraud.
JEL Classification: E2, D92, E2 DOI:
10.20885/ejem.vol9.iss2.art8
Abstract
This study examines the impact of crime incidence on Foreign Direct Investment (FDI) in Indonesian provinces. This study uses panel data covering 31 provinces for the pe-riod 2005 to 2015. We involve Total Crime, Property Crime, Violence, Vandalism, Arson, Fraud, Homicides and Kidnapping as variable of crime. The results show that crime variables have significant impact on FDI. We find that for every increase in total crime incidence per 100,000 people by ten percent, FDI is expected to decrease by approximately 0.95 percent. The results of this study suggest that besides boosting economic growth, stimulating infrastructure development, and lowering the provincial minimum wages, government needs to pay attention to crime incidence in each prov-ince. Government should allocate adequate resources to minimize the crime rate.
Abstrak
Studi ini mengkaji dampak kejadian kejahatan terhadap investasi asing (FDI) di pro-vinsi-provinsi di Indonesia. Penelitian ini menggunakan data panel dari 31 provinsi yang mencakup periode 2005 sampai 2015. Kami melibatkan Total Crime, Property Crime, Violence, Vandalism, Arson, Fraud, Homicides and Kidnappingsebagai varia-bel kejahatan. Hasilnya menunjukkan bahwa variavaria-bel kejahatan berpengaruh signifi-kan terhadap FDI. Kami menemusignifi-kan bahwa untuk setiap peningkatan jumlah kejadian kejahatan per 100.000 orang hingga sepuluh persen, FDI diperkirakan akan turun sekitar 0,95 persen. Hasil penelitian ini menunjukkan bahwa selain mendorong per-tumbuhan ekonomi, merangsang pembangunan infrastruktur, dan menurunkan upah minimum provinsi, pemerintah perlu memperhatikan insiden kejahatan di setiap pro-vinsi. Pemerintah harus mengalokasikan sumber daya yang memadai untuk memini-malkan tingkat kejahatan.
Introduction
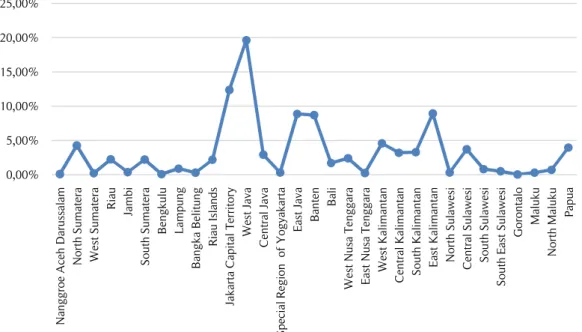
The implementation of FDI in various regions in Indonesia is still facing difficulties. The approval FDI at the regional level is still unevenly distributed and it is mainly concentrated in specific provinces. By the end of 2015, provinces in Java Island dominated FDI acceptance at an around 55% of total FDI, and only 45% of it was received outside Java Island. As shown in Figure 1, West Java province received 19.60% of FDI, followed by Jakarta Capital Territory (12.36%), East Kalimantan (8.92%), East Java (8.86%), Banten (8.68%), leaving other provinces receiving only 1% to 3%.
A good investment climate is one of the essential factors needed to attract investors. We could as-sume that the internal situation in Indonesia is one of the considerations for investment decisions in Indo-nesia. Mukherjee, Wang, & Tsai, (2012) mentioned that some factors may affect the investment climates, namely the political stability, macro-economic situation, corruption, the easiness to get credit, crime rate, government regulation, law supremacy, infrastructures, labor regulation and telecommunication.
Security issues, like crime within the destination country, are an important consideration for inves-tors. Generally, crime affects investment negatively through two main channels: direct channels and indi-rect channels as studied by Dadzie, Blanco, & Dony (2014). The diindi-rect impact of crime on investment is delivered through the cost of setting up a business. Indirect channels are carried by complementary factors related to human, social and institutional factors. A high level of crime, especially violence, causes damage or loss of property and infrastructure and creates insecurity resulting in investors’ spending for additional security guards and equipment.
Source: Indonesia Investment Coordinating Board (2015)
Figure 1.FDI per‐province in Indonesia (2015)
There has been little research specifically studying the relationship between FDI and criminal ac-tivities in Indonesia. Moreover, most of the studies on FDI in Indonesia tend to focus on national level ana-lyses rather than disaggregating the analysis to the regional level. Some studies have confirmed that crime hinders investment in several countries. Brock (1998) finds that relatively higher FDI is attracted to the regions of Russia where the level of crime is lower. Another study by Madrazo-Rojas (2009) finds that violent organized crime has a negative impact on FDI in Mexican states. Lastly, Daniele & Marani, 2011, find a negative association between organized crime and FDI in Italian provinces. More recently, Albanese & Marinelli, 2013 find that in Italy, criminal acts significantly weaken productivity. According to their study, crime decreases FDI. Regions with lower crime rates tend to have higher productivity than areas with a high crime incidence. Therefore, a high crime rate could be considered as an additional risk or additional cost impairing an investor’s decision to invest money.
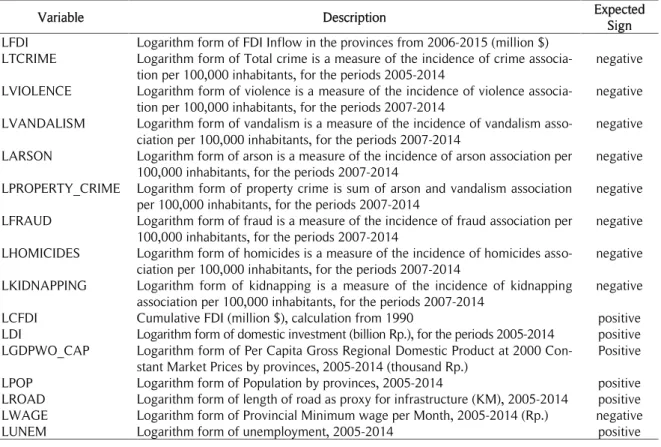
Research Method Data and variables
Due to data availability in Indonesia, there was difficulty in obtaining all the variables mentioned in pre-vious studies. To circumnavigate this difficulty, this study attempts to answer the research questions listed in Chapter I, by optimizing the use of the available data from various relevant sources. This study uses provincial level data from 31 provinces in the years 2005 to 2015.
The dependent variable in this study is the FDI inflow received by the provinces of Indonesia. Da-ta was obDa-tained from the Indonesia Investment Coordinating Board (IICB) for the years 2006-2015. To avoid potential bias and to capture the real condition of investment in Indonesia, the FDI realization is used as the proxy. Additionally, this study employs cumulative FDI due to a strong correlation between FDI in-flow and cumulative FDI. Related to fact that investors tend to invest in the regions with a high industrial concentration, this study uses the cumulative FDI (in US million dollars) as the proxy for industrial concen-tration. However, due to data availability, this variable is represented by the data from year 1990. This va-riable is expected to be positively significant to FDI inflow in Indonesian provinces. On the other hand, the independent variables in this study, as the determinants of FDI inflows are obtained from the (Statistics-Indonesia, 2006).
This study employs both the total crime rate and detailed or specific crime rate as the proxy of crime variables. Total crime is the sum of criminal activities in general on every 100,000 people in one year. Meanwhile, specific crime categories crime activities into arson, vandalism, theft, violence and
kid-0,00% 5,00% 10,00% 15,00% 20,00% 25,00% N ang g ro e A ce h D ar ussa la m N o rth S um ate ra We st S um ate ra R ia u Ja m bi S o uth S um ate ra B eng k ulu L am pung B ang k a B elitung R ia u Isla nds Ja k ar ta C apita l T er rito ry We st Ja va C entr al Ja va S pe cia l R eg io n o f Y o g ya k ar ta E ast Ja va B ante n B ali We st N usa T eng g ar a E ast N usa T eng g ar a We st K alim anta n C entr al K alim anta n S o uth K alim anta n E ast K alim anta n N o rth S ula we si C entr al S ula we si S o uth S ula we si S o uth E ast S ula we si G o ro nta lo M aluk u N o rth M aluk u P apua
napping per 100,000 people in one year. Data was obtained from 2007 to 2014 periods. In a highly inse-cure environment, individuals, firms, and governments must suffer significant security costs, making fewer resources available for investment. Thus, the crime rate could be considered as an additional risk or addi-tional cost for doing business so it is expected to have negative nexus in determining FDI inflow
In terms of business related information, domestic investors tend to have wider access to informa-tion compared to foreign investors. In other words, there is asymmetric informainforma-tion. Therefore, in many cases, domestic investment could be used as the signaling indicator about the internal economic situation in the investment destination regions. Considering that assumption, it was expected that domestic invest-ment has a positive effect in determining the FDI inflow. In this study, data of this variable, domestic in-vestment (billion Rupiah) was obtained from, the Indonesia Inin-vestment Coordinating Board (IICB) in the years 2005-2014.
As discussed in Chapter II, several previous studies claimed that market size determines FDI in-flow. Market size indicates the volume of the local market as well as consumer’s purchasing power on that region. From the producer point of view, a large market size is crucial in maintaining the lower cost of production through a lower utility cost by producing and selling products at a larger scale. Therefore, mar-ket size is expected to have a positive correlation with FDI inflow in each region. In this study, the indica-tor of market size is represented by total population residing in each province and also provincial GDP per capita (in thousand Rupiah) in the period 2005-2014
Reliable infrastructure is crucial in supporting production activities. For instance, companies need roads to transport materials as production inputs. In this study, roads are used as proxies for infrastructure. ROAD measures the length of roads in a province (in kilometers) in the period 2005-2014, is expected to have a positive relationship with FDI inflow.
Unemployment rate indicates the availability of labor. An adequate labor supply improves the flexibility of companies to select and hire workers that suit their needs. However, a high labor supply in a region tends to relatively lower the regional minimum wage. Therefore, the variable of unemployment, using unemployment rate during period 2005-2014, was expected to have positive nexus in determining the FDI inflow. Moreover, wages are expected to have a negative effect on FDI inflows. A low wage tends to attract more investors since it potentially lowers the production costs. In this study, WAGE is provincial minimum wage per month in Rupiah during 2005-2014.
Empirical analysis
One of the objectives of this study is to examine the factors that determine FDI inflow at the provincial level in Indonesia. By employing panel data analysis, the economics model of this study is specified as the following:
(
, )
FDI
=
f Crime X
(1)where dependent variable is realization of FDI inflow in the provinces and X is a set of control variables and Crime is a measure of crime incidence. FDI decisions are likely to be based on information from the previous year, so all the independent variables on the assumption are lagged by one year. The basic equa-tion takes the following form:
, 1 , 1 2 , 1 3 , 1 4 , 1 5 , 1 6 , 1 7 , 1 8 , 1 9 , 1 , ln ln ln ln ln ln + ln ln ln lnWAGE i t i t i t i t i t i t i t i t i t i t i t
FDI Crime CFDI DI GDP
POP ROAD PORT UNEM
v
(2)whereirepresents 31 provinces in Indonesia, ttime in years from 2006-2015. This study analyzes using a natural logarithm form for all variables that are consistent with previous studies with some changes. CFDI proxies the cumulative FDI;DIrefers to domestic investment;GDPrepresents provincial GDP per capita; POPproxies the number of residents;ROADrefers to the length of road infrastructure;UNEMproxies the availability of labor;Wageis provincial minimum wage per month.
In estimating the model, Pooled-Least Squared method was used, followed by Fixed Effect and Random Effect Models. To choose the most appropriate estimator, Hausman test, F-tets and Breush-Pagan
test were used. Considering that in this panel data analysis, the data consists of cross section data with different data size and different variances, the Wald Test and Breusch-Pagan/Cook-Weisberg test are used to check for the existence of heteroscedasticity problem. The estimation results are analyzed derived in the next chapter.
Table 1.Data description
Variable Description Expected
Sign
LFDI Logarithm form of FDI Inflow in the provinces from 2006-2015 (million $) LTCRIME Logarithm form of Total crime is a measure of the incidence of crime
associa-tion per 100,000 inhabitants, for the periods 2005-2014
negative
LVIOLENCE Logarithm form of violence is a measure of the incidence of violence associa-tion per 100,000 inhabitants, for the periods 2007-2014
negative LVANDALISM Logarithm form of vandalism is a measure of the incidence of vandalism
asso-ciation per 100,000 inhabitants, for the periods 2007-2014
negative
LARSON Logarithm form of arson is a measure of the incidence of arson association per 100,000 inhabitants, for the periods 2007-2014
negative LPROPERTY_CRIME Logarithm form of property crime is sum of arson and vandalism association
per 100,000 inhabitants, for the periods 2007-2014
negative LFRAUD Logarithm form of fraud is a measure of the incidence of fraud association per
100,000 inhabitants, for the periods 2007-2014
negative
LHOMICIDES Logarithm form of homicides is a measure of the incidence of homicides asso-ciation per 100,000 inhabitants, for the periods 2007-2014
negative LKIDNAPPING Logarithm form of kidnapping is a measure of the incidence of kidnapping
association per 100,000 inhabitants, for the periods 2007-2014
negative
LCFDI Cumulative FDI (million $), calculation from 1990 positive
LDI Logarithm form of domestic investment (billion Rp.), for the periods 2005-2014 positive LGDPWO_CAP Logarithm form of Per Capita Gross Regional Domestic Product at 2000
Con-stant Market Prices by provinces, 2005-2014 (thousand Rp.)
Positive
LPOP Logarithm form of Population by provinces, 2005-2014 positive
LROAD Logarithm form of length of road as proxy for infrastructure (KM), 2005-2014 positive LWAGE Logarithm form of Provincial Minimum wage per Month, 2005-2014 (Rp.) negative
LUNEM Logarithm form of unemployment, 2005-2014 positive
Results and Discussion
Table 2 displays the descriptive statistics of each variable. All the variables are in natural logarithm form, where the independent variables are lagged by one year. The data employed in this study is annual data. Currently, Indonesia consists of 34 provinces; however, due to data availability this study will use the data from 31 provinces in Indonesia during 2005 – 2015. The sampled provinces, along with the data of total crime incidence and FDI acceptance for each province are listed in Table 2.
As stated in the previous chapter, our sample is categorized into three groups: Outside Java and Bali Island; Java and Bali Island; and Full Sample. The sample size in each group varies. In the Outside Java and Bali Island group, sample size ranges from 176 to 220, the sample size ranges from 72 to 90 in the Java and Bali group, and the sample size ranges from 248 to 310 in the Full Sample group. FDI Inflow, Total Crime, Cumulative FDI, Domestic Investment, GDP per Capita, Population, Road, and Wage va-riables have a maximum sample size of 310. The sample size variation is due to the study period which also varies. FDI Inflow, Total Crime, Cumulative FDI, GDP per Capita, Population, Road, Unemployment and Wage variables are taken from the years 2005-2015; however, the remaining variables are sourced from 2007 to 2014 data.
Table 3 shows Descriptive Statistics of all variables that used in this study and with the Table 4. we can see the natural logarithm form of those Variables. The FDI Inflow variable has a mean value of 4.126 with a maximum value of 9.203 and a minimum value of -6.908. The largest total FDI inflow for a decade (2006 – 2015) was contributed by DKI Jakarta province, followed by West Java and Banten in the amounts of $47,679 million, $36,599 million, and $17,835 million, respectively. However, Gorontalo prov-ince and East Nusa Tenggara provprov-ince received the lowest FDI inflow at $85.36 million and $121.358 mil-lion respectively. For the Crime variable, Total Crime scored 5.051 with a minimum value of 2.565 and a maximum value of 6.323. The lowest mean of the Crime variable is for the Kidnapping variable, with a
minimum value of -9.210 and a maximum value of 1.293. North Sulawesi and Gorontalo province, ranked as the region with the highest crime rate in the decade with crime incidence of 4068 and 3411 crimes for every 100,000 people respectively.
Table 2.Descriptive statistics 1
Variables Outside Java and Bali Island Java and Bali Island Full sample N Mean Std. Dev. N Mean Std. Dev. N Mean Std. Dev. Dependent variable FDI 220 276.8 448.7 90 1,420 1,987 310 608.7 1,245 Independent variable Crime variable Total Crime 220 206.6 97.51 90 137.1 91.54 310 186.5 100.8 Property Crime 176 6.987 6.032 72 2.972 2.881 248 5.821 5.612 Violence 176 26.79 19.26 72 13.52 14.05 248 22.94 18.87 Vandalism 176 6.465 5.883 72 2.789 2.673 248 5.397 5.419 Arson 176 0.522 0.575 72 0.200 0.183 248 0.424 0.528 Fraud 176 15.222 10.442 72 16.57 21.23 248 15.614 14.396 Homicides 176 1.153 0.935 72 0.455 0.334 248 0.950 0.867 Kidnapping 176 0.325 0.549 72 0.230 0.264 248 0.298 0.485 Control variable Cumulative FDI 220 1,349 1,830 90 12,251 15,598 310 4,514 9,850 Domestic Investment 220 1,233 2,195 90 4,270 6,820 310 2,115 4,327 GDP per Capita 220 9,004 6,895 90 10,157 11,241 310 9,339 8,389
Population 220 3.973e+06 2.963e+06 90 1.659e+07 1.533e+07 310 7.636e+06 1.033e+07
Road 220 14,534 9,343 90 16,366 12,315 310 15,066 10,308
Wage 220 949,388 347,469 90 798,895 349,475 310 905,697 354,158
Unemployment 220 6.961 2.707 90 7.363 3.882 310 7.078 3.093
Number of region 22 9 31
Table 3.Descriptive statistics 2
Variables Outside Java and Bali Island Java and Bali Island Full sample N Mean Std. Dev. N Mean Std. Dev. N Mean Std. Dev. Dependent variable FDI 220 3.521 3.536 90 5.604 2.509 310 4.126 3.402 Independent variable Crime variable Total Crime 220 5.199 0.565 90 4.691 0.722 310 5.051 0.655 Property Crime 176 1.207 2.140 72 0.393 1.385 248 0.970 1.983 Violence 176 2.962 0.955 72 2.019 1.122 248 2.688 1.092 Vandalism 176 0.980 2.475 72 0.301 1.455 248 0.783 2.246 Arson 176 -1.762 2.632 72 -2.928 2.271 248 -2.100 2.583 Fraud 176 2.280 1.727 72 2.240 1.027 248 2.268 1.554 Homicides 176 -0.101 0.708 72 -1.064 0.785 248 -0.380 0.851 Kidnapping 176 -2.873 3.044 72 -2.474 2.054 248 -2.758 2.795 Control variable Cumulative FDI 220 6.194 1.694 90 7.793 2.457 310 6.658 2.074 Domestic Investment 220 4.957 2.963 90 6.116 3.191 310 5.294 3.071 GDP per Capita 220 8.898 0.615 90 8.895 0.718 310 8.897 0.646 Population 220 14.95 0.698 90 16.16 0.978 310 15.30 0.961 Road 220 9.372 0.682 90 9.410 0.775 310 9.383 0.709 Wage 220 13.70 0.357 90 13.51 0.419 310 13.64 0.385 Unemployment 220 2.015 0.359 90 2.02 0.464 310 2.016 0.391 Number of region 22 9 31
Noted: All the variables are in natural logarithm form. For the variables that have zero values, we do the natural log transformation in the following way: Ln(x) = ln(x+0.0001) if x≥0
E co n o m ic Jo u rn a l o f E m er g in g M a rk et s, 9 (2 ) O ct o b er 2 0 1 7 , 1 8 9 -1 9 8
Variable FDI Inf low Cumulative FDI
Dome stic Investment
GDP
per Capita Population Road Wage
Une m-ployment
Total Crime
Property
Crime Violence Vandalism Arson FDI Inflow 1
Cumulativ e FDI 0.746*** 1
Dome stic Inve stment 0.681*** 0.749*** 1
GDP per Capita 0.545*** 0.695*** 0.555*** 1 Population 0.491*** 0.670*** 0.573*** 0.230*** 1 Road 0.301*** 0.357*** 0.401*** 0.073 0.689*** 1 Wage 0.296*** 0.207*** 0.257*** 0.30*** -0.138** 0.058 1 Unemploy ment 0.003 0.244*** 0.094 0.27*** 0.257*** 0.002 -0.18*** 1 Total Crime -0.128** -0.227*** - 0.186*** 0.17*** -0.481*** -0.21*** 0.152** -0.088 1 Property Crime -0.18*** -0.240*** - 0.281*** -0.033 -0.327*** -0.069 0.171*** -0.125* 0.614*** 1 Violence -0.22*** -0.293*** - 0.323*** 0.027 -0.446*** -0.060 0.188*** -0.036 0.762*** 0.635*** 1 Vandalism -0.147** -0.216*** - 0.261*** -0.011 -0.310*** -0.09*** 0.152** -0.111* 0.608*** 0.954*** 0.627*** 1 Ars on -0.147** -0.147** - 0.180*** -0.065 -0.169*** 0.135** 0.118* -0.146** 0.431*** 0.652*** 0.471*** 0.562*** 1
In 2014, West Java province had a GDP (real GDP, constant 2000) of 408,320 billion IDR, making it one of the top-three with the highest GDP, while Gorontalo province with a GDP of only 3917 billion IDR ranked in the bottom-three. Furthermore, in thePopulationvariable which is measured by the number of residents as proxy for market size, West Java is the most populated region, leaving Gorontalo with the smallest population.
Table 3 shows the difference between Java and Bali Island, and Outside Java and Bali Island for all variables. There is a statistically significant difference between these two group. Java and Bali Island receive FDI inflows greater than Outside Java and Bali Island. The difference is about 2.08 and it is statisti-cally significant at 0.01level. Java and Bali Island have fewer crime incidents compared to the regions Out-side Java and Bali. The mean of total crime rate in Java and Bali Island is 4.7 crimes. The difference be-tween both groups is 0.50 and it is statistically significant at 0.01 level. These statistics confirm our as-sumption that a region with a high crime rate would have small FDI inflows.
Furthermore, the total of Cumulative FDI, Domestic Investment and Population variable in Java and Bali Island is higher than in the other groups. Meanwhile, Outside Java and Bali Island has a larger total minimum provincial wage. The difference is about 0.193 and it is statistically significant at 0.01 level. Thus, it implies that a region would have a larger FDI inflow, if a region has a higher population and do-mestic investment while maintaining a lower minimum wage.
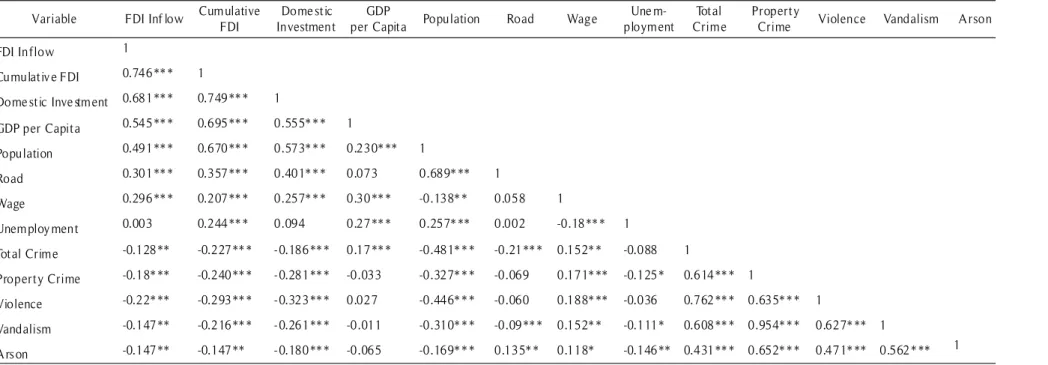
Table 4 identifies the correlation significances and the signs of each independent variable with the dependent variable. The variable Crime (Total Crime, Violence, Arson, Vandalism, and Property Crime) and control variable (Wage) are negatively statistically significant and correlated with FDI Inflow. On the other hand, the variables Cumulative FDI, Domestic Investment, GDP per Capita, Road and Unemploy-ment are positively statistically significant and correlated with FDI Inflow. Furthermore, the small value of VIFs (less than 4.0) indicate no presence of multicollinearity.
Since panel data also consists of cross sectional data, the heteroscedasticity problem occurred. Therefore, several tests to select the most consistent model were conducted. This study used the basic eq-uation proposed in Chapter III. The result of the Wald Test, Breush-Pagan/ Cook-Weisberg Test for hete-roscedasticity and Wooldridge test for autocorrelation in panel data test clearly reject the H0hypothesis,
implying that our data has a heteroscedasticity and autocorrelation problem. To alleviate this problem, this study employs Driscoll-Kraay standard errors. Additionally, Table 5 shows a small value of the p-value of Breusch-Pagan Lagrangian Multipier Test. It indicates that the Random effect model is consistent, over the Pooled least squared. In addition, from F-test and Hausman Test, the Fixed effect model is consistent over the Pooled least squared and Random effect models. From the Breusch-Pagan Lagrangian Multipier, F-test and Hausman Test, we can conclude that in general, the Fixed effect model is consistent and adequate, therefore our analysis will use the Fixed effect model with Driscoll-Kraay standard errors.
Table 5.Test for model selection
Test Result
Wald Testa Chi2(31)=2037.75; p-value=0.0000
Breusch-Pagan / Cook-Weisberg Test for heteroscedasticityb F(1, 277)=8.14; p-value=0.0047 Wooldridge Test for autocorrelation in panel datac F(1, 30)=12.592, p-value=0.0013 Breusch-Pagan Lagrangian Multiplier Testd Chibar2(01)==72.75; p-value=0.0000
F-teste F(30, 240) =12.44; Prob>F=0.0000
Hausman Testf Chi2(8)=260.72; p-value=0.0000
Note:
a: The null is homoscedasticity;b: The null is constant variance; c:The null is no first order autocorrelation;d:The null hypothesis that the Pooled-OLS is consistent, over the Random Effect model;e:The null hypothesis that the Pooled-OLS is consistent, over the Fixed Effect model;f:The null hypothesis that the Random Effects model is consistent, over the Fixed Effectsmodel.
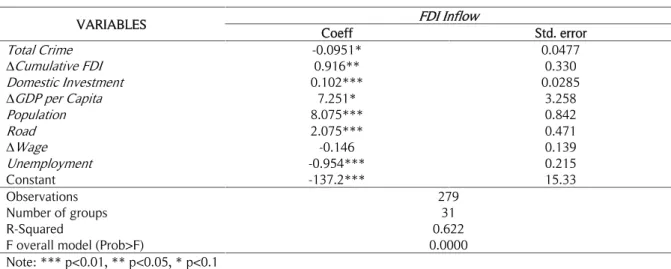
Table 6 shows the main results of this study, estimating the logarithm form of FDI Inflow with lag of logarithm form of Total Crime and lag of logarithm form of control variables for the period 2005-2015. Meanwhile, columns 2-8 present the results of regressing lag of logarithm form of certain crimes (Property Crime, Violence, Vandalism, Arson, Fraud, Homicides, and Kidnapping) and lag of logarithm form of con-trol variables. All of the results use the fixed effect model with Driscoll-Kraay standard errors.
In Table 6, the Fixed effect model fits the data well at the 0.05 significance level (prob > F(8,6) = 0.000). The value of R-squared is 0.622. It indicates that this model can explain 62.2 percent of the total
sample variation in logarithm of FDI Inflow across provincial Indonesia. Most of the parameters of inde-pendent variables (Total Crime and control variable) are statistically significant. Total Crime and GDP per Capita at the 0.1 significance level; Cumulative FDI at the 0.05 significance level; and Domestic Invest-ment, Population, Road, and Unemployment at the 0.01 significance level. On the other hand, only the variable Wage is statistically insignificant.
It is undeniable that market size is approximated by the logarithm form of number of provincial residents and the logarithm form of provincial GDP per capita, have significant positively related to FDI inflow. For every one percent increase in the provincial population and GDP per capita, FDI inflow is ex-pected to increase by 7.25 and 8.07 percent respectively, holding all other variables constant. Furthermore, when cumulative FDI, domestic investment and road as proxy for infrastructure increase by ten percent, FDI inflow will increase by 9.2, 1.0, and 20.7 percent respectively, holding all other variables constant. On the other hand, if unemployment increases by ten percent, provincial Indonesia will lose FDI inflow on average by 9.5 percent, holding all other variables constant. This finding confirms Constantinou (2011) that a large pool of unemployed may imply cheap labor costs and is likely to encourage location, but high unemployment might, also, imply powerful unions which hinder inflows.
Table 6.Estimation results (Model 1)
VARIABLES FDI Inflow
Coeff Std. error Total Crime -0.0951* 0.0477 ∆Cumulative FDI 0.916** 0.330 Domestic Investment 0.102*** 0.0285 ∆GDP per Capita 7.251* 3.258 Population 8.075*** 0.842 Road 2.075*** 0.471 ∆Wage -0.146 0.139 Unemployment -0.954*** 0.215 Constant -137.2*** 15.33 Observations 279 Number of groups 31 R-Squared 0.622
F overall model (Prob>F) 0.0000
Note: *** p<0.01, ** p<0.05, * p<0.1
The focus variable in this study is the variable Crime. As seen on the Table 6, logarithm form of Total Crime is significantly negatively related to FDI Inflow. Every increase of crime incidence per 100,000 people by ten percent, FDI inflow is expected to decrease by approximately 0.95 percent. Setting the crime rate at the zero level or considering that there is no crime incidence per 100,000 people during period 2005-2014, there will be an additional FDI inflow to Indonesia of about 151.1 million dollars. However, when we set the crime rate in its mean value, the results show that there will be an additional FDI inflow to Indonesia of about 93.46 million dollars. Thus, crime incidence leads to losing an additional 57.64 mil-lion dollars of FDI inflow.
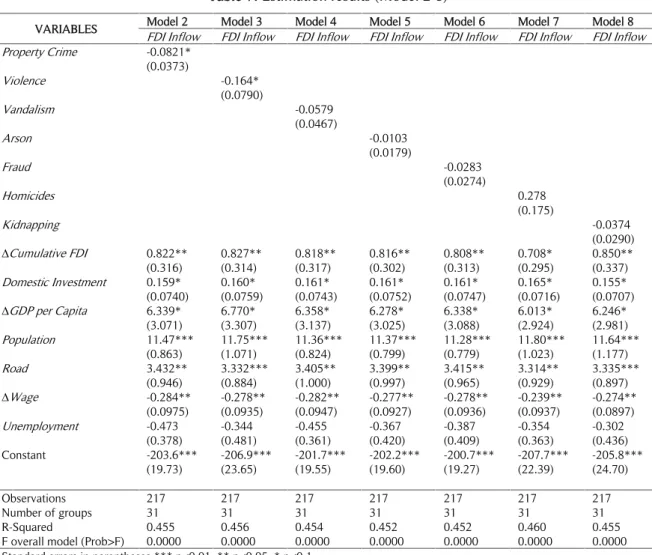
Moreover, Table 7 shows that not every type of crime significantly affects FDI inflow. Only prop-erty crime and violence are negatively significantly correlated with FDI inflow in Indonesia. In contrast to model 1, labor cost in models 2 and 3 are statistically significant; however, unemployment is not statisti-cally significant. Both models 2 and 3 fit the data well at the 0.05 significance level with the value of R-squared at 0.455 and 0.456 respectively. As seen in both equations, for every increase of both property crime and violence incidence per 100,000 people by ten percent, FDI inflow is expected to decrease by 0.82 and 1.64 percent respectively, holding all other variables constant.
In general, this study supports the result of the previous studies related to the determinants of FDI Inflow such as Tan & Tang (2016); Dadzie et al. (2014); Ashby & Ramos (2013); Madrazo-Rojas, (2009); and etc. From all of model specification proposed in this study, all control variables have a significant in-fluence on FDI Inflow and the variable Crime is negatively significantly related to FDI Inflow. This finding confirms the study by Daniele & Marani (2011) that conducted a panel analysis using data from 103 prov-inces during the period 2002-2006, and found that foreign investors perceived organized crime “as a sig-nal of a socio-institutiosig-nal system unfavorable for FDI”.
Table 7.Estimation results (Model 2-8)
VARIABLES Model 2 Model 3 Model 4 Model 5 Model 6 Model 7 Model 8 FDI Inflow FDI Inflow FDI Inflow FDI Inflow FDI Inflow FDI Inflow FDI Inflow Property Crime -0.0821* (0.0373) Violence -0.164* (0.0790) Vandalism -0.0579 (0.0467) Arson -0.0103 (0.0179) Fraud -0.0283 (0.0274) Homicides 0.278 (0.175) Kidnapping -0.0374 (0.0290) ∆Cumulative FDI 0.822** 0.827** 0.818** 0.816** 0.808** 0.708* 0.850** (0.316) (0.314) (0.317) (0.302) (0.313) (0.295) (0.337) Domestic Investment 0.159* 0.160* 0.161* 0.161* 0.161* 0.165* 0.155* (0.0740) (0.0759) (0.0743) (0.0752) (0.0747) (0.0716) (0.0707) ∆GDP per Capita 6.339* 6.770* 6.358* 6.278* 6.338* 6.013* 6.246* (3.071) (3.307) (3.137) (3.025) (3.088) (2.924) (2.981) Population 11.47*** 11.75*** 11.36*** 11.37*** 11.28*** 11.80*** 11.64*** (0.863) (1.071) (0.824) (0.799) (0.779) (1.023) (1.177) Road 3.432** 3.332*** 3.405** 3.399** 3.415** 3.314** 3.335*** (0.946) (0.884) (1.000) (0.997) (0.965) (0.929) (0.897) ∆Wage -0.284** -0.278** -0.282** -0.277** -0.278** -0.239** -0.274** (0.0975) (0.0935) (0.0947) (0.0927) (0.0936) (0.0937) (0.0897) Unemployment -0.473 -0.344 -0.455 -0.367 -0.387 -0.354 -0.302 (0.378) (0.481) (0.361) (0.420) (0.409) (0.363) (0.436) Constant -203.6*** -206.9*** -201.7*** -202.2*** -200.7*** -207.7*** -205.8*** (19.73) (23.65) (19.55) (19.60) (19.27) (22.39) (24.70) Observations 217 217 217 217 217 217 217 Number of groups 31 31 31 31 31 31 31 R-Squared 0.455 0.456 0.454 0.452 0.452 0.460 0.455
F overall model (Prob>F) 0.0000 0.0000 0.0000 0.0000 0.0000 0.0000 0.0000
Standard errors in parentheses *** p<0.01, ** p<0.05, * p<0.1 Conclusion
The results support the current literature by confirming that Cumulative FDI, Domestic Investment, GDP per Capita, Population and Road significantly positively influence the FDI Inflow variable and Crime and Wage exert a significantly negative effect on FDI Inflow. It is found that for every increase in total crime incidence per 100,000 people by ten percent, FDI inflow is expected to decrease by approximately 0.95 percent. A high crime incidence in a region, could lead to that region being undesirable for investment due to its negative image. In general, the crime rate influences the investment decisions in terms of location.
This study suggests that besides boosting economic growth, stimulating infrastructure develop-ment, and lowering the provincial minimum wages, government needs to pay attention to crime incidence in each province. Government should allocate adequate resources to minimize the crime rate. When poli-cies can successfully lower the incidence of crime, it is expected that the investors will respond positively and choose to invest in the province. Therefore, the effectiveness of policies related to crime, play an im-portant role in foreign investment.
References
Albanese, G., & Marinelli, G. (2013). Organized crime and productivity: Evidence from firm-level data. Rivista Italiana Degli Economisti,18(3), 367–394. https://doi.org/10.1427/74922
Ashby, N. J., & Ramos, M. A. (2013). Foreign direct investment and industry response to organized crime: The Mexican case. European Journal of Political Economy, 30, 80–91. https://doi.org/10.1016/j.ejpoleco.2013.01.006
Brock, G. J. (1998). Foreign direct investment in Russia’s regions 1993‐ 95. Why so little and where has it gone? Economics of Transition, 6(4), 349–360. https://doi.org/10.1111/j.1468-0351.1998.tb00053.x
Constantinou, E. (2011). Has Foreign Direct Investment exhibited sensitiveness to crime across countries in the period 1999-2004? And if so, is this effect non-linear?Undergraduate Economic Review,7(1), 1–31.
Dadzie, C., Blanco, L., & Dony, C. (2014). Study on Crime and Investment in Latin America and the Caribbean. United States. Retrieved from http://pdf.usaid.gov/pdf_docs/PA00K4WM.pdf
Daniele, V., & Marani, U. (2011). Organized crime, the quality of local institutions and FDI in Italy: A panel data analysis. European Journal of Political Economy, 27(1), 132–142. https://doi.org/10.1016/j.ejpoleco.2010.04.003
Madrazo-Rojas, F. (2009). The effect of violent crime on FDI: The case of Mexico 1998--2006. Georgetown University.
Mukherjee, A., Wang, L. F. S., & Tsai, Y. (2012). Governance and Foreign Direct Investment Is there a two-way relationship ?Trade and Development Review,5(1), 37–51.
Statistics-Indonesia. (2006).Statistical Year Book of Indonesia 2005/2006. Jakarta.
Tan, B. W., & Tang, C. F. (2016). International Journal of Economics and Financial Issues.Examining the Causal Linkages among Domestic Investment, FDI, Trade, Interest Rate and Economic Growth in ASEAN-5 Countries,6(1), 214–220.