Stephen Machin and Richard Murphy
Paying out and crowding out? The
globalization of higher education
Article (Accepted version)
(Refereed)
Original citation:
Machin, Stephen and Murphy, Richard (2017) Paying out and crowding out? The globalization of higher education.Journal of Economic Geography, 17 (5). pp. 1075-1110. ISSN 1468-2702 DOI: 10.1093/jeg/lbx006
© 2017 The Authors
This version available at: http://eprints.lse.ac.uk/85211/
Available in LSE Research Online: November 2017
LSE has developed LSE Research Online so that users may access research output of the School. Copyright © and Moral Rights for the papers on this site are retained by the individual authors and/or other copyright owners. Users may download and/or print one copy of any article(s) in LSE Research Online to facilitate their private study or for non-commercial research. You may not engage in further distribution of the material or use it for any profit-making activities or any commercial gain. You may freely distribute the URL (http://eprints.lse.ac.uk) of the LSE Research Online website.
This document is the author’s final accepted version of the journal article. There may be differences between this version and the published version. You are advised to consult the publisher’s version if you wish to cite from it.
0
Paying Out and Crowding Out?
The Globalisation of Higher Education
Stephen Machin* and Richard Murphy**
January 2017 – 2nd Revision
* Department of Economics and Centre for Economic Performance, London School of Economics
** Department of Economics, University of Texas at Austin and Centre for Economic Performance, London School of Economics
Abstract
Increased globalisation of higher education has occurred as more students from across the world now enrol in universities abroad for their post-school education. We study the consequences of having more foreign students in one of the world’s biggest receivers of international students, the United Kingdom’s higher educational system. To do so, we estimate the impact of growing numbers of international students on the number of domestic students. Using rich administrative data, we find no evidence of crowd out of domestic undergraduates whose enrolment numbers are regulated by maximum quotas. For domestic postgraduates, who do not face such quotas, there is evidence of crowd in. We establish causality of this relationship by employing two empirical strategies to predict exogenous international student growth. The first uses shift-share instruments based on historical patterns of student enrolment from countries attending specific university departments. The second is based upon the very fast growth in enrolment of Chinese students that was facilitated by changes in visa regulations in combination with distinct subject of study preferences.
JEL Keywords: Student enrolment; Foreign students. JEL Classifications: I23.
Acknowledgements
We would like to thank Bill Kerr and two referees, together with participants at the RES, EALE, MECSC and PEGGED conferences, Mark Duggan and Gill Wyness for a number of helpful comments. We also acknowledge with thanks the support of the Sutton Trust in the initial stages of this research. We also thank the Higher Educational Statistical Agency (HESA) for the use of their data. HESA does not accept responsibility for any inferences or conclusions derived from the data by third parties.
1
1. Introduction
International students bring a growing and considerable revenue to universities across the world, through their increasing numbers and by paying higher tuition fees than domestic students. A critical research and policy question is whether the increasing numbers of overseas students enrol in the place of domestic students, or whether the additional income they generate acts to subsidise domestic students. This forms the subject matter of this paper where we ask the following questions. Has the increasing number of international students impacted on the number of domestic students in higher education? Has their increased enrollment acted to crowd out or crowd in domestic students?
There have been very rapid and sizable increases in the number of international students globally, with 4.3 million higher education students registered as studying abroad in 2012, up from 1.3 million in 1990 (OECD, 2013). Universities in the UK have been in a prime position to recruit these international students. They are generally considered to offer high quality degrees, with a number of universities placing high in international world rankings.1 Furthermore, given that English is the major lingua franca of business and academia, universities in English-speaking countries have a clear advantage in attracting international students. Thus, the UK ranks second, after Australia, in the percentage of enrolled university students who come from overseas and second, after America, in total numbers enrolled (OECD, 2013, 2015).2
Aggregate figures show that in the academic year 2011/12 the total number of international students in UK universities had reached 245 thousand full-time students which is
1 For example, in Shanghai’s Jiao Tong University’s ranking two UK universities appear in the top 10 world rankings and seven in the top 50 (Jiao Tong, 2016)
2 In addition, country market shares of the total number of international students in 2015 were: United States 19%; United Kingdom 10%; Australia and France 6%; Germany 5%; Canada and Japan (both 3%) (OECD, 2015)
2
almost quadruple that in the 1994/95 academic year. The postgraduate sector saw the highest growth in overseas students in the UK, both in terms of proportions and absolute numbers. By 2011/12 there were over six times as many international taught postgraduates than there were in 1994/95, as enrolments rose from 15 thousand to 97 thousand.
International students typically pay higher tuition fees than domestic students and, as such, have become a major source of income for the Higher Education (HE) sector.3 Tuition fee revenue from these overseas students in 2011/12 constituted 39 percent of all fee income from full time students, despite them representing only 15 percent of the overall full time student body (HEIDI, 2012).
We study this period of rapid growth of international students attending UK higher education insitutions. Notably this was also a period where the UK government regulated key features which acted to limit the ways in which universities could react to this growth. In fact, the UK government had in place strict price controls (which set maximum binding tuition fees) on undergraduates and, critically for our analysis, quantity controls on the maximum number of undergraduate places available at each university to domestic students which were usually binding (HEFCE, 2000). By contrast, enrolment at the postgraduate level had no regulations relating to the number of domestic (or foreign) students or prices charged.
Differing degrees of regulation at the different education phases make it clear that there is a need to conduct our empirical tests of crowd out - or crowd in – separately for three student groups enrolling in different phases of university education. The first are undergraduates, the majority of whom are students who will typically be coming directly from secondary education
3 Average international fees for an undergraduate (postgraduate) course were £9,360 (£9,520) in 2009/10 (see Murphy, 2014). Comparatively, domestic undergraduates paid a regulated fee of £3,000 and came with minimum of £3,947 in subsidies from the Government, dependent on subject and location.
3
and will be embarking on a course to obtain a Bachelor’s degree (BSc, BA, etc.). The second are taught postgraduates, typically individuals who have completed an undergraduate degree and are enrolled on a course that is primarily lecture based. These courses mostly last for one year and students are awarded a Master’s degree (MSc, MA, etc.). Finally, research postgraduates are students that have enrolled in a research centric course, and are primarily PhD students.4
The rapid increase in overseas students combined with the novel institutional features outlined above make the UK a good testing ground to see how increasing international enrolments can impact on the number of domestic students. Our hypothesises is that, given the maximum cap on undergraduate enrollment at a university, if crowd out exists it should occur here as there is no possibility of crowd in. For postgraduates there could be crowd out or crowd in. These institutional features also distinguish our analysis from a small, but growing, US literature (discussed in Section 2 below) where universities face fewer restrictions on domestic student numbers.
Turning to the issue of empirical testing, one straightforward way of thinking about whether there is crowd in or crowd out (or neither) comes from studying correlations between changes in the number of domestic students and changes in the number of international students within universities over time. A negative association would correspond to crowd out (or displacement) and a positive one to crowd in (or subsidisation). This is not unlike the approach taken in the literature on immigration and the labour market where researchers look for possible displacement of native workers by immigrant flows (see, inter alia, Borjas, 1999, Card and DiNardo, 2000, or Card, 2001).
4
However, as is the case with that literature, concerns related to endogenous sorting can arise. In the case of higher education, common or diametric patterns of sorting to particular universities by domestic and overseas students can render estimates biased. For example, a university increasing capacity through introducing a new department, may in turn generate an increased number of domestic and international students. To mitigate such concerns, in our analysis we use two separate methods in attempts to identify a relationship between changes in domestic and foreign students that ensures the direction of causation flows from changes in foreign to changes in domestic student numbers.
The first of these has parallels with the labour economics literature on immigration where authors use the fact that immigrants from particular sending countries tend to settle in places where previous migrants from their country have settled (so called ‘enclaves’).5 We implement
a similar approach in terms of enrolment choices of international students. To do so, we adopt a shift-share approach which exploits the historical enrollment patterns of students from origin countries to generate an instrument to predict exogenous variations in the number of overseas students attending that university department.6
The second approach is based upon the very rapid increases in the number of students enrolling in UK universities from China in the 2000s. We use a change in Chinese visa regulations in combination with strong revealed subject preferences and price sensitivity (in the form of exchange rates) amongst Chinese students to predict changes in international students by subject and year. These factors culminated in a sharp 1,900 percent increase in Chinese
5 See, for example, Card (2001).
6 More precisely, in most of our empirical work below, we look at field of study and university as that is the level of analysis that our data permits. See the data description in Appendix B for more details. Shih (2015) uses a similar shift-share instrument in his study of graduate student enrolment in US universities.
5
students over a seven year period from 1998/99, with over 80 percent of this growth occurring only with Business and Management based subjects. One can think of this empirical research design as being somewhat analogous to the recent research on the effects of imports from China on labour markets and firm productivity, which utilise large shifts in the Chinese share of imports to specific markets in advanced countries to identify the impact of increased international trade (see Autor, Dorn and Hanson, 2013, and Bloom, Draca and Van Reenen, 2016). Post the visa reform some UK departments experienced a doubling of the number of Chinese student enrolments year on year, whilst others experienced no change.
To implement these research approaches, we analyse administrative data for the entire UK population of Higher Education (HE) students over an eighteen year period (running from academic years 1994/95 through to 2011/12). This covers the time period when rapid internationalisation of the UK HE sector occurred and we end in the 2011/12 because that is when the government made large changes to student finacing and support, increasing the cap on tuition fees to £9,000 a year for undergraduates and simultanously cutting state funding of undergraduates.
To preview our main findings, we see that whilst there has been a big rise in the number of international students enrolling in UK universities, overall this has not resulted in crowd out of domestic students. Indeed, in our preferred estimates for which we instrument overseas growth using historical shift-share measures, we find strong evidence of cross-subsidisation for taught and research postgraduates, with domestic enrolment increasing at a one to one rate to with overseas postgraduates. These estimates match those found at the graduate level in US colleges (Shih, 2015). Contrarily, for undergraduates, whose numbers were subject to government caps during this time period we find no evidence of either crowd in or crowd out.
6
The rest of the paper is structured as follows. Section 2 provides a brief overview of findings from the growing research literature on international students. Section 3 offers a description of the UK higher education sector and how it has changed over time, placing a particular focus on the changing mix of domestic and foreign students. Section 4 describes the data we use and the research designs that we implement. Section 5 reports the results, while section 6 offers some conclusions.
2. Related Research
Given the growing number of overseas students attending universities abroad, the topic of whether there is crowding out of domestic students by foreign students has taken on an increased policy and research relevance. Therefore it may seem surprising that there is comparatively little research that directly studies the question, although this has began to change in the last few years. Moreover, there is no research to date on the UK, the second largest recipient of international students after the US.
Some of the first papers in this area studied correlations between total numbers of native and foreign graduate students in the US (Regets 2001; Zhang 2004; Borjas 2007, Zhang 2009), and found mixed results regarding possible crowd out.7 However these papers rely on the within
7 Regets (2001) finds a positive correlation for graduate students in the Graduate Student Survey between 1982 and 1995. Using the Survey of Earned Doctorates over the period 1966-2002, Zhang (2004) finds a positive correlation for science and engineering but a negative correlation for remaining subjects. In a follow on paper Zhang (2009) uses the same data and finds that each additional international graduate student in science and engineering is associated with an additional domestic graduate. In non-science subjects there is a negative relationship driven by increased foreign female students and fewer male domestic graduates. Again extending the analysis to focus upon sub-groups, Borjas (2007) uses the Integrated Postsecondary Education Data System (IPEDS) and finds no impact on average but a significant negative effect for a subsample of native white males and demonstrates that this can neither be explained by demographics nor by a decline in demand for university places by males.
7
insitution variation in enrolments over time and as such do not consider the possibililty of endogenous sorting.
Hoxby (1998) addresses this issue by exploiting a policy change in the fee structure of the Californian higher education system to study whether disadvantaged natives were affected by the presence of foreign students in higher education. She finds no significant effects overall, but does find indications of a crowding out effect on disadvantaged native students. She infers two likely mechanisms that bring this about are competition for financial aid and affirmative action.8
Using an historical shift share instrument, in a similar method to our first research approach, Shih (2015) examines the possible displacement effects of international students in US graduate programs. Exploiting variation in the college age population of sending countries and a reduction in student visas issued post-9/11, the paper finds a positive one to one impact on native graduates.9 As will become evident, we find similar impacts on graduate students. Our paper differs by also separately examining the impact on Masters and undergraduate students, in a different institutional setting with varying controls on student numbers. Moreover, the Shih paper ends its analysis in 2005, by examining the period from 1994/5 to 2011/2 we extend the time period to include the large recent jump in Chinese students.
8 Similar methodological approaches (and those of Borjas and Hoxby) are used, but in the different context of compulsory schooling, by Betts (1998) and Gould, Lavy and Paserman (2004) who report that increased immigrant inflows have significant adverse effects on the educational outcomes of native students. This is, of course, a very different setting as in the context of HE (and opposite to compulsory schooling) because in HE foreign students are more likely to come from higher socio-economic backgrounds. Other related schooling studies are Geay, McNally and Telhaj (2013) who look at non-native speakers in English schools and Ohinata and Van Ours (2013) who study immigrant children in Dutch schools.
9Other exogenous sources of exogenous demand shocks for places by international students were examined by Bird
8
In a similar manner to our second method which considers the rapid influx of students from China, Bound, Turner and Walsh (2009) study the large growth in Chinese graduate student numbers that occurred during the 1980s in the US. This growth occurred mainly outside the most highly ranked programs, and they find crowd out effects to be minimal. They conclude that many of these programs are relatively elastic in scale, although they also state this was during a period of increased funding.
Bound and Turner (2010) advance their research beyond the question of immediate crowd out by studying the way in which production of science and engineering doctorates, many of which are increasingly obtained in US universities by foreign students (especially from Asia), interacts with research and undergraduate teaching. They conclude that expansion of research funding for science and engineering has been a key facilitator of increased foreign enrolments in doctorates, and because of this such increased foreign flows have had only a small impact on undergraduate degree production.
There is also a parallel literature in the US that looks at enrolment at state colleges from out-of-state students. This has similarities in terms of developing a conceptual model of possible crowd out because the latter pay higher tuition fees than their in-state counterparts. Whilst on a different research question to our study, some similar themes and identification issues arise. For example, Groen and White (2004) develop a model where universities want to maximise the number of high ability students, tuition revenue and future returns from alumni, but state government prefers enrolment from individuals who will continue to live in state as after they graduate they will bring in additional tax revenues. With an assumption that out-of-state students are less likely to stay, they find that tuition fees and admissions standards should be lower for in-state students.
9
Also studying in-state versus out-of-state enrolments but with regard to possible crowding out, Winters (2012) presents empirical findings from a state-level panel on enrolments at four-year public state universities. He finds that larger cohorts of in-state students results in flagship public universities taking on fewer non-resident students. At the same time these universities also raised the fee price charged to these students.10
3. The UK Higher Education Sector
Trends in Domestic and Foreign Student Numbers
Figure 1 shows aggregate trends in higher education (HE) participation in the UK between the academic years 1981/82 to 2011/12. In 1981/82 the participation rate in higher education for the appropriate age cohort was just over one in ten. This increased rapidly during the 1990s expansion and has continued to rise, reaching 40 percent by the academic year 2011/12. The majority of this growth has been driven by increases in the numbers of domestic students.11
Table 1 shows summary statistics on our administrative data from the Higher Education Statistics Agency on the population of students enrolled in the UK for unbalanced and balanced panels of universities between 1994/95 and 2011/12 (the composition of the panels is described more fully in Section 4 below and in the data description Appendix B). Rows at the bottom of the table show that the total number of full-time students enrolled in all universities in the full
10 In the UK the distinction between public and private universities is not very important as there are only two of the latter. Excluding these two, all UK universities are government financed and face the same fee and student number restrictions. The exceptions are the charitable University of Buckinghamshire and the profit making University of Law, which combined make up less than 1% of all students (around 10,000). These universities do not record their student numbers in our data and therefore are not included in the analysis.
11 The funding of HE did change radically over this time period. The system moved from one of being broadly ‘free’ (i.e. non-fee paying with maintenance grants for some students) to one where students pay fees and no longer receive maintenance grants, but can take out loans to fund their education. For more detail see Dearden, Fitzsimons, Goodman and Kaplan (2008) or Dearden, Fitzsimons and Wyness (2014).
10
sample increased from 1.06 million in 1994/95 to 1.65 million in 2011/12. During this time the proportion of international students enrolled increased from around 6 percent (or 65 thousand) to 15 percent (or 246 thousand) of all full-time students.
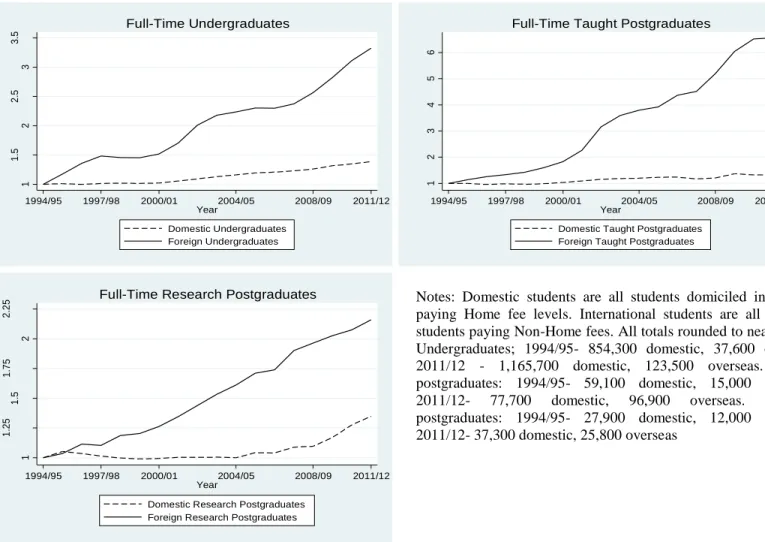
Sharp increases in the relative numbers of international students have occurred at both undergraduate level and at postgraduate level.12 Figure 2 shows trends over time in the growth
of domestic and foreign undergraduates, taught postgraduates and research postgraduates, where the numbers of each are indexed at 1 in 1994/95. The relative increase is clear for all three, but is especially marked amongst full-time taught postgraduates.
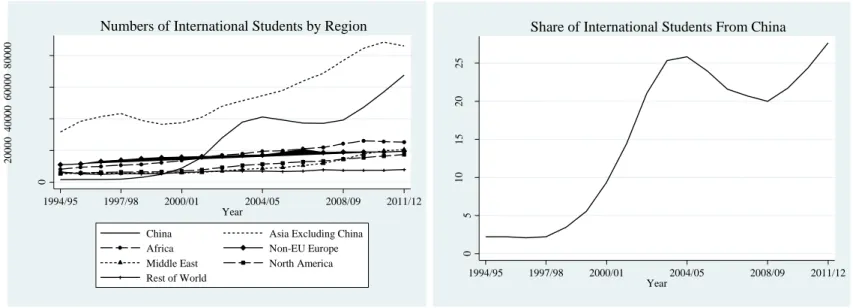
Origin Countries of International Students
By broad region of origin, the composition of international students enrolled in UK universities has for the most part remained relatively stable over this time period, with Asia (apart from China) being the dominant sending region.13 There is one notable exception to this, however, as shown in Figure 3. The Figure shows there to have been one particularly big change in the composition of overseas students, namely the increased influx of Chinese students. In the 1994/95 academic year, there were 1,510 Chinese students amongst all UK universities studying full time at any level. This remained fairly stable until 1998/99, after which it began to increase rapidly, almost doubling year on year from 2000/01 to 2003/04. By 2005/06 there were 39,820 Chinese students, corresponding to a 1,900 percent increase over a seven year period. This remained stable again until the 2009/10 academic year, when the number began growing quickly
12 See Lindley and Machin (2016) for details on the scale of the increased numbers of postgraduates over time, and the changing pay premia connected to postgraduate versus undergraduate study, in Britain and America.
13 This is the case for the following broad regions using NSCC groupings; Africa, Asia, Non EU, Middle East, North America and the Rest of the World. Asia as a whole is by far the largest source region of foreign students enrolled in the UK, followed by Africa and then North America.
11
again. By 2011/12 the Chinese accounted for more than 4 percent of all students and 26 percent of all overseas students.
The rapid expansion in these numbers was caused in part and facilitated by a change in the Chinese visa licencing for students. In 1999 the Chinese Government introduced new regulations14 which made it considerably easier for self-funded Chinese students to study abroad.
Although it had been possible to self-fund since 1981, international study was still characterised by around 5,000 government funded students from the leading universities being sent to strategically productive placements abroad. 15 The opening of licensing agencies dramatically increased the size of the self-funded sector - in 1998 there were 11,443 self-funded students, by 2002 there were 117,000 in China (Li and Zhang, 2010).
This change in the proportion of Chinese students being self-funded has meant they have become concentrated in certain fields of study. Figures A1 and A2 in Appendix A clearly shows that there are strong subject preferences from these students. Business & Management had by far the largest increase in enrolment, increasing from near zero at the start of our sample to over 16,000 by 2012. The second tier of growth subjects which also saw big increases in numbers (and in proportions) were Maths & Computing, Economics and Engineering. There is very little growth in the remaining subjects. Furthermore, given that Chinese students became predominately self-funded rather than sponsored by the state, they also are likely to become more price sensitive, a pattern we test empirically in Section 4. We also go on to use the combination of the visa rules changes, subject preferences and increased price sensitivity as shocks to the predicted number of Chinese students attending certain university departments.
14 Regulations for the Administration of Intermediary Agencies for Self-Funded Study Abroad 1999 (PRC). 15 State Council – Interim Provisions for Study Abroad with Self-funding.
12 Regulations on University Admissions and Fees
Thus far in the paper we have only mentioned domestic and international students. In reality there are also non-UK European Union (EU) students. EU regulations require that all EU students domiciled in EU countries are treated in the same way as natives to that country. This means that all UK regulations that apply to domestic students also apply to EU students. We will refer to the combination of UK and EU students as home students (as they both pay home level fees), and UK students as domestic students. In the analysis, we show results for the impact on both the number of home and domestic students. By the end of the time period we study, non-UK EU students comprised 6 percent of home fee undergraduates and 23 percent of taught and research postgraduates.
In the time period our data covers, tuition fees for home undergraduate students were highly regulated with universities receiving the majority of the cost of tuition via government subsidies. Historically universities did not charge for tuition for home students, but in 1998 the government established a means tested tuition fee schedule with students paying up to £1,000. In 2006 this was further amended as universities were allowed to set their own tuition fees up to a maximum of £3,000.16
Universities received funding from the state through the Higher Education Funding Council for England (HEFCE) according to the number of home fee students enrolled.17 Due to having a limited budget to spend on higher education, in 1994/95 the government limited the number of home fee undergraduate places at each university. The HEFCE set a Maximum
16 In fact, this proved to be binding, with all but one university charging the maximum allowable £3,000.
17 Government funding was dependent on the location of the university and the cost of the subject taught. There are four subject categories which are given cost weightings; Class D courses involves only lectures have weight 1; Class C courses have a fieldwork or studio element have weight 1.3; Class B courses are laboratory-based subjects and have a weight of 1.7; Class A courses are medicine and dentistry and have a weight of 4.
13
Student Number (MaSN) dictating the maximum number of subsidised students allowed to be enrolled by each university. These caps were typically binding as universities were incentivised to remain close to the Maximum Student Number.18 Universities who took on more home students than they were allocated were issued a monetary fine per student exactly offsetting any direct financial gains. This was a constraint on the growth of home undergraduates during this time period in the form of government maximum quotas. Note, as non-UK EU students are funded in the same way, they come under the same quota system as domestic students, and so by definition they displace domestic students on a one-for-one basis.
Unlike the situation facing undergraduates, there are no regulations on home postgraduate tuition fees (taught or research). Despite this the government still provides a subsidy for home taught (masters) students, and therefore the government also limits the number of students according to the same MaSN cap. There is an exception to this cap for masters’ students. Any university that charges tuition fees to home master’s students in excess of the governments assumed cost per student (£7542 in 2010)19 can choose to forego government funding for these students and not count them against their Maximum Student Number. By doing so the university would then be able to grow the number of home taught postgraduates. There are differences between universities in whether or not this pre-requisite was met, with the leading research universities in the Russell Group20 typically doing so and the remainder much
18 From 1997/8 universities could apply to HEFCE to increase their student numbers. If universities bid for additional places which were not filled, the in the subsequent years this additional teaching funding would be withheld (HEFCE, 2000). By the time of our main analysis (in 2001/02) these constraints were binding, although universities were allowed a 2% margin of error (HEFCE, 2000).
19 This cost is a summation of teaching subsidy per student (£3,951) and assumed fee (£3,591)
20 The Russell Group universities are the twenty most selective research institutions and are: The University of Birmingham; The University of Bristol; The University of Cambridge; The University of Leeds; The University of Liverpool; Imperial College of Science, Technology and Medicine; King's College London; London School of Economics and Political Science; University College London; The University of Manchester; The University of Newcastle-upon-Tyne; The University of Nottingham; The University of Oxford; The University of Sheffield; The
14
less likely to. Therefore, many universities (the majority of non-Russell Group institutions) would still be constrained in increasing their number of domestic taught postgraduate students.21
The funding for the number of home research postgraduates is not on a per student basis and so not subject to the mandated caps. Funding for these students is allocated in proportion to the number of home research postgraduates in their first 3 years of full time study (6 years for part time) in departments rated of high quality in the previous Research Assessment Exercise (RAE). This means that there are no caps on the amounts of research postgraduate students enrolled at a university. The total amount of funding for these students is set nationally and then split accordingly amongst eligible institutions.
In contrast to these regulations on domestic students, international students receive no government subsidies, and therefore institutions face no limit to the number they enrol. The only limiting factor is the number of overseas student visas approved by the UK immigration office and from the sending country. In addition to there being no regulations on their numbers, the fees for international students are also unregulated. Thus, similarly to the situation for domestic postgraduate students, universities are free to charge what the market will permit.
Murphy (2014) reports that international fees have been rising over time and are similar for international undergraduates and postgraduates (£9,500 in 2009/10). In spite of these price increases he argues that the international market for students is highly competitive, because by their very nature international students are highly mobile. Murphy shows low price dispersion
University of Southampton; The University of Warwick; The University of Edinburgh; The University of Glasgow; Cardiff University; The Queen's University of Belfast
21 Between 2000/01 and 2004/05 universities were allowed to bid for Additional Student Numbers (ASN) to increase its MaSN. To do so an institution needed to show that it was currently at capacity, show excellence and provide evidence that there is demand for additional places. One feature of this was for universities to use overseas students as a signal of this demand. This potentially allowed the number of overseas students to influence the number of domestic students, even with the government quotas in place.
15
amongst courses of a similar reputation and therefore claims that universities are price takers on the international student market.
In summary, universities face different constraints in generating increases in tuition revenue depending on the graduate (under or post) and domicile status of students. The binding constraints for domestic undergraduates are limits on both enrolment numbers and prices. For domestic postgraduates there are fewer regulations on numbers and prices are unregulated.22 Finally for international students, there are neither controls on numbers or prices. Given these features and the price taking nature of universities (both from government regulations and market forces), if there was a large increase in demand for places from international students, one may expect more muted reactions in the domestic undergraduate market compared with the postgraduate market.
4. Data and Research Designs
Data Description
The administrative data we use comes from the Higher Education Statistics Agency (HESA) and contains information on all full time students studying at higher education institutions between the academic years 1994/95 and 2011/12, comprising 18.6 million individuals in total. This annual count data is broken down across the following groups: 165 subject areas, 267 domiciles of origin, 3 levels of study, 2 fee statuses and 2 genders over 18 years.23
22The central administration of a university can choose to move funding across departments/levels. In practice some
departments may subsidize others in general, but typically this does not vary year on year. Moreover, this can only be done with respect to the overall university wide constraints on undergraduate growth. We present results at the university level to investigate this possibility.
23 So, as an example, in a given academic year we can calculate the number of male French students at Oxford paying home fees who are studying physics at undergraduate level. Crucially, this data is not suppressed for low counts in cells.
16
We conduct separate analyses for undergraduates, taught postgraduates and research postgraduates. To eliminate the issue of universities opening and closing, we study a balanced panel of universities. This is defined as including those with a positive student count for any of the levels (UG, PGT, and PGR) in all of the years. This brings our sample to 144 higher educational institutions, compared with the 149 present in 1994/95 (see Appendix B for details). These 144 universities enrol the vast majority of students throughout the sample (98 percent in 1994/95 and 99 percent in 2011/12).
Summary statistics are shown in Table 1 in the columns labelled ‘balanced panel’. Note, not all universities have all subject groups and/or undergraduate and post graduate education phases and therefore the number of observations in our statistical models need not be constant across specifications.24 The 144 higher educational institutions are very heterogeneous, including some institutions that are highly specialised (e.g. University of the Arts, London), vocational (e.g. The Royal Veterinary College), old (e.g. The University of Oxford) and the universities that were former polytechnics (e.g. Southampton Solent University). As part of our analysis we also estimate the relationship at the 20 Russell Group and 124 non-Russell Group universities that respectively are likely to be in higher and lower demand by both domestic and international students.
There are many different courses on offer at UK universities. We have data on 165 distinct field of study categories. During the early years of our data, the number of overseas students was relatively small in some universities and, so as to ensure that there were sufficient non-zero shares of students from countries, we aggregated groupings of related subjects. The
24For example the London School of Hygiene and Tropical Medicine, the Royal College of Art and London
Business School have no undergraduate students. Similarly Ravensbourne College of Design and Communication, Leeds Trinity and All Saints and Trinity Laban have no research postgraduate students.
17
165 subjects are grouped into 5 subject areas; (1) Medicine, dentistry and subjects allied to medicine; (2) Sciences; (3) Social Sciences, Law and Business, (4) English, Languages and History; and (5) Creative Arts, Design and Education. Table 1 shows student numbers in each of these five groups, and also in twelve smaller groups which we use for the analysis exploiting the demand from Chinese student for Business Studies.25 More details on these, and other
definitional aspects of the data, are given in the data description Appendix B. Empirical Approaches
Our empirical approach begins by borrowing from the related literature that studies the impact of immigrant inflows on native outcomes, further developing methods used there to our particular institutional setting. The most well-known work in this area studies the impact of inflows on labour market outcomes, but there are also studies looking at other outcomes like crime, use of public services and education.26
Considering the impact of immigrant flows on native outcomes, various authors (like Borjas, 2006, and Card, 2001) have set up empirical specifications in research designs that are formulated to net out problems to do with initial conditions and mechanical biases. Peri and Sparber (2011) offer an excellent summary of the different approaches and claim, in the context of spatial variations across cities, the best empirical representation is one which relates changes in native or immigrant outcomes (employment in their case) scaled by the lagged size of the spatial unit (the city in their study context).27 In our setting, the analogous outcomes are domestic
25 Results using 12 subject areas instead of the 5 broad areas are available from the authors upon request. They are similar, but because of a higher preponderance of zeros the first stage results were not as strong.
26 Examples of studies of crime and immigration are, inter alia, Bell, Fasani and Machin (2013), on public services and immigration see Wadsworth (2013) and on education and migration see Dustmann and Glitz (2011).
27 As a robustness rather than change from last period we also estimate the specifications using the changes from the initial period, similar to Peri et al. (2015). This makes little difference to the results in qualitative terms.
18
(home fee) and international student numbers who are enrolled to study a particular field by university. Therefore we develop a baseline estimating equation for enrolling in subject j in university i in year t as:
(Dijt - Dij,t-1)/Sij,t-1 = αij+ β1(Fijt - Fij,t-1)/Sij,t-1 + Tt + εijt (1)
where D is the number of domestic students, F is the number of foreign students, and S is the total number of students (S = D + F).The specification includes a full set of field of study by university fixed effects (αij) and time effects (Tt) and an error term (εijt). As the model is specified
in changes it accounts for underlying differences across universities and subject areas, with αij
reflecting average growth rates by university field of study and Tt accounting for annual
aggregate growth rates across the university sector. Therefore, the identifying variation comes from deviations of growth rates from university field of study growth trends.
In equation (1), β1 is the parameter of interest for determining whether or not there is a
crowding in or out. A positive β1 is suggestive of crowd in/subsidisation, whilst a negative β1
implies crowd out/displacement and a zero would reflect no impact on the number of domestic students. This coefficient can be interpreted as the number of domestic students who respond to each additional overseas student (e.g. a coefficient of -1 implies one-for-one crowding out). These estimates are not affected by cell size, nor is there any artificial correlation between the dependent and explanatory variable.
Whilst equation (1) is quite stringent in that it specifies the relationship in terms of within field of study by university changes and includes a full set of fixed effects, it does not account for the potential endogeneity of overseas demand (unless the fixed effects factor out any bias). This is important as universities that experience shocks, such as changes in university rankings or expansion via new teaching buildings, may affect the supply or demand of places for domestic
19
and overseas students simultaneously. To address this issue of common unobserved shocks, we use instrumental variable techniques to generate an exogenous source of variation in the number of overseas students at university subject area level.
We adopt two approaches to do this. The first employs the shift share approach that has been commonly used in the immigration literature (see Bartik 1991, or Card, 2001). This approach relies on prior immigrant settlement patterns as a source of identifying information. The thought experiment is that a city with an historically high share of the immigrants from a particular source country, is more likely to experience growth when the national amount of immigrants from that source country increases, compared to a city with a low historical share. The key assumption is that the national inflow rates from each source country are exogenous to conditions of any city.
When thinking of university enrolments, the conceptual analogue is that individuals from a particular origin country are more likely to go to universities, and study subjects, where previous students from that country attended. Anecdotally, this seems reasonable in that there are well known examples of students from particular countries studying the same kind of degrees in particular countries. This is an anecdote that we will empirically test and which will determine the strength of our instruments.
More formally, the instrumental variable we use to predict the change in the share of international students for field of study by university time is:
∆Pijt =∑(Fcij0/Fc0)∆Fct
N
c=1
(2)
where we use the initial field of study by university distribution of foreign students from country c in time period 0, (Fcij0/Fc0) to allocate the subsequent flow of foreign students from that country
20
between period t and t+1 (∆Fct). We set the initial period to be the academic years from 1994/95 to 1998/99 and predict future annual flows from 2001/02 to 2011/12 to each university subject area. The year on year by university subject area variation generated from a combination of national inflow figures and the historical shares at university subject areas. This predicted change in international students at the university field level is then normalised by the lagged total number of students enrolled, in order to make it consistent with the other variables.
We generate two instrumental variables. The first, IV1, groups all Non-EU countries together as one category.28 In this case c is an indicator for originating from a non-home fee
paying country. Therefore we are simply exploiting the share of international students at each university subject area and the annual changes in international students nationally. The second, IV2, uses the shares of students from each country, so in this case c represents the country of origin.
The country specific instrument has the benefit that it allows for specific country university subject relationships. For example, if the science department at University U has a higher than average proportion of the national total of students from country Z, then when the total amount of students from country Z increases nationally we expect a larger than average increase in the number of overseas science students at University U. Furthermore if another country Y which has no students at University U had an increase in their student numbers, this would not affect the number of overseas students at university U. Contrary to this method IV1
28 Eleven countries joined the EU during the main period of analysis covering 2001/02 to 2011/12. For the purposes of constructing the instruments, all of these students were counted at Non-EU students as that was their status during the period of time over which the initial period is defined (1994/95-1998/99). Students from these countries account for 0.3% of the entire population over the entire period. Given their very small numbers, counting them as EU students or excluding them makes negligible differences to the final results. Further details can be found in the Data Appendix Section E.
21
would use the share of international students as a whole, and any increase in the number of students from country Y at the national level would be in part allocated to university A.
A potential disadvantage of the IV2 method is that specific country university subject area pairs may be more liable to change over time compared with a measure based on the proportion of international students, such as IV1. Even though these shares were generated over a four year period between 1994/95 and 1998/99, some countries had little to no representations in some cells that have subsequently become more prominent. Therefore IV1, picking up on the general international nature of the student body of the university, could be more reliable.
The key assumption underlying this empirical approach is that the national inflow rates from each source country are exogenous to conditions in a particular university department. This is likely to be the case given that we have 570 university subject cells, each only contributing a small amount to the total. Both the total international and country specific shares have their advantages and disadvantages, therefore we initially implement IV1 and then use both instruments simultaneously to predict changes in international students.
The shift share approach assumes that historical shares of students at university departments are informative in predicting current flows. Empirically, it turns out that this is typically true as the results show that the location patterns of past students from a particular origin country are strongly reflective of where later students chose to study. However, for reasons already discussed, this is not so likely to hold for China which is an important country during this period of expansion because of changing subject preferences. Prior to 1998 the majority of Chinese students were granted a student visa if their choice of course was supported by the state, typically in the physical sciences. However, once self-sponsorship became easier, the numbers of Chinese students studying Business or Economics increased very rapidly indeed.
22
We thus implement a separate empirical analysis that studies inflows of Chinese students in detail and implements an alternative instrumental variable strategy based on the Chinese policy change combined with subject preferences to generate a source of exogenous variation in the change in number of Chinese students attending UK universities. Post 1998/99 we would expect the number of international students to increase in subjects preferred by Chinese students more than others.
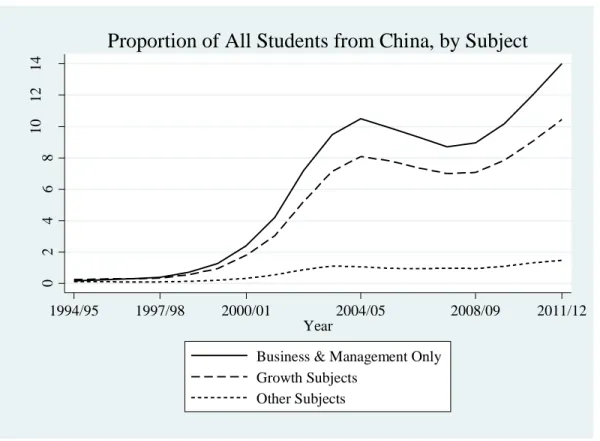
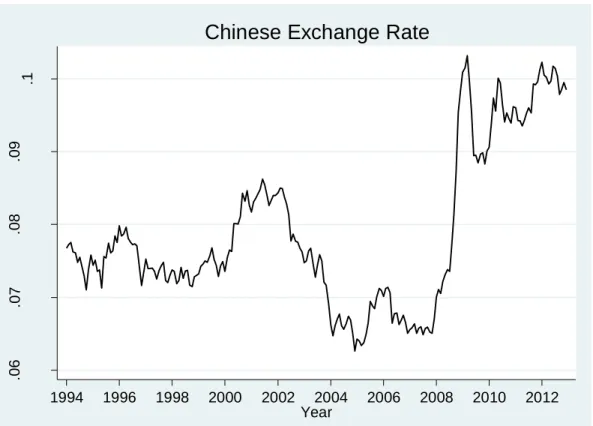
Figure 4 shows big increases in the proportion of Chinese students enrolling in Business & Management and in the big 4 growth subjects (Business & Management, Maths & Computing, Economics and Engineering) compared to the rest (Other Subjects). Figure 4 also (like the earlier Figure 3) shows that the majority of the growth occurs in the early 2000s. For example, in 1998/99 Chinese students represented less than 1 percent of total students studying Business & Management. By 2004/05 this had increased to over 10 percent. A second strong growth phase occurred from 2008/09 to 2011/12 after the Chinese Yuan appreciated 80 percent against the British Pound during 2008 (see Figure A3 of Appendix A). This is indicative that the supply of self-sponsored Chinese students is related to the exchange rate.
To show the (increased) price sensitivity, as Chinese students became more self-sponsored, we run a set of simple regressions of the Pound-Yuan exchange rate on proportional change in Chinese students in UK departments before and after the visa reforms. Table 2 presents these estimates of price sensitivity of Chinese students for growth subjects and other subjects separately. The results contained in the Table show that, prior to the reform when Chinese students were predominantly funded by their Government, the changes in the number of Chinese students were uncorrelated with the exchange rate. However post reform there is a significant positive correlation between increases in the number of Chinese students and Pound-Yuan
23
exchange rates. This change was highest for undergraduate and taught postgraduate students. Moreover, it is these growth subjects that are the most sensitive to exchange rate fluctuations. The price sensitivity of undergraduates in growth subjects increased by at least 25 percentage points after the reform, compared with 4 percentage points for non-growth subjects. In contrast we can see from the estimates in the last three columns that the decision to enrol in research postgraduate courses do not appear to be significantly impacted by the exchange rate.
Therefore our second instrumental variable strategy exploits the growth in Chinese students in these growth subjects post the reform and the impact of exchange rates. To do this, we generate an indicator variable for each growth subject post reform, interacted with the Pound-Yuan exchange rate. Here we use a more detailed subject grouping, k, now covering twelve categories, replacing the previous five departmental categories, j, thereby allowing us to separately distinguish the ‘growth subjects’ of Business & Management, Economics, Maths and Computing, and Engineering (see the numbers on these in Table 1). Now the independent variable of interest becomes changes in the number of Chinese students C, at each university subject area and we also include a set of year and university subject fixed effects to estimate the following equation:
(Dikt - Dik,t-1)/Sik,t-1 = αik+ β2(Cikt - Cik,t-1)/Sik,t-1 + Tt + εikt (3) In producing the instrumental variable estimates, the change in the number of Chinese students is instrumented using the growth subject post reform variable interacted with the exchange rate. The variation across subjects in the instrument ensures that there is variation within year. To clarify the instrument is an indicator variable for growth subject and years post reform multiplied by exchange rate. This means the instrument has variation at the level of field by university by year. The year fixed effects absorbs the average growth rate across all
24
departments at all universities in that year. The institution-field effects absorbs the average growth rate of that institution-field across all the years of analysis (1994/5-2011/12). This means the instrument is picking out the divergence from average growth of the growth subjects at these institutions. Given that research postgraduates are less impacted by the exchange rate, their respective instruments are likely to be less predictive. As we do not need historical shares for this approach, the period of analysis is based upon studying annual changes throughout the entire period from 1994/95-2011/12.
5. Results
University Level Estimates
We begin our empirical analysis by considering results from aggregate university level (i.e. with no subject if study variation) regressions of the change in the number of domestic students on the change in the number of foreign students instrumented using the IV1 variable. Table 3 shows separate estimates for undergraduates, taught postgraduates and research postgraduates. Two specifications are reported for each, one where the dependent variable is the proportional change in the number of home students (i.e. UK and EU students) and one where it is the proportional change in the number of domestic students (i.e. UK only). The first row of Table 3 shows ordinary least squares (OLS) estimates, and the second row shows the two stage least squares (2SLS) estimates. The first stages, using the broad category instrument IV1, corresponding to the latter (which are the same for the home and domestic specifications) are reported below these, together with associated F-statistics for the instruments.29
25
The first thing to note from Table 3 is that all the OLS coefficients are estimated to be positive. For taught and research postgraduates they are statistically significant. However, for the reasons articulated above, we need to consider what happens when we allow for common shocks to affect both changes in domestic and foreign students via our instrumental variable strategy. Adopting this approach, the first stage is estimated to be positive for all types of degree and is significant for undergraduates and taught postgraduates. The second stage estimates vary across the type of degree, with different estimated effects at undergraduate and postgraduate (taught and research) stages. We find that there is significant crowd in at the university-degree type level, for postgraduate courses and insignificant crowd in for undergraduates. This implies that departments are not drawing additional students from other fields from within the university, but are enrolling additional domestic students from outside of the university. This makes sense in the UK system where it is difficult for students to change subjects once enrolled.
The results in this Table come from only considering variation by phase of education at the university level.30 However, as we have already discussed, we also expect there to be important variations by subject that reflect within university foreign student preferences. Thus we next move to our main results from the field of study by university panel analysis, which we also study separately by university education phase of study.
30 As becomes clear in the next set of results we report, the university wide IV estimates turn out to be not as precise as those where we also use within-university field of study variations. If an aggregate university wide regression putting together the three phases of education was also estimated, this is even more the case. The estimated coefficient (standard error) in this IV regression was positive and statistically insignificant at 0.120 (0.423) for home students and 0.319 (0.400) for domestic student. The first stage was significant and positive with an F-statistic of 15.46.
26 University by Field of Study Panel
Table 4 shows estimates of equation (1) for undergraduates, taught postgraduates and research postgraduates. Exploiting the variations at (broad) field of study level clearly generates more variation and produces better determined estimates. All the OLS coefficients are estimated to be positive and statistically significant. In terms of the instrumental variable estimates, the F-tests reported for the first stage show the instruments to be good predictors of the change in foreign students (they are all above 20, and some twice that). Clearly they are stronger than at university level, so that transposing over the enclave idea that has been exploited in the immigration literature to the inflow of foreign students to specific fields of study and university seems to work well. Moreover, the positive enclave effect is intuitively plausible (i.e. that foreign students go to study the same subjects in the same universities as previous international students did). Interestingly, the 2SLS estimates are, like the OLS estimates, all positive as well. Thus our evidence is much more in line with the notion of crowding in, where foreign students bring in additional income that can be used to cross-subsidise domestic students, rather than crowding out.
However, the pattern of causal estimates across the three groups of students reveals differences. For undergraduates, the 2SLS estimate falls close to zero and is no longer significant, meaning there is on average neither crowd out nor crowd in of home/domestic students. These are the groups of student for which universities face maximum quotas, as detailed above.
For postgraduate students, where universities have more freedom to vary the number of home students, there is evidence of crowding in. For home research students the 2SLS coefficient of 1.06 is not significantly different from the OLS estimate of 0.94. This implies that for every
27
additional overseas research student, a university department on average takes on an additional home student. The coefficient above unity for the taught postgraduates is suggestive that Master’s courses are the major areas where cross-subsidisation occurs.31
Heterogeneity by University Type
The extent of these crowd-in or crowd out effects may well vary across types of universities. Therefore Table 5 reports separate estimates for the 20 more selective Russell Group and 124 non-Russell Group universities in our sample.32 The evidence of crowd in seems to be more marked for the former group. This is not so surprising given that these universities have higher international recognition and so can charge higher international tuition fees for both undergraduates and postgraduates. One could interpret the positive coefficient for undergraduates in the Russell Group as evidence that these universities are willing (if need be) to pay the HEFCE fines in order to expand. Moreover, these institutions are also the ones most likely to charge tuition fees for domestic taught postgraduate students above the threshold amount (£7542) meaning that they can expand their domestic numbers if desired. Universities who charge under this amount, which is typical for Non-Russell Group universities would be required to count all home postgraduate students against the quota and therefore could not expand. For Research Postgraduates, where there are no caps on domestic students, we see little difference between Russell and non-Russell group universities, with both having significant positive estimates.
31 If additive university fixed effects and subject fixed effects rather than the fully interacted university by subject fixed effects were entered into the estimating equations results proved to be qualitatively the same. These are shown in Table A1 of Appendix A.
32 The full set of results, structured in the same way as Table 3 for the Russell Group and non-Russell Group universities are reported in Tables A2 and A3 of Appendix A.
28 Tests of Robustness
The main set of results presented in Tables 4 and 5 use a single instrument IV1, the historical share of overseas students enrolled in a university field multiplied by current year on year changes in the total number of overseas students nationally. However, we also calculated a second instrument, IV2, which uses the historical shares in university fields from 75 countries multiplied by their respective national changes, and summed together to generate an alternate measure of annual change in overseas students. In Table 6 we present the estimates on the impact on home students of changes in overseas students, instrumenting using only IV1 or IV2 and then both together.
The first row repeats the OLS estimates from Table 4, the next presents the 2SLS estimates using the three different combinations of excluded instruments, with the first stages presented below. Starting with the first stages, we can see that both instruments individually are significant predictors of changes in international students within a university field, albeit with the second instrument having a consistently lower F-statistic. When using both simultaneously only one instrument remains significant for undergraduates and taught postgraduates, but both remain significant for research postgraduates. The decline in significance is likely due to the high correlation between the two measures.
The high correlation between these shift-share instruments is reflected in the 2SLS estimates not being significantly different from each other across the three instrument specifications. Again, we find that despite the significant OLS estimates for undergraduates there is no significant relationship between the changes in the proportion of home students and the equivalent changes in overseas students. For graduate students (taught and research) we find that the positive significant relationship continues to hold. The 2SLS estimates are consistently larger
29
for taught postgraduates compared to research postgraduates. This may be indicative of the actual comparative relationships, or could be an artefact of the instruments being a worse predictor of changes for taught postgraduates and so have smaller first stage parameters.
Increases in the Number of Chinese Students
We next move to the analysis of Chinese student inflows. To do so the estimating equation is structured as before, but the key independent variable of interest becomes changes in the number of Chinese students, which is instrumented by the policy change that made it significantly easier for Chinese to self-sponsor for overseas studies combined with strong revealed subject preferences and price sensitivity.33 We look at estimates from two measures of subject preference, the first looking at the biggest growth subject, Business & Management, and the second at the big 4 growth subjects we earlier identified.
Table 7 shows estimates of equation (3). The Table is structured in a similar way to Table 4, with OLS estimates in the first row, 2SLS estimates in the second and the first stages from the latter below. The upper panel shows the estimates for Business & Management, the lower panel for the big 4 growth subjects. In the top part of Table 7, the OLS estimates all have positive estimated coefficients. For both subject groupings, in Panel A and B respectively, the first stages using the reform-subject-exchange rate instruments are strong, with sizable F tests of the excluded instruments for undergraduates and taught postgraduates. On the other hand, the predictive power of the reform-subject-exchange rate instruments was very weak for research postgraduates, and for this reason we have excluded them from this part of the analysis.34
33 We replicate the previous analysis using the historical share of Chinese students in conjunction with current changes of total Chinese students to predict changes in total number of international students and obtain similar results to before. See Appendix Table A4.
34 The F-Statistics for the first stage estimates for postgraduate students were 0.73 and 3.98 for Business and all the
30
The 2SLS estimates from the undergraduate and taught postgraduate regressions are both positive, although the undergraduate estimate is not significant and has large standard errors. The taught postgraduates estimate is larger in magnitude to the earlier results and offers evidence of crowd in, which in particular is strong for the specification based on the big 4 growth subjects. It is important to note that this is a different parameter from the one we previously estimated for all foreign students, as it is the reaction to Chinese students in particular subjects. Nonetheless, the results show that the increased enrolment of Chinese students on Master’s courses has become an important factor in generating income streams for UK universities that have also enabled universities to take on more domestic students in this taught postgraduate phase of university education.
The estimated 2SLS coefficients for research postgraduates are large and imprecisely estimated, especially for Business & Management only, owing to the weak first stage. To hone in on this narrow group is probably asking too much of the data, most likely because of the relatively small increases in the number of Chinese students undertaking research degrees. But, even here, the lack of any negative coefficients means we can uncover no evidence for the hypothesis that foreign students have crowded out domestic students in UK universities. Thus both of our causal approaches reach the same qualitative conclusion.
6. Conclusions
The globalisation of HE has been one of the most striking features of education systems across the world. In this paper we look at one of the largest “importers” of foreign students, the UK, presenting empirical work looking at whether their increased enrolment and paying out of high fees has had an impact on the enrolment of domestic students. We frame this as a question of
31
whether one can detect any evidence that their increased numbers have displaced domestic students or whether their increased numbers have gone hand-in-hand with increased numbers of domestic students.
To properly consider this question, it is important to set up a research design that allows for common shocks that cause numbers of domestic and foreign students to covary with one another and to address the endemic sorting issues to do with changes in the numbers of foreign students from different origin countries. We do this in two ways. First, in a manner similar to that adopted in the immigration literature, we use the historical share of students from a sending country attending a university department combined with current national changes in the stock of students from this country as a shift-share instrument. Secondly, we use an exogenous change in the Chinese visa regulations and exchange rate in combination with strong revealed subject preferences as a predictor of overseas student growth.
Using administrative data on the entire UK HE population over the 1994/95 to 2011/12 academic years, in both of these approaches we find no evidence that the big rise in international students enrolling in UK universities has crowded out domestic students. This is the case at undergraduate level and for taught and research postgraduates. Indeed, in the case of postgraduates we find evidence of subsidisation, especially on Master’s programmes where numbers of domestic and foreign students have covaried positively with one another as both have increased significantly through time. For undergraduates, there is neither evidence of crowding in nor crowding out. We interpret this as resulting from the government quotas on the number of domestic students that operated in the time period we study.