The Later Stages of Transition over a NACA0018
Airfoil at a Low Reynolds Number
by
Thomas M. Kirk
A thesis
presented to the University of Waterloo in fulfilment of the
thesis requirement for the degree of Master of Applied Science
in
Mechanical Engineering
Waterloo, Ontario, Canada, 2014
c
I hereby declare that I am the sole author of this thesis. This is a true copy of the thesis, including any required final revisions, as accepted by my examiners.
Abstract
The later stages of separated shear layer transition within separation bubbles developing over a NACA0018 airfoil operating at a chord Reynolds number of 105 and at angles of
attack of 0, 5, 8, and 10 degrees were investigated experimentally in a wind tunnel. Several experimental tools, including a rake of six boundary-layer hot-wire anemometers, were used to perform measurements over the model.
Novel high-speed flow visualization performed with a smoke-wire placed within the separated shear layer showed that roll-up vortices are shed within separation bubbles forming on the suction side of the airfoil. The structures were found to convect downstream and eventually break down during laminar-to-turbulent transition. Top view visualizations revealed that, at angles of attack of 0, 5, and 8 degrees, roll-up vortices form coherently across the span and undergo significant spanwise deformations prior to breaking down. At angles of attack of 5 and 8 degrees, rows of streamwise-oriented structures were observed to form during vortex breakdown.
Statistics regarding the formation and development of shear layer roll-up vortices were extracted from high-speed flow visualization sequences and compared to the results of boundary layer measurements. It was found that, on the average, roll-up vortices form following the initial exponential growth of unstable disturbances within the separated shear layer and initiate the later stages of transition. The onset of these nonlinear stages was found to occur when the amplitude of velocity disturbances reached approximately 10% of the free-stream velocity. The rate of vortex shedding was found to fall within the frequency band of the unstable disturbances and lie near the central frequency of this band. The formation of vortices has been linked to the generation of harmonics of these unstable disturbances in velocity signals acquired ahead of mean transition. Once shed, vortices were found to drift at speeds between 33% and 44% of the edge velocity.
Vortex merging at an angle of attack of 5◦ was investigated. It was found that the majority of roll-up vortices proceed to merge with either one or two other vortices. Vortex merging between two and three vortices was found to occur periodically in a process similar to vortex merging in plane mixing layers undergoing subharmonic forcing of the most amplified disturbance.
The flapping motion of the separated shear layer was investigated by performing a cross-correlation analysis on the high-speed flow visualization sequences to extract vertical displacement signals of the smoke within the shear layer. The frequency of flapping was found to correspond to the unstable disturbance band. At an angle of attack of 5◦, it was found that the separated shear layer has a low-frequency component of flapping that matches a strong peak in velocity and surface pressure spectra that lies outside the unstable
The spanwise development of disturbances was assessed in the aft portion of the separation bubbles by performing a cross-correlation analysis on signals acquired simultaneously across the span with the rake of hot-wires. The spanwise correlations between signals was found to be well-correlated ahead of shear layer roll-up, after which disturbances became rapidly uncorrelated ahead of mean reattachment. These results were found to be linked to the coherent roll-up and subsequent breakdown of roll-up vortices.
Acknowledgements
My supervisor, Serhiy Yarusevych, deserves a big thanks for all his enthusiasm, insight, help, and patience throughout my Master’s. I have never worked with anyone more thorough. While I still have a lot to learn and improve on, he has been a great influence.
I would like to thank my fellow low-speed aerodynamics graduate student colleagues, Holly Neatby and Andrew Lambert, for all their help and cooperation throughout the past couple years.
Thank you, Chris Morton, our resident Ph.D. student, for all those lengthy discussions on signal processing and fluid mechanics. While some of the fruits of our discussions did not ultimately make it into this document, they were very helpful and still have potential.
I would like to thank my fellow graduate students, Manpreet Bansal, Brian Kettlewell, David Sommer, Jeff McClure, Sahil Mahey, and Eugene Zivkov, for your companionship and for exposing me to your areas of research.
Thank you, laboratory staff members, Jim Merli, Jason Benninger, and Neil Griffet, for all your technical and logistical help regarding the experimental facility, equipment, and airfoil model. Student shop technicians, Mark Kuntz, Phil Laycock, and Andrew Urschel, thank you for all your help with the fabrication of parts used in my experiments.
B¨ulent Yaniktepe, thank you for all your help with flow visualization during your visit in 2013.
I would like to thank research group alumni, Michael Boutilier and Ryan Gerakopulos, for all their help at different stages of this project. Also, Ryan, thank you for developing the top notch airfoil model.
Lastly, I would like to thank the Natural Sciences and Engineering Research Council of Canada and Bombardier Aerospace for their financial support and interest in this investigation.
Dedication
I would like to dedicate this thesis to my mother, Laura, my father, John, and, my sister, Anna. Despite the relative occultness of this research area, you have each shown enthusiasm and have been extremely supportive and understanding since I began this project over two years ago.
I would also like to dedicate this work to my family in Buenos Aires, especially my grandparents, Ebe and Martha, who despite the distance are always there for me, and my grandfather in Winnipeg, Bryan, who is always keen to hear what I’m up to and shares a love of aviation.
Table of Contents
List of Tables xiii
List of Figures xvii
Nomenclature xix
1 Introduction 1
2 Background 5
2.1 Airfoil Operation at Low Reynolds numbers . . . 5
2.2 Structure of the Laminar Separation Bubble . . . 7
2.3 Separated Shear Layer Transition . . . 9
2.3.1 The Early Stage of Transition . . . 10
2.3.2 The Later Stages of Transition . . . 12
3 Experimental Methodology 17 3.1 Experimental Setup . . . 18
3.1.1 University of Waterloo Low Speed Wind Tunnel . . . 18
3.1.2 NACA0018 Airfoil Model . . . 19
3.2 Measurement Techniques . . . 21
3.2.1 Static Surface Pressure Measurements . . . 22
3.2.2 Fluctuating Surface Pressure Measurements . . . 22
3.2.3 Velocity Measurements . . . 23
3.3 Flow Visualization . . . 25
4 Results 29 4.1 Flow Visualization . . . 29
4.2 Streamwise Flow Development . . . 37
4.2.1 High-Speed Flow Visualization . . . 38
4.2.2 Boundary Layer Measurements . . . 47
4.2.3 Vortex Merging . . . 71
4.2.4 Shear Layer Flapping . . . 79
4.3 Spanwise Flow Development . . . 81
4.3.1 High-Speed Top View Flow Visualization . . . 81
4.3.2 Cross-Correlation Analysis . . . 88 5 Conclusions 95 6 Recommendations 99 REFERENCES 103 APPENDICES 113 A Experimental Uncertainty 115 A.1 Uncertainty in Experimental Setup . . . 115
A.2 Uncertainty in Flow Visualizations . . . 117
A.3 Uncertainty in Static Pressure Measurements . . . 118
A.4 Uncertainty in Microphone Measurements . . . 119
A.5 Uncertainty in Velocity Measurements . . . 120
A.6 Uncertainty in Determining the Central Frequency of the Unstable Disturbance Growth Frequency Band . . . 122
A.7 Uncertainty in Estimating Cross-Correlation Coefficients . . . 122
B Influence of Experimental Setup 125 B.1 Intrusiveness of Flow Visualization . . . 125
B.2 Intrusiveness of Velocity Measurements . . . 131
List of Tables
3.1 Model solid blockage ratio . . . 21 3.2 Streamwise and vertical positions of the smoke-wire in the second configuration 26 4.1 Summary of data obtained from side view high-speed visualizations . . . . 47 4.2 Mean separation, transition, and reattachment locations and uncertainty
estimated from surface pressure distributions . . . 49 4.3 Estimated central frequency and bandwidth of unstable disturbance band . 64 4.4 Frequency and relative frequency of roll-up associated of vortex merging
events associated to instances of shear layer roll-up for α= 5◦. . . 75 A.1 Summary of measurement uncertainty estimates . . . 116
List of Figures
2.1 Flow regimes of airfoils operating at low Reynolds numbers . . . 6
2.2 Time-averaged laminar separation bubble representation . . . 8
2.3 Typical suction side surface pressure distribution over an airfoil with a laminar separation bubble. . . 9
3.1 University of Waterloo adaptive-wall wind tunnel . . . 18
3.2 Airfoil model and definition of coordinate systems . . . 19
3.3 Locations of microphones embedded into NACA0018 airfoil model . . . 20
3.4 Isometric view of positioning traverse and hot-wire probes . . . 24
3.5 Hot-wire placement in the rake . . . 24
3.6 Schematics of smoke-wire flow visualization setups . . . 25
3.7 Schematic of streamwise smoke-wire flow visualization laser sheet setup . . 27
4.1 Upstream smoke-wire flow visualization for α= 0◦ . . . 31
4.2 Upstream smoke-wire flow visualization for α= 5◦ . . . 31
4.3 Upstream smoke-wire flow visualization for α= 8◦ . . . 32
4.4 Upstream smoke-wire flow visualization for α= 10◦ . . . 32
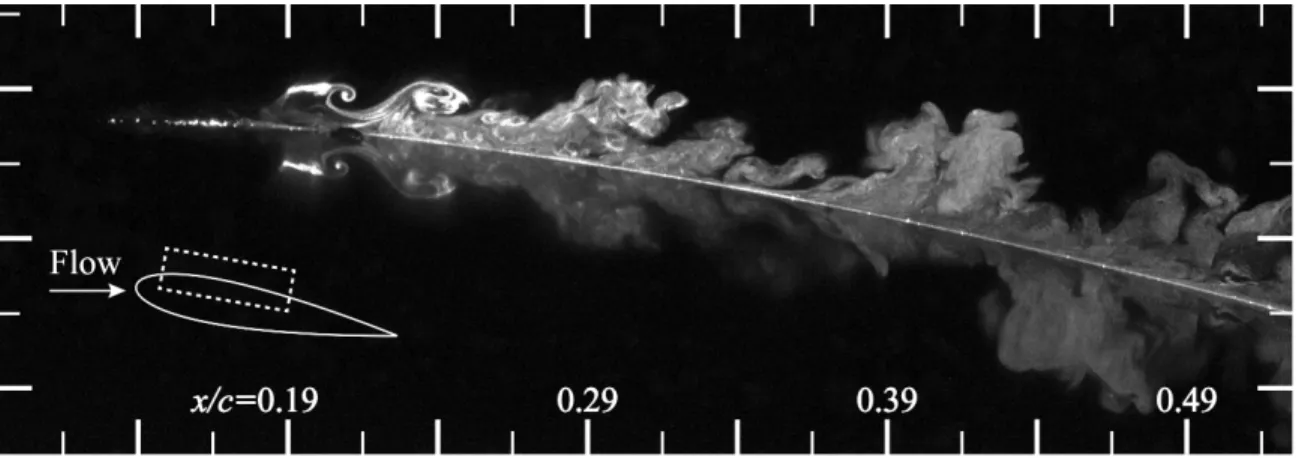
4.5 Side view separation bubble visualization for α= 0◦ . . . 33
4.6 Side view separation bubble visualization for α= 5◦ . . . 33
4.7 Side view separation bubble visualization for α= 8◦ . . . 33
4.8 Side view separation bubble visualization for α= 10◦ . . . 34
4.9 Top view separation bubble visualization for α= 0◦ . . . 35
4.10 Top view separation bubble visualization for α= 5◦ . . . 35
4.11 Top view separation bubble visualization for α= 8◦ . . . 36
4.12 Top view separation bubble visualization for α= 10◦ . . . 36
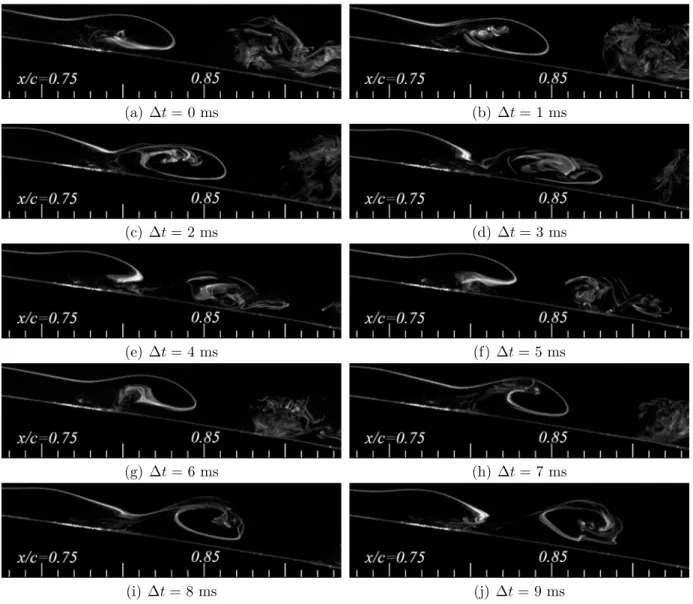
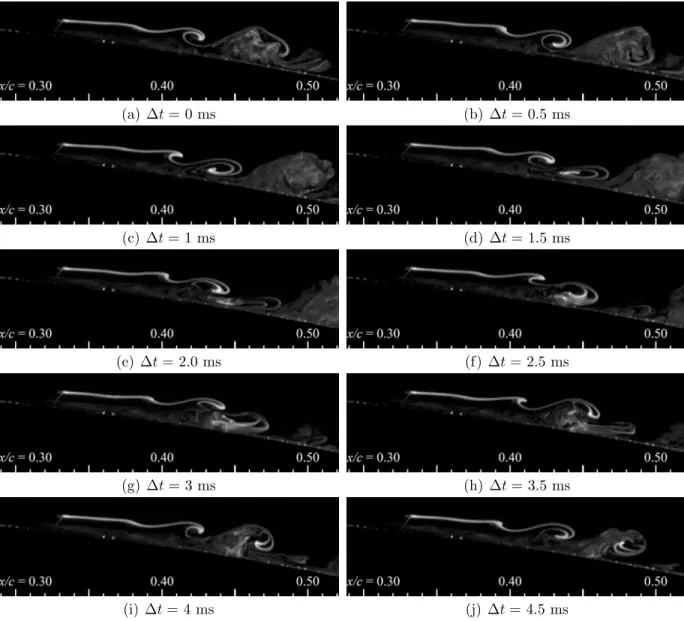
4.13 Sequence of high-speed images displaying vortex shedding at α= 0◦. . . 39
4.14 Sequence of high-speed images displaying triple vortex merging at α= 5◦. . 40
4.15 Sequence of high-speed images displaying vortex shedding at α= 8◦. . . 41
4.17 Example of breaking wave used in streamwise roll-up position estimation
and histogram of xroll/c at α= 5◦. . . 44
4.18 Vortex shedding frequency and vortex shedding Strouhal number plotted against α . . . 45
4.19 Drift speed of vortices nondimensionalized by free-stream and edge velocity 46 4.20 Model surface pressure distributions . . . 48
4.21 Mean separation, transition, and reattachment locations and separation bubble length plotted against α . . . 50
4.22 Mean and RMS velocity profiles for α= 5◦ . . . 52
4.23 Mean and RMS velocity profiles for α= 8◦ . . . 53
4.24 Streamwise development of boundary layer parameters . . . 55
4.25 Sreamwise development of RMS velocity and RMS fluctuating surface pressure 58 4.26 Velocity and surface pressure spectra for α= 0◦ . . . 61
4.27 Velocity and surface pressure spectra for α= 5◦ . . . 62
4.28 Velocity and surface pressure spectra for α= 8◦ . . . 63
4.29 Comparison between the vortex shedding frequency and central disturbance band frequency . . . 66
4.30 Histograms showing the relative frequency distribution of the period between consecutive instances of shear layer roll-up . . . 68
4.31 Cross-correlation coefficient functions computed from simultaneously acquired surface pressure signals . . . 69
4.32 Normalized accumulated time lag computed from cross-correlations of surface pressure signals . . . 70
4.33 Sequence of high-speed flow visualizations at α= 5◦ showing the merging of two roll-up vortices. . . 72
4.34 Sequence of high-speed flow visualizations at α= 5◦ showing the merging of three roll-up vortices. . . 73
4.35 Sequence of high-speed flow visualizations at α= 5◦ showing a vortex that does not merge after formation. . . 74
4.36 Estimated roll-up x/c locations plotted against time for α = 5◦. Events associated to each instance of roll-up are marked. . . 76
4.37 RMS velocity of unfiltered and bandpass filtered signals forα = 5◦ . . . 78
4.38 Spectra computed from vertical displacement signals of smoke within the separated shear layer upstream of roll-up . . . 80
4.39 Sequence of top view high-speed flow visualizations acquired at α= 0◦ . . 83
4.40 Sequence of top view high-speed flow visualizations acquired at α= 5◦ . . 85
4.42 Cross-correlation coefficient functions computed from velocity signals acquired simultaneously across the rake of hot-wires at α= 0◦ . . . 89 4.43 Cross-correlation coefficient functions computed from velocity signals
acquired simultaneously across the rake of hot-wires at α= 5◦ . . . 90 4.44 Cross-correlation coefficient functions computed from velocity signals
acquired simultaneously across the rake of hot-wires at α= 8◦ . . . 91 4.45 Correlation coefficients computed from velocity signals acquired
simultaneously with the rake of hot-wires . . . 93 A.1 Standard deviations of cross-correlation coefficients computed individually
from the 256 windows used in computing the averaged value of ρ(τ) . . . . 123 B.1 Effect of smoke-wire separation bubble visualization on pressure distribution 126 B.2 Effect of smoke-wire separation bubble visualization on RMS fluctuating
surface pressure . . . 128 B.3 Effect of smoke-wire separation bubble visualization on surface pressure spectra130 B.4 Influence of the rake of hot-wire probes on surface pressure distributions
when placed within the boundary layer. . . 133 B.5 Influence of the rake of hot-wire probes on fluctuating surface pressure spectra
when placed within the boundary layer at α= 5◦ . . . 134 B.6 Spectra of hot-wire velocity measurements obtained within the free-stream
Nomenclature
B model blockage ratio, computed from the quotient of projected area of model with and without end plates onto a streamwise normal plane and test section cross sectional area
b spanwise distance between the end plates
Cp model pressure coefficient,Cp = (P −P∞)/q∞
c chord length
d projected model height
Epp normalized energy spectrum of surface pressure fluctuations
Euu normalized energy spectrum of streamwise velocity component
f frequency, Hz
ff ilter range of passband of band-pass filter, Hz
fshedding vortex shedding frequency, Hz
f0 central frequency of unstable disturbance band
H boundary layer shape factor, H=δ∗/θ L separation bubble length, L=xR−xS
P mean surface pressure at a location on the model surface
Pw mean surface pressure at a location on the test section wall
P∞ free-stream static pressure
p fluctuating component of pressure
p0 root-mean-square surface pressure
q∞ free-stream dynamic pressure,q∞= 12ρU∞2
Rec chord Reynolds number, Rec=U∞c/ν
Stshedding Strouhal number based on rate of vortex shedding, projected model height
and free-stream velocity,St =fsheddingd/U∞
U time-averaged streamwise component of velocity
Uc convection speed of pressure fluctuations
Udrif t drift speed of shear layer vortices
Ue∗ edge velocity in laminar portion of separation bubble, Ue∗ ≈U∞ p
1−Cp
U∞ free-stream velocity
u streamwise component of velocity fluctuations
uf uof band-pass filtered signals
u0, u0f root-mean-square ofu and uf
t time
Troll period between consecutive instances of shear layer roll-up
X distance measured from the model axle in the streamwise direction
xroll xlocation of onset of shear layer roll-up
xR meanxlocation of reattachment obtained from surface pressure distributions
xS meanx location of separation obtained from surface pressure distributions
xT meanx location of transition obtained from surface pressure distributions
Y vertical distance from the model axle
y distance from the model surface
Z spanwise distance from the model mid-span plane towards the wind tunnel Plexiglas side
α angle of attack, degrees
∆y discrete velocity profile point spacing
δe edge thickness, i.e., they location at which U =Ue
δ∗ boundary layer displacement thickness,δ∗ =Rδe
0 (1−U/Ue)dy
ν kinematic viscosity
ρ density of air in the test section
ρ(τ) cross-correlation coefficient function
ρ(0) cross-correlation coefficient
τ time lag
τ∗ accumulated time lag
θ boundary layer momentum thickness,θ =Rδe
Chapter 1
Introduction
The aerodynamic performance of airfoils operating at low chord Reynolds numbers (i.e. 104 < Rec <105) is an important consideration in the design of unmanned aerial
vehicles (UAVs), micro-air vehicles (MAVs), and small wind turbines [1–3]. At this range of Reynolds numbers, a laminar boundary layer developing over the suction side of an airfoil is likely to separate closer to the leading edge, while at larger Reynolds numbers this may occur closer to the trailing edge within a turbulent boundary layer [2]. The effect of flow separation results in a reduction of the lift-to-drag ratio through lowering of lift and increasing drag [2]. This decrease in performance has led to the development of flow control techniques, which utilize active or passive methods to reduce the losses experienced at these low Reynolds numbers, e.g. [4, 5]. In some cases, boundary layer separation can also lead to the generation of an undesirable tonal noise produced at the trailing edge of an airfoil [6].
Laminar boundary layer separation over airfoils operating at low Reynolds numbers leads to flow development that may be classified into two regimes. The first regime occurs when the separated flow fails to reattach causing the airfoil to stall. This regime is characterized by a significant performance drop due to a decrease in the lift force produced over the suction side combined with a sharp increase in drag [2]. This decrease in the lift coefficient,CL, occurs when the angle of attack is increased above a critical angle at which
the maximum lift, CL,max, is generated causing the airfoil to stall [1]. The second flow
regime occurs when the separated flow reattaches, leading to the formation of a separation bubble. The separation bubble regime tends to occur above a critical Reynolds number, where reattachment is possible [1, 2]. The extent and position of the bubble is dependent on airfoil shape, Reynolds number, and angle of attack [2]. In most cases, the presence of a separation bubble results in a reduction in lift through a decrease in suction over the airfoil’s upper surface [1]. However, the position of the separation bubble may cause
either an increase or a reduction of the lift slope when compared to thin airfoil theory [7]. In the case where the separation bubble forms sufficiently far downstream towards the trailing edge, aerodynamic performance has been shown to increase when compared to a fully turbulent flow over the airfoil [7]. In contrast, a separation bubble positioned near the leading edge lowers the lift force and results in a lower lift slope, which varies nonlinearly [7]. Furthermore, experimental studies have found that the presence of a separation bubble introduces hysteresis into lift slope curves acquired for airfoils tested in free-streams with low turbulence intensities [8]. The different aspects of airfoils operating at low Reynolds number combined with the complexities introduced by the separation bubble regime make it considerably difficult to model flow development and ultimately aerodynamic performance. Thus, the accurate prediction of performance curves, which account for any nonlinear trends and hysteresis, is the subject of ongoing research aimed at improving aerodynamic design tools [9].
To improve the aerodynamic performance of airfoils operating at low Reynolds numbers, it is important that the laminar-to-turbulent transition process occurring within the separated shear layer be understood [3, 5]. Following separation, a laminar separated shear layer undergoes transition to turbulence. The re-energized shear layer will either remain separated or re-attach to form a redeveloping turbulent boundary layer. The location of transition is an important factor in determining whether the flow reattaches. The initial stage of transition over an airfoil is defined by the exponential growth of disturbances within the separated shear layer linked to an inviscid Kelvin-Helmholtz (KH) instability. This disturbance growth is relatively well understood, and has been shown to be accurately modelled by linear stability theory (LST) [10–12]. However, the stages following this initial disturbance growth ultimately lead to transition, and are still the subject of ongoing research, e.g. [13].
This thesis aims to further investigate the later stages of transition within the separation bubble developing over an airfoil operating at a low Reynolds number. Until this time, studies on airfoils have shown that, following the initial disturbance growth, the separated shear layer tends to roll-up into coherent vortices, which then break down to turbulence [14–17]. These studies have demonstrated that there are notable discrepancies in aspects regarding the formation and development of roll-up vortices. Some investigations have observed highly three-dimensional secondary structures, which form during the breakdown of roll-up vortices, tend to persist past the transition location [14, 18–20], while other studies have found that roll-up vortices break down directly into small-scale turbulence [15, 21]. Shear layer roll-up has been shown to initially occur mostly two-dimensionally [22–26], however, as the roll-up vortices convect downstream, they have been shown to deform significantly across the span prior to breaking down [13, 27]. The formation and development of roll-up vortices has been shown to be dependent upon angle of attack [14, 21], Reynolds number [14], and free-stream
turbulence intensity [14, 15], which is expected due to the influence of these conditions on separation bubble formation. In spite of this, the number of studies investigating this phenomenon are limited to few geometries and a small range of Reynolds numbers and angles of attack. Thus, one of the objectives of the present study is to investigate roll-up vortices developing over a different geometry for a large range of angles of attack.
The instability mechanisms, which drive laminar-to-turbulent transition within laminar separation bubbles, has been the subject of ongoing research focused primarily on flows over airfoils [15, 20] and flat plates [13, 26, 28, 29]. These studies have found that secondary instabilities lead to the deformation and breakdown of roll-up vortices, as well as the generation of organized secondary structures [13, 15, 25]. These instabilities occur locally within the aft portion of separation bubbles, and have been shown to be absolutely unstable independently [13, 29] or in combination [15]. It has been suggested that, while secondary instabilities act locally, they may be part of a global instability framework, which could have have serious implications on the design of flow control systems [30]. Further investigation into these breakdown mechanisms is nevertheless required as different disturbance environments and geometries have been shown to produce markedly distinct results [13]. In particular, experimental studies that investigate these mechanisms over airfoils without characterized disturbance forcing are currently lacking. To this end, this investigation also focuses on the link between roll-up vortices and instability mechanisms investigated in prior studies.
In this work, an experimental investigation on separated shear layer transition is conducted over a NACA0018 airfoil model installed in an open-loop low-speed wind tunnel at the University of Waterloo. The model, which was designed and fabricated by Gerakopulos [31], contains embedded static pressure taps and microphones. Over this geometry, Gerakopulos and Yarusevych [32] demonstrated that surface pressure fluctuation measurements are an effective and efficient method to study the convection and growth of disturbances within the separated shear layer. More recently, Boutilier and Yarusevych [12] investigated the early stage of transition over the same airfoil model by performing in-depth hot-wire velocity measurements. The effect of the experimental setup on the flow was also studied, including the intrusiveness of boundary layer hot-wire probes, and the effect on flow development of endplates and blockage [33]. While the characterization and modelling of the initial disturbance growth is valuable, past studies over this model did not directly observe the roll-up and laminar-to-turbulent transition of the separated shear layer, which forms the basis of the later stages of transition.
This work aims to build upon these previous efforts, and investigate the later stages of separated shear layer transition experimentally over the same NACA0018 model. The primary objectives of this thesis are:
1. To study the formation of roll-up structures and their role in separated shear layer transition within a separation bubble forming over an airfoil by:
(a) capturing high-speed image sequences of flow visualizations within the separated shear layer, and
(b) analysing the videos qualitatively and quantitatively.
2. To link the results of the flow visualizations to streamwise and spanwise boundary layer measurements by:
(a) analysing velocity and surface pressure measurements obtained within the boundary layer through:
i. a traditional statistical and spectral analysis, and
ii. the cross-correlation analysis of fluctuating surface pressure signals acquired simultaneously across the chord with embedded microphones and velocity measurements acquired simultaneously across the span with a rake of boundary layer hot-wire probes.
Chapter 2
Background
The purpose of this thesis is to investigate the later stages of transition within separation bubbles, which form over a NACA0018 airfoil at low Reynolds numbers. To this end, a brief literature review low Reynolds number flow airfoil operation is presented in Section 2.1. This is followed by a more extensive review on the structure of separation bubbles (Section 2.2), and laminar-to-turbulent transition (Section 2.3) within the separated shear
layer.
2.1
Airfoil Operation at Low Reynolds numbers
At low chord Reynolds numbers (Rec<105), boundary layer development on the suction
side of an airfoil remains laminar past the point of minimum pressure. Downstream, an adverse pressure gradient often leads to boundary layer separation and the formation of a separated shear layer [34]. The laminar separated shear layer is unstable to background disturbances [10] which cause the flow to transition to turbulence after separation. Following transition, the flow may then abide by two regimes.
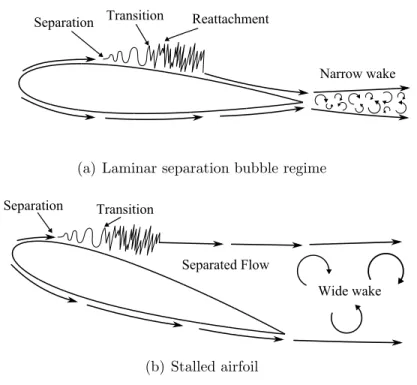
The first regime (Fig. 2.1a) is defined by the reattachment of the transitioned separated shear layer. The reattachment causes a region of slowly recirculating fluid to form between the separation and reattachment points. Despite the presence of turbulent flow in the aft portion of this region, it is referred to as the laminar separation bubble (LSB) by Gaster [35]. Following the reattachment of the shear layer, a turbulent boundary layer redevelops towards the trailing edge followed by a relatively narrow wake.
The second regime (Fig. 2.1b) occurs when the transitioned separated shear layer fails to reattach, and this causes the airfoil to stall and suffer a significant decline in aerodynamic performance [3]. The stalled airfoil acts similarly to a bluff body and sheds large-scale
(a) Laminar separation bubble regime
(b) Stalled airfoil
Figure 2.1: Flow regimes of airfoils operating at low Reynolds numbers. Reproduced from Yarusevych et al. [36].
vortices, which develop into a wide wake [12, 36, 37]. Despite the lack of reattachment, the laminar separated shear layer still transitions to turbulence. While this thesis does not directly investigate the separated flow regime, it is essential in understanding the low Reynolds number aerodynamics over an airfoil.
The ranges of parameters, such as airfoil angle of attack, Reynolds number, and free-stream turbulence intensity, for when these flow regimes occur are specific to airfoil geometry and test conditions. Also, due to the sensitivity of low Reynolds number flows, differences between the disturbance environments between experimental facilities may be sufficiently large to have an effect on the flow [2]. For higher angles of attack and/or lower Reynolds numbers, the airfoil stalls [1], whereas with decreasing angle of attack and/or increasing Reynolds numbers, the separated shear layer may reattach to form a separation bubble. In the case of the separation bubble regime over airfoils, experimental parametric studies have shown that increasing the Reynolds number and angle of attack causes the separation bubble to shift upstream and shorten in length [7, 14]. Also, separation, transition, and
reattachment locations depend more strongly on the angle of attack than on the chord Reynolds number [7, 14].
The impact of the separation bubble location and length on aerodynamic performance may be significant. For example, Boutilier and Yarusevych [7] showed that the lift coefficient curves of a NACA0018 airfoil are most affected when a separation bubble forms towards the leading edge, due to a substantial decrease in the suction peak. As a result, separation bubbles are often classified as short or long, with short bubbles having a minor effect on performance when compared to long bubbles [38]. The sudden elongation of a short separation bubble, which results in a long bubble or even a stalled airfoil, is known as bubble bursting [35].
The level of free-stream turbulence has a strong effect on the flow development over airfoils. For flow over a Lissaman 7769 airfoil, Mueller et al. [8] found that increasing the free-stream turbulence intensity results in an increase of the maximum lift coefficient and a reduction of the minimum drag. In the case of flow reattachment, an increase in free-stream turbulence intensity leads to a more rapid separated shear layer transition, resulting in a reattachment location further upstream [8]. In addition, Burgmann and Schr¨oder [14] and Hain et al. [20] found that increasing the free-stream turbulence intensity causes the separation location to move further downstream, and reduces the mean flow bubble height. Overall, a shorter separation bubble caused by increased free-stream turbulence intensity causes improved airfoil aerodynamic performance [8]. In contrast, for the stalled airfoil regime, an increase in the drag coefficient was observed when raising the turbulence intensity [8]. Furthermore, airfoil lift and drag curves subjected to low free-stream disturbances have been shown to be affected by hysteresis, which decreases in effect with increasing free-stream turbulence intensity [8, 39].
2.2
Structure of the Laminar Separation Bubble
Attached flow over airfoils operating at low Reynolds numbers is defined by the presence of an LSB on the suction side [2]. Despite the name, laminar-to-turbulent transition is a crucial process within an LSB. Also, while LSBs are naturally unsteady phenomena, they are commonly represented by a time-averaged velocity field. Figure 2.2, originally presented by Horton [40], shows a commonly accepted time-averaged velocity field illustration of a separation bubble forming over the upper surface of an airfoil. Initially, a laminar boundary layer is accelerated away from the leading edge. Once the boundary layer reaches beyond the point of minimum pressure, an adverse pressure gradient causes the flow to separate [34, 35]. The separation point may be estimated based on the time-averaged streamwise velocity gradient at the wall (∂U /∂y| = 0) denoting zero wall shear stress [41]. After separation, a
laminar separated shear layer develops above a region of recirculating fluid. The shear layer is sensitive to small-amplitude background disturbances, which are amplified downstream until the flow transitions. Following transition, the re-energized turbulent shear layer reattaches downstream, where a turbulent boundary layer develops towards the trailing edge.
Boundary layer parameters describe boundary layer development and are effective at estimating the streamwise location of transition within a separation bubble over an airfoil [12, 40, 42]. Past studies have shown that the maximum displacement thickness,δ∗, in the separation bubble corresponds approximately to the streamwise location of transition [12, 42]. Following transition, there is a slight reduction in the displacement thickness until reattachment, where it starts to grow within the re-developing turbulent boundary layer [12]. Furthermore, the momentum thickness,θ, remains approximately constant prior to transition, after which it increases significantly [42, 43]. The shape factor, H, defined as the ratio of the displacement thickness to the momentum thickness, is also an indicator of transition. Following a substantial increase in the shape factor due to the initial increase of the displacement thickness, the plateau (or peak) of the shape factor indicates the region of transition [12, 14]. The shape factor then decreases, as momentum thickness increases.
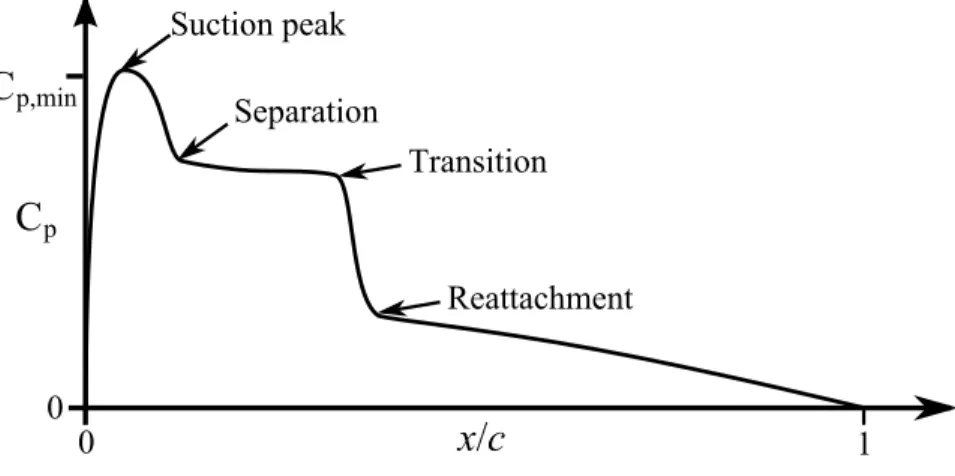
Separation, transition, and reattachment locations can also be estimated from mean surface pressure distributions [12, 32, 34, 35, 40, 42]. A typical mean surface pressure
Figure 2.2: Time-averaged laminar separation bubble representation [40] based on the illustration of Alam and Sandham [38].
Figure 2.3: A typical suction side surface pressure distribution over an airfoil with a laminar separation bubble.
distribution for the upper surface of an airfoil with a separation bubble is illustrated in Fig. 2.3. It should be noted that the pressure coefficient axis is reversed, and that the suction peak, Cp,min, in this plot corresponds to a negative value. Following the point of
minimum pressure, the presence of a plateau in the mean surface pressure distribution indicates a region of slow-moving fluid and, as a result, the approximate extent of the separation bubble. Following the plateau, a sharp increase in the mean pressure indicates that transition has occurred. After reattachment, the pressure recovery gradually continues within the re-developing turbulent boundary layer.
2.3
Separated Shear Layer Transition
Laminar-to-turbulent transition is essential in the formation of laminar separation bubbles at low Reynolds numbers. The study of separated shear layer transition has been the subject of numerous experimental investigations over airfoils, e.g. [10–12, 14, 17], and flat plates, e.g. [10, 22, 29]. More recently, direct numerical simulation (DNS) has been used to investigate this phenomenon over flat plates [23, 24, 26, 38, 44, 45], as well as airfoils [15, 16].
exponentially in the separated shear layer within a band of unstable frequencies. This amplification is often preceded by a slight decay, which begins immediately downstream of separation [12]. The understanding and modelling of this exponential growth has been researched extensively, with disturbances having been shown to be well described by linear stability theory (LST) for flow over flat plates [29], backward facing steps [46], airfoils [11, 12], as well as other geometries [10]. When the amplitude of the disturbances grows sufficiently, nonlinear interactions between disturbances begin to occur, and the growth is no longer exponential. Dovgal et al. [10] showed that this stage is often characterized by the appearance of harmonics and a subharmonic of the frequency of the most amplified disturbance in the fluctuating velocity spectra. The distinction between linear and non-linear portions of disturbance growth allows for the separated shear layer transition to be divided in two stages: the earlier linear stage, which is associated with initial disturbance growth, and the later non-linear stages, where complex interactions between disturbances, lead to transition [10].
2.3.1
The Early Stage of Transition
The early stage of transition is defined by the exponential growth of disturbances within a band of unstable frequencies, centred on a fundamental or central frequency [47]. This growth is initiated by the separated shear layer instability to background disturbances or, in the case of many studies, artificial forcing. Artificial disturbance forcing is often used in both experimental [22, 29] and computational studies [13, 15, 44, 45] to sustain transition and to test the effect of different disturbance environments (e.g. 2-D versus 3-D forcing) on separated shear layer stability. As background disturbances initiate the shear layer instability, experimental studies performed at different facilities are subject to unique disturbance environments, which have considerable influence over transition [10].
This initial disturbance growth is followed by the onset of non-linear interactions, which eventually lead to transition. The exponential growth of the disturbances may be used to establish spatial growth rates, and these provide an indication of how quickly transition occurs. Larger growth rates indicate a more rapid transition and in separation bubbles forming over airfoils, the spatial growth rate has been shown to rise with increasing Reynolds number and angle of attack [7, 12]. LST models this process effectively, which allows for the central instability frequency and growth rates to be predicted [10–12]. In wind tunnels, these general aspects of the exponential growth may be investigated through hot-wire anemometry and surface pressure measurements [12, 32]. Fluctuating surface pressure measurements have been shown to effectively capture disturbance growth within the separated shear layers over airfoils [12, 31]. By acquiring simultaneous fluctuating surface pressure measurements, the convection velocity of disturbances within the shear
layer may be estimated through cross-correlation analysis [32] and was shown to increase with angle of attack [7]. Boutilier and Yarusevych [7] showed that the convection velocity falls within 30 to 50% of the boundary layer edge velocity within the laminar portion of the separation bubble at each angle of attack, agreeing with the range of phase speeds predicted by LST [10]. These results led Boutilier and Yarusevych [7] to suggest that the convection speed of disturbances is dependent on the proximity of the separated shear layer to the wall and the maximum velocity of the reverse flow.
Boundary layer velocity profiles may be acquired to further investigate the spatial aspects of this process. By filtering velocity signals to obtain disturbance profiles, Boutilier and Yarusevych [12] showed that, for flow over a NACA0018 airfoil, the vertical location of the maximum RMS velocity corresponds to the location of the maximum amplitude of the most amplified disturbance within the laminar portion of the separated shear layer. This location also lies closely to the displacement thickness and the location of the mean velocity profile inflection point [11, 12]. Disturbances of lower magnitude have also been shown to grow near the surface of the airfoil below the separated shear layer [11, 12]. As the maximum growth of disturbances occurs near the inflection point of separated shear layer mean velocity profiles, the primary growth mechanism is due to an inviscid Kelvin-Helmholtz. The proximity of the separated shear layer to the surface allows for viscous mechanisms to also influence disturbance growth. Thus, to study which instability mechanisms are responsible for the early stage of transition, LST has been used to model primary disturbance growth within the separated shear layer in separation bubbles [10–12, 45]. By comparing the results of viscous and inviscid stability predictions, Boutilier and Yarusevych [12] showed that the amplification of disturbances within a separation bubble over a NACA0018 airfoil is dominated by a linear inviscid mechanism with viscous effects mainly present near the surface (y/δ∗ ≤ 0.15). This agrees with the results of Marxen et al. [45], which showed that, while viscous and inviscid instabilities each contribute to the growth of disturbances following separation, as the vertical position of the separated shear layer grows, a Kelvin-Helmoltz instability mechanism begins to dominate. These results imply that an inviscid instability is the primary cause of the initial disturbance growth within the separated shear layer until disturbances reach a certain amplitude, where nonlinear interactions between disturbances set in and initiate the later stages of transition.
While the later stages of transition eventually lead to the laminar-to-turbulent transition of the separated shear layer, they may also have an effect on the initial stage via feedback mechanisms [10]. This was demonstrated in a DNS of flow over a NACA0012 airfoil by Jones et al. [15], who showed that, while artificial forcing is at first required to initialize the primary shear layer instability, once forcing was disabled, the laminar-to-turbulent transition remained self-sustained over the airfoil. The authors suggest that this is caused by
to convect upstream due to significant levels of reverse flow. Jones et al. [15] also note that similar absolute instability mechanisms have yet to be observed in experimental studies of separation bubbles forming over airfoils and flat plates. This is likely partly due to the difficulty in minimizing the effect of disturbances in experimental environments, which are often subject to significant background noise [48], to the level of computational studies. Following their earlier findings, Jones et al. [16] extended their study to investigate the receptivity of the separated shear layer and determined that the frequency of trailing edge tonal noise present in an acoustic feedback-loop may be related to the shedding of vortices. The results of these studies are significant since the shedding of shear layer vortices, which are characteristic of the later stages of transition, may play a important role in influencing the initial growth of disturbances in the separated shear layer through feedback mechanisms.
2.3.2
The Later Stages of Transition
Following the initial stage of transition, the onset of nonlinear interactions causes disturbance growth to deviate from the predictions of LST. At this point, the separated shear layer may roll up into vortical structures, which convect downstream, deform, and break down to turbulence. These structures provide a link between the initial growth of disturbances and the turbulent breakdown of the laminar flow, which makes them a fundamental part of transition. This process has been observed in experimental studies over airfoils [14, 17–20] and flat plates [22, 29], as well as DNS of airfoils [15, 21] and flat plates [23, 26, 38, 44, 45].
The formation of structures within the separated shear layer has been shown in experimental [14, 20, 22, 29] and numerical [23, 38, 44, 49] studies to be caused by an inviscid two-dimensional Kelvin-Helmholtz instability initiated by reverse flow. Spatially, the maximum growth of disturbances related to this instability has been shown to occur near the inflection point of the separated shear layer in mean velocity profiles [12, 22]. These vortices are shed at or near the central frequency of the most amplified disturbances in the shear layer [15, 16, 47, 49]. The magnitude of unstable disturbances required to trigger the onset of shear layer roll-up has been shown to be below 0.1 % of the free-stream velocity through experiments [20] and DNS [15].
The Kelvin-Helmholtz instability often results in the formation of large scale vortices [14, 22, 49], however, the shedding of large persistent coherent structures is not ubiquitous and the scale of the vortices has shown a dependence on the reverse flow velocity [21, 38]. Alam and Sandham [38] showed that large reverse flow velocities do not result in large spanwise-oriented structures but rather staggered structures. The magnitude of reverse flow in separation bubbles grows with increasing adverse pressure gradient and decreasing Reynolds number. For the separation bubble regime over airfoils, the adverse pressure gradient increases with angle of attack as the lift increases [2]. Thus, large structures
would be more likely to exist at lower angles of attack. Balzer and Fasel [21] demonstrated this over a NACA 643-618 airfoil by showing that large vortices were only shed at a lower
angle of attack, while at a larger angle, vortices were much smaller and broke down more rapidly. As the chord Reynolds number of an airfoil is increased, the adverse pressure gradient should decrease at a given angle of attack, resulting in larger structures. This has been shown to be true in studies over an SD7003 airfoil by Burgmann and Schr¨oder [14] and Zhang et al. [19]. The scale of vortices is also related to the rate of shedding. Burgmann and Schr¨oder [14] showed that, at a given Reynolds number, the shedding frequency of vortices increases with angle of attack. Increasing the Reynolds number, however, also results in increased shedding rates. This would be expected, because the central frequency of unstable frequencies relating to Kelvin-Helmholtz instabilities grows with both increasing angle of attack and Reynolds number [7]. The turbulence intensity of the free-stream also has an effect on the formation of vortices. Burgmann and Schr¨oder [14] demonstrated that increasing the free-stream turbulence intensity reduces the size of vortices, but has little effect on the vortex shedding frequency.
Studies over airfoils [21, 27] and flat plates [22–24, 26] have found that, at formation, roll-up vortices can be two-dimensional across the span. Such spanwise coherent vortices have been linked to strong amplification of two-dimensional Kelvin-Helmholtz instability modes [29], which generally occurs in wall-bounded shear flows [50]. Following their formation, these two-dimensional rollers convect downstream, deform, and break down to turbulence. In some cases, the weakly-periodic merging of vortices followed by a rapid breakdown has been observed [13, 25]. This process resembles what occurs for backward-facing steps [51, 52] and plane mixing layers [53–55]. Vortex merging has been linked to the strong growth of two-dimensional subharmonic fluctuations of the most amplified disturbance, which becomes dominant in regions of vortex merging [13, 55]. While many studies have shown that roll-up structures form coherently across the span, these studies typically investigate airfoils operating at lower angles of attack and over flat plates with 2-D forcing. On the other hand, studies with strong three-dimensional disturbance forcing [13, 15, 29] and larger adverse pressure gradients [21, 38] have observed that the roll-up of the shear layer occurs with a reduced spanwise coherence. This in turn can causes roll-up structures to break down shortly after emerging through an oblique breakdown mechanism [21, 38].
For strongly two-dimensional (2-D) vortices to transition to turbulence, they must deform significantly across the span and generate spanwise perturbations. Following their formation, the rollers break down into smaller-scale three-dimensional structures, which in some studies on airfoils [14, 18–20] and flat plates [22, 23, 29], have been shown to persist past mean reattachment. In some cases, these structures have even been observed to displace as far as
to eject from near the surface [22, 23, 29]. For flow over an SD7003 airfoil, Burgmann and Schr¨oder [14] showed that spanwise-oriented vortices become c-shaped and subsequently evolve into interacting ‘screwdriver’ vortex pairs during breakdown. The interactions between the vortices become more pronounced with increasing Reynolds number, leading to the formation of arc-like structures, which resemble Λ-vortices. This type of structure has been observed in other studies on airfoils [17, 19] and in some studies on flat plates undergoing 2-D forcing [28, 38]. Also, the formation of Λ-structures is not limited to studies with spanwise rollers, and such structures have also been observed in DNS of flat plates with strong three-dimensional forcing and a less coherent roll-up [38, 44]. While Λ-vortices have appeared frequently in separation bubble studies, other types of structures have been observed [15, 22, 25]. In their DNS of a NACA0012 airfoil, Jones et al. [15] showed that spanwise-oriented vortices deform into streamwise-oriented, spanwise-periodic structures. These streamwise-oriented structures, also known as ribs, have also been observed in separation bubbles forming over flat plates [13, 25]. In their Large-Eddy Simulation (LES) of flow over a flat plate, Abdalla and Yang [25] associated the formation of both Λ and streamwise vortices to the helical pairing of spanwise vortices.
While the primary growth of 2-D waves initiates the roll-up of the separated shear layer, secondary instabilities are responsible for the deformation and breakdown of roll-up vortices. More recently, secondary instability mechanisms have been investigated in studies combining DNS and experiments with forcing over flat plates [13], and using DNS with and without forcing over a NACA0012 airfoil [15]. These studies have shown that secondary instabilities cause spanwise-oriented vortices to break down and complex secondary vortex to form following shear-layer roll-up. Specifically, these mechanisms include elliptical instability [13, 15], originating within roll-up vortices, and hyperbolic instability [15], located within the braid region located upstream or between two consecutive roll-up vortices. Elliptical instability is initiated at the onset of vortex stretching and has been shown to cause a rapid breakdown to turbulence in a process beginning in the near-wall region [13]. The name of the instability comes from the elliptical shape of the streamlines caused by vortex shedding. Furthermore, Marxen et al. [13] showed that this instability is associated with the generation of spanwise waviness and merging of vortices, and may be associated with the fundamental and subharmonic growth of disturbances in cases where two vortices interact [13]. Hyperbolic instability leads to the amplification of disturbances within the braid region, associated with hyperbolic flow named after that streamlines make in this region [15]. Jones et al. [15] linked both elliptical and hyperbolic instabilities to the generation of streamwise-oriented vortex cores observed during the breakdown of shear layer vortices. The streamwise vortices are caused by the strong amplification of perturbuations with spanwise wavenumbers on the order of the streamwise extent of roll-up vortices within the braid region. Jones et al. [15] also showed that streamwise vortices convect upstream
with the high-magnitude reverse flow velocity and cause roll-up vortices to breakdown in a self-sustaining process indicative of an absolute instability. Marxen et al. [13] also linked the formation of similar streamwise-elongated vortices during breakdown to an instability originating within the braid region; however, unlike Jones et al. [15], they did not observe hyperbolic flow in this region.
Despite the significant recent advances in the study of separated shear layer vortices, certain aspects regarding the formation and development of these structures and their role in the later stages of transition remain unanswered. This is illustrated by the observed differences between past studies discussed in this chapter. Because the development of laminar separation bubbles is very sensitive to the streamwise pressure gradient and forcing [13], the formation and development of shear layer vortices is strongly dependent on geometry and experimental conditions such as disturbance environment, Reynolds number, and angle of attack over airfoils. At this moment, few studies have investigated this phenomenon over airfoils operating at low Reynolds numbers. Furthermore, these studies have been performed over limited airfoil geometries (i.e. SD7003, NACA0012) at chord Reynolds numbers below 60,000 and generally at mid-range angles of attack between 3 and 8◦. Thus, further investigation into separated shear layer transition within separation bubbles forming over other airfoil geometries at larger Reynolds numbers across a larger range of angles of attack remains imperative. Furthermore, while past studies have investigated the flow physics of shear layer vortex shedding, none of these studies has established the link between surface pressure fluctuations and the later stages of transition, which could have considerable benefits the design and implementation of active flow control systems.
Chapter 3
Experimental Methodology
An experimental investigation of separated shear layer transition within a laminar separation bubble was conducted for flow over an airfoil at a low Reynolds number. A NACA0018 airfoil model was mounted in the University of Waterloo’s low-speed wind tunnel and a combination of experimental methods was employed to investigate flow development. Previous studies at the same facility and over the same airfoil model have been performed by Boutilier [43] and Gerakopulos [31]. The results of these studies were consulted to select the experimental conditions for this investigation. Experiments were performed at a chord Reynolds number ofRec= 105 and at angles of attack of α= 0, 5, 8, and 10◦. The chord
Reynolds number was chosen to allow for velocities within the separated shear layer of a sufficiently large magnitude to minimize the inaccuracies of low velocity hot-wire calibration [22, 56], yet sufficiently low to facilitate flow visualization. The range of α was selected to study separation bubbles of varying lengths positioned at different locations along the airfoil surface. To characterise disturbance growth within the shear layer, long-duration measurements were acquired for each profile with the rake positioned at the displacement thickness,y =δ∗, for α= 0, 5 and 8◦. The displacement thickness for α = 0◦ was obtained from the results of Boutilier [43]. Due to the effect of the rake on flow development, boundary layer profiles at α = 10◦ are not presented; although it should be noted that smoke-wire flow visualizations were performed successfully at this angle of attack.
3.1
Experimental Setup
3.1.1
University of Waterloo Low Speed Wind Tunnel
The experiments were performed in an open-loop adaptive-wall wind tunnel at the University of Waterloo (Fig. 3.1). The wind tunnel has a 9.55:1 contraction followed by a 6.0 m test section with rigid sidewalls, and adaptable upper and lower walls. The width of the test section is 0.61 m and the height with the adaptive-walls in a geometrically straight configuration is 0.89 m. From the perspective of Figure 3.1, the sidewall furthest into the page is painted matte black to minimize reflections and increase contrast during smoke-wire visualizations, while the opposite wall is made of plexiglass. The upper and lower walls were each kept in a geometrically straight configuration for all experiments presented in this study by forty-eight rack and pinion jacks. The upper and lower walls were lined with inflated rubber seals, which were pressurized to 150 kPa to prevent leakage in the test section. Each adjustable wall has seventy static pressure taps to allow for wall surface pressure measurements. The inlet of the contraction was renovated by Bishop [57] to improve the flow conditioning of the wind tunnel with the addition of a steel screen followed by aluminium honeycomb and three more steel screens ahead of the contraction. The maximum free-stream turbulence intensity within the test section is less than 0.3 % for the Reynolds number studied.
The wind tunnel free-stream speed was set using the contraction static pressure drop measured by an inclined manometer with a 1.25 Pa resolution. The pressure upstream and downstream of the contraction was obtained by averaging the pressure obtained from three
contraction
Fan
honeycomb and screens wall jacks
Inlet Outlet
airfoil
model automatedtraverse
Figure 3.1: University of Waterloo adaptive-wall wind tunnel. Reproduced from Boutilier [43].
1 mm diameter static pressure taps located on the upper and side walls at each location. The uncertainty in setting the free-stream velocity was estimated to be approximately 2.5 %.
3.1.2
NACA0018 Airfoil Model
Measurements were performed over a NACA0018 airfoil model (Fig. 3.2a) with a 200 mm chord length,c, and a 600 mm span developed and manufactured by Gerakopulos [31]. The model’s axis of rotation was located 60 mm from the airfoil leading edge (0.3c) and was mounted 2.0 m (10c) downstream of the wind tunnel contraction. The flow uniformity at the streamwise location of the model was estimated to be within ±0.6 % [57]. The model’s axis of rotation is defined as the origin of an X and Y coordinate system shown in Figure 3.2b. The x-coordinate is along the airfoil chord, beginning at the leading edge, while they-coordinate runs vertical and originates at the surface of a givenx. The spanwise
Z-coordinate begins at the airfoil centerX-Y plane with the system following the right-hand rule.
The aluminium model contained a total of ninety-five static pressure taps of 0.4 mm diameter allowing for static surface pressure measurements. Sixty-five of these taps were positioned near the airfoil center plane (Z = 0) with one on the leading edge and the rest distributed in even numbers along the upper and lower surfaces. The remaining taps were distributed along the upper surface forming three spanwise rows atx/c= 0.15, 0.30, and 0.60. The pressure taps were connected to a mechanical Scanivalve system with 0.8 mm flexible tubing. More details on this system can be found in Boutilier [43]. To permit
aluminum end plate
end cap Lexan end plate streamwise pressure taps microphones (a) Y X y x α c U∞ (b)
Figure 3.2: (a) Airfoil model with end plates and end caps installed, reproduced from Boutilier [43], and (b)definition of coordinate systems with theZ-coordinate coming out of the page at theX-Y center plane.
fluctuating surface pressure measurements, twenty-five microphones were distributed along the upper surface of the airfoil below 0.8 mm diameter holes. The size of the holes was selected by Gerakopulos [31] such that the Helmholtz cavity resonance is significantly larger than the maximum frequency of disturbance growth within the separated shear layer. As shown in Fig. 3.3, twenty-two of the microphones were divided between a full and partial row located along theZ/c=−0.20 and Z/c=−0.16 planes, respectively. The remaining three microphones were located atx/c = 0.21 across the span at Z/c= 0.242, 0.329, and 0.378. Along with a full row sensor at the same streamwise location, these microphones allow for simultaneous fluctuating pressure measurements across the span.
In a closed test section, the growth of the boundary layer along the test section walls may affect the flow over the model [33, 48]. To prevent this, end plates were mounted on the model [33, 58]. Boundary-layer measurements were performed on the model with 450 mm diameter end plates clamped directly onto the airfoil model and end caps, as shown in Figure 3.2a. The end plates, which were manufactured by Boutilier [43], were positioned 10 cm away from the test section side walls such that the spacing between them was b/c= 2.0. Boutilier and Yarusevych [33] found that mounting the end plates in this configuration resulted in a mean flow uniformity within 2.5 % from surface pressure measurements obtained across the airfoil span. More details on the endplate design may be found in Boutilier [43]. The flow visualization study was performed with only end caps mounted onto the airfoil. Removing the end plates was necessary to facilitate the
0
0.2
0.4
0.6
0.8
1
−0.2
−0.1
0
0.1
0.2
x/c
y/
c
Full microphone row (z/c=−0.2) Partial microphone row(z/c=−0.16)
mounting of the smoke wire system and the capture of images and videos. Without end plates, the mean spanwise uniformity over the model is reduced but is still satisfactory with the position of the separation bubble only slightly changed [33].
Solid, wake, and upper and lower test section wall boundary layer blockage may also affect closed test section measurements [33, 48]. The solid blockage by the airfoil model may be described by a blockage ratio, B, which is defined as the maximum cross-sectional area of the airfoil with or without end plates divided by the cross-sectional area of the test section. The blockage ratios for the configurations tested in this thesis are presented in Table 3.1. Mounting end plates results in an additional 1.1 % of blockage with the maximum blockage ratios occuring at α = 10◦. While blockage does have an effect on the upper surface pressure distribution, estimated separation, transition, and reattachment locations along with central instability frequencies are not expected to change significantly [33]. As the effects of blockage are relatively insignificant on separation bubble characteristics, geometrically straight walls were used in this study.
3.2
Measurement Techniques
Several measurement techniques were employed to characterize the flow development. Surface pressure distribution measurements were performed over the airfoil (i) to represent the mean flow development, (ii) to estimate the separation, transition, and reattachment locations, (iii) to assess the spanwise uniformity of the flow development over the airfoil, and (iv) the intrusiveness of other experimental methods. A rake of six boundary layer hot-wire probes was traversed in the region of separation bubble formation to obtain streamwise velocity profiles, which were used to extract boundary layer parameters and study the development of disturbances. Long-duration velocity measurements were obtained aty=δ∗
for spectral and correlation analysis. Microphone measurements of the same duration were also performed independently for spectral analysis and correlation analysis. Lastly, a series
Table 3.1: Model solid blockage ratio, B [%], with and without end plates installed.
α, degrees B, without end plates B, with end plates
0 4.0 5.1
5 4.3 5.4
8 4.7 5.8
of flow visualizations using a smoke-wire technique was performed to obtain images and high-speed video of flow over the airfoil and within the separation bubble.
3.2.1
Static Surface Pressure Measurements
Differential static pressure was measured between the model surface pressure and reference pressure obtained from a wall pressure tap located on the wind tunnel floor upstream of the airfoil. A mechanical system with a total of three Scanivalve mechanical multiplexers was used to connect the airfoil pneumatic tubing to two Lucas Schaevitz P3061-2WD pressure transducers with full scale input and output ranges of 500 Pa and ±5V, respectively. The transducers were calibrated against an inclined manometer, with 0.25 Pa minor divisions. The uncertainty of the static pressure measurements is estimated to be less than 1.6 % of the dynamic pressure [43]. Signals were sampled by a National Instruments PCI-6259 data acquisition card. The system is operated by a LabVIEW virtual instrument routine, which actuates the multiplexers to cycle through the connections. The routine begins by obtaining a zero pressure offset to compensate for the temperature drift of the static pressure transducers. This is followed by a sixty second delay prior to the first measurement, and a thirty second delay between all subsequent measurements to allow for the pressure to stabilize following the recommendations of Boutilier [43].
3.2.2
Fluctuating Surface Pressure Measurements
Fluctuating surface pressure measurements were obtained with twenty-five Panasonic WM-62C omnidirectional back electret condenser microphones located directly beneath 0.8 mm diameter holes on the upper airfoil surface. Each microphone signal was amplified by a Linear Technology LT 1120 dual operational amplifier with the amplification bridge mounted within the airfoil and powered by an external 30 VDC power supply. The microphone signals were sampled by a National Instruments PCI-4472 data acquisition card via coaxial cables with a total length of 6 m. The data acquisition card allows for up to eight microphone signals to be sample simultaneously. All microphone measurements were low-pass filtered by the PCI-4472 at 2.5 kHz. More details on the microphone selection, port design, and calibration may be found in Gerakopulos [31].
Fluctuating surface pressure measurements for the clean model were acquired at 10 kHz for a total of 222 samples. The sampling rate was selected to provide sufficient temporal
resolution for cross-correlation coefficient functions. Spectra were computed using Welch’s method [59] with 256 non-overlapping rectangular windows, giving a spectral resolution of 0.6 Hz. Measurements investigating the effect of boundary layer probes and the smoke wire were sampled at 40 kHz for a total of 223 samples. Fluctuating surface pressure spectra
were computed using Welch’s method [59] with 128 non-overlapping rectangular windows, giving a spectral resolution of approximately 0.6 Hz.
3.2.3
Velocity Measurements
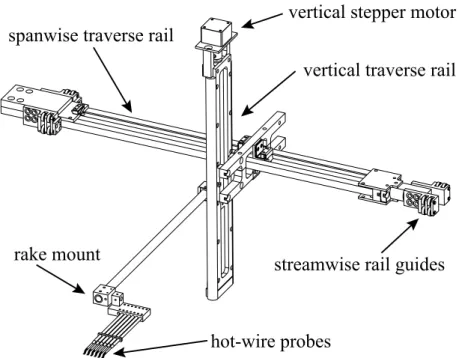
Streamwise velocity measurements were performed with a rake of six normal boundary layer type probes (Dantec 55P15) operated by a Dantec Streamline Pro constant temperature anemometry system. The rake was angled at approximately 7◦ to the curvature of the airfoil following the recommendations of Brendel and Mueller [42]. Within the separated shear layer, the uncertainty in the velocity measurements is estimated to be less than 5% [60]. The rake was positioned with an automated three-axis traverse (Fig. 3.4), with an estimated uncertainty in positioning of ±0.025 mm in the vertical and spanwise directions, and ±0.05 mm in the streamwise direction [31].
As shown in Fig. 3.5, adjacent probes within the rake were separated by 6 mm in the spanwise direction. The probes were aligned optically over the airfoil surface and the alignment between probes was confirmed through digital images taken with a Nikon D300 digital SLR camera with a Nikon UV-Nikkor 105 mm f/4.5 macro lens and a Nikon SB-600 speedlight. The estimated uncertainty in the alignment is within ±0.1mm in both the streamwise and vertical directions respectively. The probe alignment images were used to adjust the vertical positions of velocity profiles presented in Section 4.2.2, to compensate for slight vertical misalignments between the probes.
The probes were calibrated in situ upstream of the airfoil using a Pitot-static tube positioned at the same X-Y plane within 50 mm. The Pitot-static tube measurements were performed with two inclined manometers of 1.25 Pa and 2.5 Pa minor divisions to allow for lower and higher calibration velocities. A calibration curve was constructed using a fourth-order polynomial fit of the hot-wire bridge output voltage and the free-stream velocity following the recommendations of Bruun and Khan [61].
For all hot-wire measurements, the bridge top voltage output from the Dantec Streamline Pro was sampled at 20 kHz and low-pass filtered at 2.5 kHz by a National Instruments PCI-4472 data acquisition card. The sampling rate was selected to provide sufficient temporal resolution for cross-correlation coefficient functions. For the long-duration measurements obtained with the rake positioned at the displacement thickness, 223 samples
were acquired over approximately seven minutes. Streamwise fluctuating velocity spectra on these long-duration measurements were computed using Welch’s method [59] with 256 non-overlapping rectangular windows, giving a spectral resolution of approximately 0.6 Hz.
hot-wire probes
vertical traverse rail
spanwise traverse rail
rake mount
vertical stepper motor
streamwise rail guides
Figure 3.4: Isometric view of positioning traverse with rake of hot-wire probes.
Probe 1
Probe 2
Probe 3
Probe 4
Probe 5
Probe 6
Z
6 mm 6 mm
6 mm 6 mm
3mm 3mm
model spanwise center X-Y plane
airfoil model surface
y
Figure 3.5: Front view of hot-wire placement in the rake. Note: the main direction of the flow is into the page.
3.3
Flow Visualization
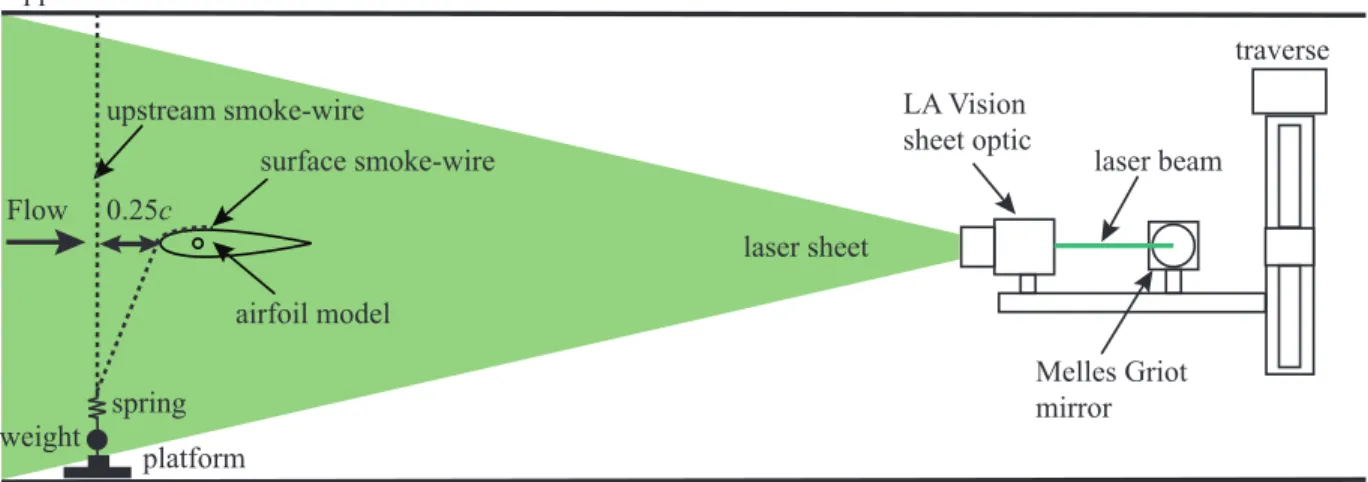
Smoke-wire flow visualizations were captured over the airfoil without end plates using a 0.1 mm diameter steel wire. A smoke-wire was positioned in two main configurations with the wire placed (1) vertically, 50 mm (0.25 x/c) upstream of the airfoil at Z/c = 0.25, (Fig. 3.6a) and (2) within the initial portion of the separation bubble on the suction side
across the span (Fig. 3.6b).
In both configurations, the wire was kept in tension with a combination of a spring and a weight attached to a platform, which was secured to the test section floor. The streamwise position of the smoke wire for the first configuration was based on the technique described by Yarusevych et al. [62]. The spanwise position of the wire was selected to avoid possible contamination of microphone ports and pressure taps. The smoke wire positions for the second configuration are given in Table 3.2. The streamwise smoke-wire positions were selected based on a combination of surface pressure distributions, and the streamwise development of RMS fluctuating surface pressure and RMS velocities. The y/c position of the smoke-wire within the separated shear layer was selected based on velocity profiles, such that the Reynolds number based on the wire diameter was less than 50. This was done to prevent vortex shedding off of the wire, following the recommendations of Batill [63] .
A smoke-generating mixture comprised of 70% glycerin and 30% distilled water was applied to the wire following the recommendations of Boutilier [43]. A variable AC
smoke-wire airfoil model upper test section wall
lower test section wall Flow spring weight platform 0.25c (a) smoke-wire anchor
to spring and platform (b)
Figure 3.6: Schematics of flow visualization setups with smoke-wire placed (a) vertically upstream of the airfoil and (b) across the span close to the surface of the model. Note: the schematics are not to scale.
![Figure 3.1: University of Waterloo adaptive-wall wind tunnel. Reproduced from Boutilier [43].](https://thumb-us.123doks.com/thumbv2/123dok_us/1881751.2774690/38.918.127.809.726.914/figure-university-waterloo-adaptive-wall-tunnel-reproduced-boutilier.webp)
![Figure 3.2: (a) Airfoil model with end plates and end caps installed, reproduced from Boutilier [43], and (b)definition of coordinate systems with the Z-coordinate coming out of the page at the X-Y center plane.](https://thumb-us.123doks.com/thumbv2/123dok_us/1881751.2774690/39.918.129.805.694.907/figure-airfoil-installed-reproduced-boutilier-definition-coordinate-coordinate.webp)
![Table 3.1: Model solid blockage ratio, B [%], with and without end plates installed.](https://thumb-us.123doks.com/thumbv2/123dok_us/1881751.2774690/41.918.180.753.872.984/table-model-solid-blockage-ratio-end-plates-installed.webp)