Gradient Nonlinearity Correction to
Improve Apparent Diffusion Coefficient
Accuracy and Standardization in the
American College of Radiology Imaging
Network 6698 Breast Cancer Trial
David C. Newitt, PhD,
1* Ek T. Tan, PhD,
2Lisa J. Wilmes, PhD,
1Thomas L. Chenevert, PhD,
3John Kornak, PhD,
4Luca Marinelli, PhD,
2and Nola Hylton, PhD
1Purpose:To evaluate a gradient nonlinearity correction (GNC) program for quantitative apparent diffusion coefficient (ADC) measurements on phantom and human subject diffusion-weighted (DW) magnetic resonance imaging (MRI) scans in a multicenter breast cancer treatment response study
Materials and Methods:A GNC program using fifth-order spherical harmonics for gradient modeling was applied retro-spectively to qualification phantom and human subject scans. Ice-water phantoms of known diffusion coefficient were scanned at five different study centers with different scanners and receiver coils. Human in vivo data consisted of base-line and early-treatment exams on 54 patients from four sites. ADC maps were generated with and without GNC. Regions of interest were defined to quantify absolute errors and changes with GNC over breast imaging positions. Results:Phantom ADC errors varied with region of interest (ROI) position and scanner configuration; the mean error by configuration ranged from 1.4% to 19.9%. GNC significantly reduced the overall mean error for all sites from 9.9% to 0.6% (P50.016). Spatial dependence of GNC was highest in the right-left (RL) and anterior-posterior (AP) directions. Human subject mean tumor ADC was reduced 0.2 to 12% by GNC at different sites. By regression, every 1-cm change in tumor ROI position between baseline and follow-up visits resulted in an estimated change of 2.4% in the ADC early-treatment response measurement.
Conclusion: GNC is effective for removing large, system-dependent errors in quantitative breast DWI. GNC may be important in ensuring reproducibility in multicenter studies and in reducing errors in longitudinal treatment response measures arising from spatial variations in tumor position between visits.
J. MAGN. RESON. IMAGING 2015;42:908–919.
D
iffusion-weighted imaging (DWI) is a noninvasive technique used to evaluate tissue cellularity and micro-structure. Studies in patients with breast cancer have dem-onstrated that DWI can improve the diagnostic accuracy of MRI when combined with dynamic contrast-enhanced (DCE) magnetic resonance imaging (MRI) data,1 and can also provide information on early treatment-related changes in tumors in patients undergoing neoadjuvant (presurgical)chemotherapy (NAC).2 There is interest in establishing MRI biomarkers of treatment response, and such potential markers are currently being evaluated in clinical trials of conventional and targeted therapy. In order for DWI-based MRI biomarkers to be used robustly for monitoring treat-ment response, it is necessary to identify, characterize, and correct sources of measurement variation that may impact the quantitation of MRI-measured biomarkers.3
View this article online at wileyonlinelibrary.com. DOI: 10.1002/jmri.24883 Received Dec 15, 2014, Accepted for publication Feb 20, 2015.
*Address reprint requests to: D.C.N., Department of Radiology, UCSF Mt. Zion Hospital, 1600 Divisadero St., Rm. C254, Mail stop 1667, San Francisco, CA 94115. E-mail: [email protected]
From the1Department of Radiology and Biomedical Imaging, University of California, San Francisco, California, USA;2MRI Lab, GE Global Research, One
Research Circle, Niskayuna, New York, USA;3Department of Radiology, University of Michigan, Ann Arbor, Michigan, USA; and4Department of
Epidemiology and Biostatistics, University of California, San Francisco, California, USA
A significant source of bias in diffusion measurement is the inherent nonlinearity of the imaging gradients in MRI systems.4–7 This gradient nonlinearity (GN) is a well-known characteristic of the gradient design, and results in a nonlinear and systematic spatial distortion of the encoded image known as gradient warping or "gradwarp".8,9 The magnitude of GN generally increases with distance from the magnet isocenter and can be efficiently described by just a few spherical harmonics coefficients.8,9Gradwarp correction, a feature offered by all clinical MRI vendors, interprets these coefficients to perform the necessary local image interpola-tion and scaling needed to create a spatially accurate MR image. However, GN also affects diffusion-encoding, result-ing in a systematic and spatially-dependent bias of the diffusion-encoding b-value or b-matrix.10 These errors in diffusion-encoding will result in spatially dependent inaccur-acy of diffusion measurements. The extent of GN varies between MRI systems from the same vendor 7and between systems from different vendors,11 and this directly results in lower concordance between measurements in multisite stud-ies and worsened reproducibility in monitoring longitudinal changes if multiple scanner configurations are used. In bilat-eral breast DWI, large spatial offsets from isocenter are inherent to the prescribed field-of-view (FOV) and vary sig-nificantly between different receiver coil designs; hence breast DWI is highly susceptible to bias resulting from GN. As an example, regional variations in apparent diffusion coefficient (ADC) of breast tissue recently reported by Par-tridge et al12may be attributed in part to GN effects.
Correction of GN effects in DWI works by account-ing for nonlinearity of the gradient fields duraccount-ing calcula-tion of ADC. Early work on GN included correccalcula-tion in single-directional ADC imaging,5 and in multi-directional diffusion tensor imaging where the full diffusion tensor was used.4 However, the recent increase in demand for quantitative, large FOV diffusion imaging in oncology
13,14 has focused primarily on DWI acquisitions that
typi-cally use only one to three gradient-encoding directions, which are insufficient to solve for the entire diffusion ten-sor. Hence, simplified DWI-optimal GN correction techni-ques have recently been developed 6,7 that allow for correction without need to acquire the full tensor dataset. Additionally, the work from Tan et al7found it was neces-sary to also correct for confounding spatially varying signal bias effects in order to demonstrate improved accuracy and interscanner reproducibility of ADC. Such effects include the concomitant field arising from dual-spin-echo diffusion preparation sequences,15 and image distortion related to eddy-current and susceptibility. Therefore, GN correction (GNC) schemes that account for both limited-directionality DWI and other confounding nonlinearity effects will be needed to provide accurate and reproducible DWI biomarkers.
GN effects are of particular concern in longitudinal, multicenter trials such as treatment response trials for breast cancer. Interscanner variability exists even between different model scanners from the same manufacturer, and will pres-ent difficulties when attempting combined quantitative anal-ysis across the trial. Furthermore, while spatially dependent GN effects can be mitigated by choosing metrics based on percent change in ADC over time rather than absolute value at a given timepoint, the spatial variability of the GN bias will still result in errors in these measurements due to posi-tional changes between visits. The purpose of this study was to evaluate a GNC program for ADC measurements on phantom and human subject DW MRI scans in a multicen-ter breast cancer treatment response study.
MATERIALS AND METHODS
GNC in DWI
GNC in diffusion imaging is typically described as a correction of the derived diffusion metrics, such as ADC and fractional anisot-ropy (FA). These diffusion metrics can in turn be derived from the diffusion tensorD, which is a three-by-three matrix with six inde-pendent scalar components:
D5 Dxx Dxy Dxz Dxy Dyy Dyz Dxz Dyz Dzz 2 6 6 4 3 7 7 5: (1)
Conventionally,D is solved by a system of linear equations relating D to the diffusion-encoded signal Si, the nondiffusion-encoded signalS0, the encoding scalar b-value b, and the normal-ized 3D gradient vectorgi. Without GNC,giis the same for every pixel. In diffusion tensor imaging (DTI), six or more gi gradient vectors are used to acquire the resulting set of signalsSi, sufficient to mathematically solve forD. With GNC,givaries on a pixel-by-pixel basis, and can be obtained by decoding the spherical harmon-ics to obtain the pixel-based gradient vectorg0i.7In this setting, the familiar Stejskal-Tanner equation ln(Si/So)5–biD can be written in matrix form to solve forD:
lnðSi=S0Þ52bg0iTDg 0
i: (2)
However, in DWI where as few as just one gradient vector may be used, there are insufficient gradient directions or equations to solve forD. Hence, GNC in one-directional DWI reverts to the scalar version of the Stejskal-Tanner equation, whereby the GN-modified b-value b0iis effectively:
b0i5bi
kg0ik 2
kgik2: (3)
Therefore, the b-value correction of Eq. (3) may be used in nontensor-based DWI, where fewer than six gradient vector direc-tions are available. Another situation where the scalar b-value cor-rection may apply is when only trace (also known as combined) diffusion images are available, whereby diffusion images with the
same b-value from multiple gradient directionalities are combined to form a single image and the individual diffusion images are not stored for postprocessing. The b-value correction may also be used to directly obtain a b-value-corrected signal:
S0i5S0exp log Si S0 bi b0i 5S0exp log Si S0 kgik2 kg0 ik 2 ! : (4)
Alternatively, in three-direction DWI a system of linear equations can still be used to estimate the diffusion tensor. This is done by limiting the number of eigenvalues (or singular values) in the eigenvalue (or singular value decomposition) of Eq. (2) to three, instead of using all six eigenvalues as in the DTI case. In cases where multiple b-values are used in DWI, the number of eigenvalues is limited to the number of gradient directions per b-value (one to three).
In this work, a GNC program (GE Global Research, Nis-kayuna, NY) 7 using fifth-order spherical harmonics coefficients was used to retrospectively generate ADC maps from the acquired diffusion images. Confounding effects on the diffusion signal due to concomitant field resulting from the use of dual-spin-echo diffu-sion preparation 15 were also accounted for. In cases of three-directional DWI data where diffusion data from individual gradi-ent directions were available, Eq. (2) was applied (limiting the eigenvalues to three in the case of three-directional DWI). In cases where only the trace (combined) diffusion data was available, the b-value correction of Eq. (3) was used. Equation (4) was also used to generate b-value-corrected images.
Study Imaging Sites and Equipment Configurations
Five imaging sites participating in the ACRIN 6698 substudy of the I-SPY 2 TRIAL (http://ispy2.org) and using GE Healthcare MRI equipment were included in this study. All imaging studies were performed on 1.5T HDx scanners (GE Healthcare, Wauke-sha, WI) using receive-only breast coils. Details of the equipment
configurations for the five sites are given in Table 1. Three differ-ent gradidiffer-ent system configurations were represdiffer-ented (A through C) with different maximum gradient amplitudes (Gmax540mT/m (A), 22mT/m (B), 33mT/m (C)) and maximum gradient slew rates (SR5150mT/m/ms (A), 77mT/m/ms (B), 120mT/m/ms (C)). Different Gmax and SR, as well as differences in the site-specific acquisition protocols, result in different echo times (TE) and echo spacing (ESP), as shown in Table 1, and result in different distor-tion effects due to the EPI readout. Two different eight-channel receiver coil models were used across the five sites, a Sentinelle model (Invivo, Gainesville, FL) and a GE model (GE Healthcare). The primary difference between coils was the position of the center of the FOV in the anterior-posterior (AP) direction with respect to the magnet isocenter. Equipment configurations for the human scans were similar to those used for the phantom studies (Table 2). Site 2 was not included in the human studies for this work as no patients had been scanned on GE Healthcare scanners.
Phantom Design and ACRIN 6698 DWI Quality Control Procedure
Breast-sized diffusion phantoms were constructed from 1.5-L, 11 cm diameter cylindrical plastic containers. A single 2.9 cm diameter thin-walled plastic measurement tube filled with distilled water was thermally insulated at both ends and held vertically within each container by closed-cell foam support rings affixed to the bottom and removable top of the container (Fig. 1). A pair of phantoms and phantom preparation instructions were provided to each site for the purpose of completing standardized qualification quality control (QC) scans for the ACRIN 6698 trial (see http:// www.acrin.org/6698_protocol.aspx for protocol details). At least 1 hour prior to scanning, the space surrounding the measurement tube was filled with a mixture of crushed ice or ice cubes and water. Each phantom was placed in a foam insulation sleeve and plastic bag to keep condensate away from MRI components. Once at thermal equilibrium at0C, water within the measure-ment tube will have a known diffusion coefficient of 1.13 1023 mm2/s.16
The diffusion protocol for all phantom scans was a three orthogonal-direction DWI with four b-values of 0, 100, 600, and TABLE 1. Equipment Configurations for Phantom Study
Site Gradient system Rx coila Echo time (msec) Echo spacing (ms) Image dimension (pixels) FOVbcenter in L/R (-/1) direction (mm) FOVbcenter in A/P (-/1) direction (mm) Individual directions available 1 A 8ch, Sentinelle 68.5 664 1603160 20.1 267.3 Yes 1 B 8ch, Sentinelle 95.4 912 1603160 20.1 267.3 Yes 2 C 8ch, Sentinelle 98.3 748 1603160 12.6 281.1 No 3 C 8ch, GE 116.3 884 2563256 16.2 22.4 No 4 A 8ch, GE 99.3 784 2563256 17.2 117.9 No 5 A 8ch, GE 96 664 1603160 10.3 110.5 No
aReceive coils: Sentinelle (Invivo, Gainesville, FL); GE (GE Healthcare, Waukesha WI). bFOV: field of view.
800 s/mm2, using a single-shot EPI sequence. Thirty 4-mm thick axial slices with a 32 cm FOV were acquired providing full cover-age of the phantoms. Software and clinical workflow differences between the five sites resulted in minor variations in how the acquisition protocol was performed. The scanner software employed at sites 2, 3, and 4 required three separate dual b-value scans of b5(0,100), (0,600), and (0,800) s/mm2, acquired consec-utively at the same TE, while sites 1 and 5 used a single acquisi-tion four b-value protocol. Also, the individual diffusion images from all three directions were available from Site 1, while Sites 2–5 provided only combined (trace) images.
The ACRIN 6698 DWI QC phantom scan procedure required four sequential DWI acquisitions over 12 minutes, which were analyzed at ACRIN Core Labs (ACRIN and University of Michigan) for site certification. Stability in ADC values meas-ured over this interval was evidence that the phantom achieved thermal equilibrium. For the current study, selected protocol com-pliant scans from thermally stable acquisitions from each site were analyzed retrospectively.
Human Studies
The effects of GNC on human subject ADC measurements were evaluated using DWI data from the I-SPY 2 study collected at sites using GE scanners. I-SPY 2 enrolled patients with locally advanced breast cancer, screened to identify those with high risk of recur-rence according to the Mammaprint 70-gene signature 17 and receptor status (estrogen receptor and Her2). All patients gave informed consent following explanation of the planned procedures.
Subjects received up to four MRI studies: pretreatment (MR1), early-treatment (MR2, following 3 weeks of Paclitaxel), interregi-men (MR3, after 12 weeks Paclitaxel), and presurgery (MR4, fol-lowing all NAC treatment). The MR1 and MR2 visits were used in this study evaluating GN effects. Fifty-four patients, mean age 50 years (age range 32–71 years, excluding patients from Site 4 for which date of birth data were not available), with analyzable diffusion scans at both MR1 and MR2 were included, as indicated in Table 2.
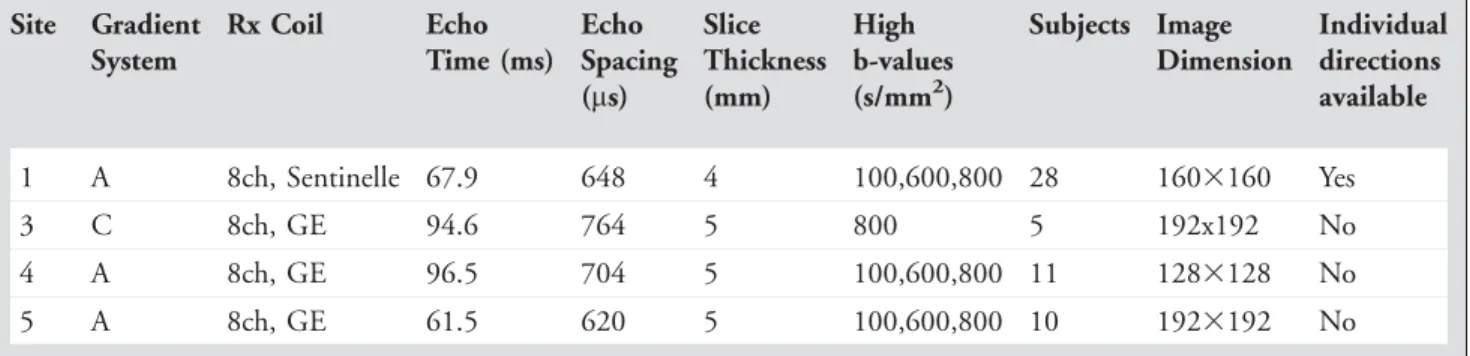
All patients enrolled in the I-SPY 2 TRIAL receive a bilateral DWI scan in addition to standardT2-weighted and 3D high spa-tial resolution (DCE) imaging. Those enrolled in the ACRIN 6698 substudy (patients from Sites 1, 4, and 5) were scanned with the four b-value protocol (b50, 100, 600, and 800 s/mm2) as described in the previous section. Patients from Site 3, which was not participating in ACRIN 6698, received a single dual b-value DWI scan (b50, 800 s/mm2) as prescribed by the I-SPY 2 proto-col. Differences between the phantom and human DWI protocols included variations of the image dimension (Sites 3, 4, and 5) and a significant reduction in TE (Site 5) as shown in Tables 1 and 2. The FOV for human scans ranged from 30–38 cm in order to provide full bilateral coverage of the breasts.
Analysis
MRI DICOM images were transferred to a local analysis archive, either directly from local PACS or from other sites via the TRIAD program (ACRIN, Philadelphia, PA). All processing except the GNC program was done with in-house software written in the IDL (Exelis Visual Information Solutions, Boulder, CO) program-ming language. Monoexponential uncorrected ADC maps were generated for each diffusion acquisition, using a linear least-squares fit to the log of the signal intensity for the four b-value series and a simple two-point calculation for two b-value series. Special proc-essing was required for the human subject scans from Sites 2 and 4, where multiple-series matched two b-value acquisitions [(0,100 s/mm2), (0,600 s/mm2), (0,800 s/mm2)] were used to acquire a four b-value dataset. These series were automatically identified and the DICOM headers were automatically checked to ensure that no changes to the pertinent scan parameters, other than b-value, were made between the individual series. The multiple-series scans were combined into a single four b-value series consisting of all b>0 images and a single averageT2 image created from the three b50 images. DICOM attributes were then TABLE 2. Equipment Configurations for Human Study
Site Gradient System Rx Coil Echo Time (ms) Echo Spacing (ms) Slice Thickness (mm) High b-values (s/mm2) Subjects Image Dimension Individual directions available 1 A 8ch, Sentinelle 67.9 648 4 100,600,800 28 1603160 Yes 3 C 8ch, GE 94.6 764 5 800 5 192x192 No 4 A 8ch, GE 96.5 704 5 100,600,800 11 1283128 No 5 A 8ch, GE 61.5 620 5 100,600,800 10 1923192 No
FIGURE 1: Breast diffusion phantom: (a) unfilled phantom showing measurement tube, (b) typical central axial T1
-weighted MRI showing the center tube surrounded with an ice/ water mixture.
set to allow processing of the combined series by both the ADC mapping software and the GNC program. Since no significant deviation from monoexponential diffusion behavior was expected in free water, the phantom scans from these sites were analyzed as individual two b-value acquisitions and the b50,800 s/mm2series results are presented here.
Spatial variations in phantom ADC maps were evaluated with line intensity profiles and ROI analysis. To determine the AP direction (y-axis) variations in ADC, line profiles (of 5-voxel width) were obtained along the center of the inner phantom tubes. In addition, four rectangular ROIs, 1.53 1.0 cm2, were evenly distributed in the AP direction along the middle slice of each phantom image. Phantom and breast coil geometries restricted phantom positioning to a vertical orientation, thereby limiting evaluation of variations in the superior-inferior (SI) direction (z-axis). SI variations in absolute ADC error over a 61 cm range were evaluated with small (1 cm diameter) circular ROIs placed on all slices intersecting the central phantom tube. ADC error could not be found in the ice1water region outside the center tube due to the lack of homogeneous, artifact-free regions. In images where there was sufficient signal in the outer volume, the circular ROIs were extended to map the GNC effects at larger SI offsets by cal-culating the percent change in measured ADC with GNC.
For the human subject scans, areas of tumor were initially identified on subtraction images from the DCE acquisition. As image misregistration did not allow for direct transfer of ROIs from the DCE to the diffusion images, tumor ROIs were drawn manually by trained research associates with 2–5 years of experi-ence, following a standard operating procedure defined by mem-bers of the ACRIN 6698 study protocol team. ROIs were defined on the diffusion scans as regions hyperintense on the high-b value DWI and hypointense on the ADC map. The DCE images were
used for reference to ensure correct anatomical location within the breast. Regions of tumor necrosis were excluded based on high intensity on the ADC maps. ROIs were drawn on contiguous slices to include all tumor volume, and these single-slice regions were combined into a single 3D whole-tumor ROI. ROI positions were characterized by a single 3D centroid (center-of-gravity) position relative to magnet isocenter and an ROI extent along each axis. ROIs for scans from MR1 and MR2 were generated independently. The whole-tumor ROI for each diffusion series was evaluated for mean, median, standard deviation (SD), and SD/mean for ADC maps with and without GNC. In addition, all patients for each equipment configuration were analyzed together to generate nor-malized combined ADC histograms for all ROI voxels from all patients at MR1 and MR2 for each equipment configuration, with and without GNC, using a bin size of 1 3 1025 mm2/s. Early treatment response in ADC (DADCET), defined as the percent change in mean tumor ADC between MR1 and MR2, was calcu-lated for both uncorrected and GNC ADC data.
Statistical Analysis
Statistical analysis was performed in R (R Core Team (2014). R: A language and environment for statistical computing. R Foundation for Statistical Computing, Vienna, Austria. URL http://www.R-project.org). A Wilcoxon signed rank test was used to assess the change in phantom ADC error with GNC within and between configurations. Paired and two-sample t-tests were used on the human subject data to evaluate differences between GNC and uncorrected tumor ADC measurements and DADCETwithin and between configurations. Pearson’s correlation was used to assess the strength of relationship between GNC changes in DADCETwith changes in the ROI position between visits. All tests were per-formed two-sided with significance level alpha50.05.
FIGURE 2: ADC maps of ice-water phantoms from Site 1(a,b)and Site 5(c,d). Left images (a,c) are original data, right images (b,d) from GNC data. Window/level settings are matched for all four images at 1.031023
mm2/s window and 1.231023
mm2/s level. For the Site 1A configuration, GNC resulted in a noticeable change in ADC level and homogeneity, as evidenced by the lower overall ADC and the reduction in ADC gradient from top to bottom in the center tube as seen in (b) as compared to (a). Site 5 images are more typical, showing little visual evidence of GN effects other than a general decrease in intensity in the ADC map when calibrated window/level settings are used. As seen here, the degree of spatial distortion varied between sites.
RESULTS
Phantom Results
Typical phantom ADC maps from two sites without and with GNC are shown in Fig. 2. Identical window and level intensity settings, corresponding to 1.03 1023mm2/s win-dow and 1.2 3 1023 mm2/s level, were used for all four images. Qualitative differences were noted between uncor-rected and GNC maps from Site 1 (Fig. 2a,b), with distinct global decrease in ADC with GNC along with elimination
of the gradient towards higher ADC values in the anterior end of the phantom. Effects of GNC were subtler on the other configurations, generally not visible in qualitative comparisons unless display window and level settings were carefully set to enhance the decrease in ADC with GNC. The degree of image distortion varied considerably between sites, as illustrated in the figure.
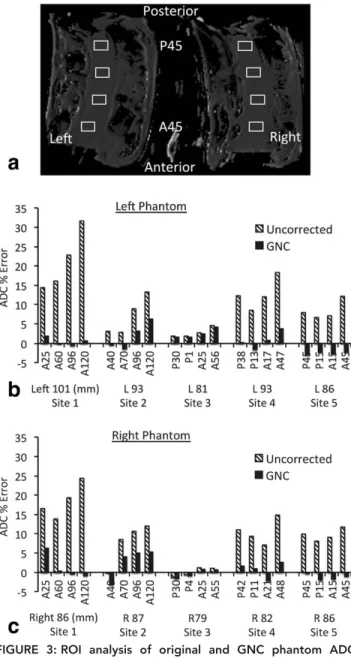
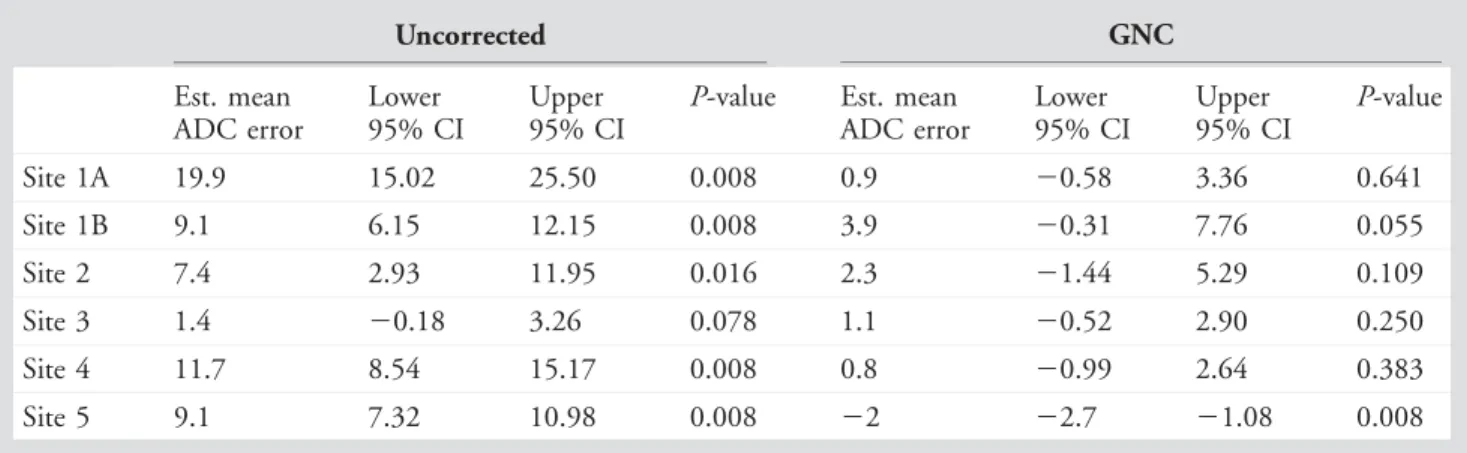
Figure 3a shows typical ROIs drawn at different AP positions in the two ice-water phantoms, with ADC results plotted in Fig. 3b (left phantom) and Fig. 3c (right phan-tom). Site 1 results shown are for the higher speed gradient system A, as described below. The ADC errors (percent dif-ference from 1.1*1023mm2/s) were reduced by GNC in all sites and in 37 of 40 ROIs. The larger offset from isocenter in the AP direction when using the Sentinelle coil resulted in a greater increase in uncorrected error in the more ante-rior ROIs at Sites 1 and 2 when compared to Sites 3–5 using the GE coil. Mean percent error across all eight ROIs and paired Wilcoxon signed rank test results for each equip-ment configuration are given in Table 3. Site-to-site differ-ences in the magnitude of ADC error before correction were large; ranging from Site 1 with 19.9% mean error, to site 3 with 1.4% mean error. The range of mean ADC error was reduced by GNC to a maximum 3.9% (Site 1B) to
22.0% (Site 5). Table 4 shows results for the intersite Wil-coxon signed rank tests. The maximum site-to-site differ-ence in the estimated mean value for the ADC error was 18% for uncorrected data, reduced to 3.9% after GNC.
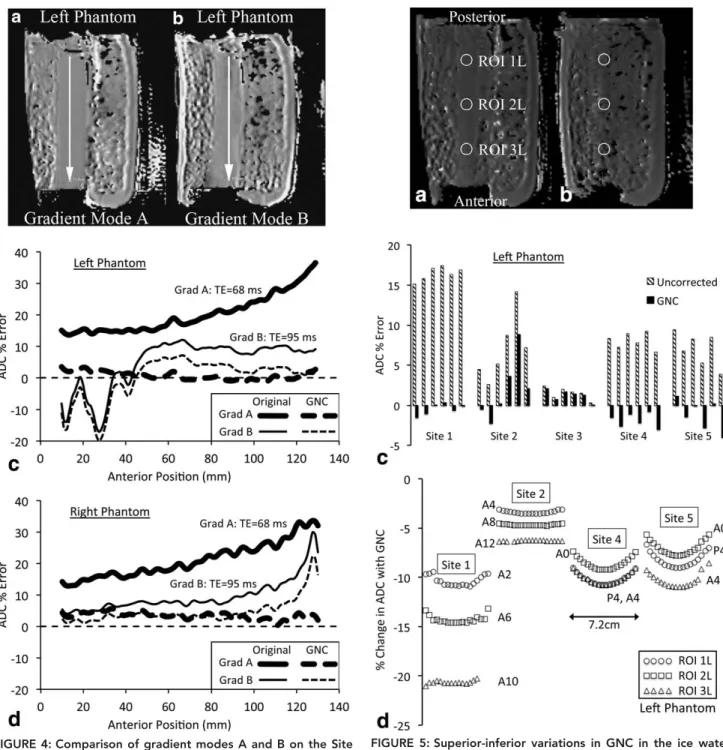
The Site 1 scanner was a dual gradient mode model that allowed for gradient strength/slew-rate performance and gradient nonlinearity effects to be compared on the same MRI scanner (gradient systems A and B). Figure 4a,b shows corrected ADC maps from the left phantom (left offset510 cm) for gradient systems A and B, respectively. The system B map appears to have more distortion and increased ADC variability. Figure 4c,d shows the ADC pro-files along the AP direction for the two gradient modes with and without GNC for the left and right phantoms, respec-tively. While the system B displays smaller ADC errors using uncorrected images, the higher speed system A mode showed much lower errors after correction. There were also more artifacts with gradient mode B due to the longer echo time and echo spacing, as illustrated by the oscillatory behavior of the ADC plot for the left phantom between positions A10 and A50. As the shorter TE images were judged superior for clinical image quality, all further investi-gations were limited to gradient mode A.
Due to the phantom geometry only a relatively small (2 cm) range of positions within the central tube was test-able against a known diffusion value in the superior–inferior (z-axis) direction. Where sufficient signal was present in the outer phantom region the relative change in ADC with GNC was measured over a larger 7.2 cm range. Figure 5a,b FIGURE 3: ROI analysis of original and GNC phantom ADC
maps from five imaging sites:(a)typical ROI placement (Site 5 image shown); (b,c) mean ROI ADC error (percent difference from the known value of 1.1 1023 mm2/s) for left and right
phantoms, respectively. Hatched bars show the original data ADC, solid bars show the GNC data ADC. Labels for each pair of data points give the anterior/posterior position of the ROI in mm, while the subtext gives the mean right/left offset of the four ROIs. AP positions illustrate the more vertically centered position for the coil used at Sites 3–5, while the generally smaller RL offsets in the right phantom may be due to image distortions. Site 1 results shown are for gradient system A.
shows sample images with ROIs from two slices in the left phantom from Site 1A (original data, no GNC); Fig. 5b showing the small signal voids from the solid phase crushed ice. Figure 5c shows the mean ADC percent error by site for ROI 2L (center ROI, left phantom) for each of the six slices measurable in the center tube (slice positions21.0 cm to 1.0 cm, 4 mm slice thickness). The residual errors for the Site 2 data were due mainly to artifacts in the images and derived ADC maps. As seen in Fig. 5c, both Site 4 and 5 had apparent oscillations in ADC between slices, the mag-nitude of which sometimes was comparable to the GNC correction. Due to the small number of slices, statistical tests of this oscillation were inconclusive (eg, Wilcoxon sum rank test comparing odd to even slices: P50.1, 90% confidence interval [CI]5[0.686 2.241] for Site 4). Figure 5d shows the variation in the percent change of ADC with GNC
across an 18 slice (7.2 cm) range for Sites 1A, 2, 4, and 5. Sites 1A, 4, and 5, all running gradient system A, had com-parable changes in ADC correction percentage over this range of z-axis positions; the GNC effect on ADC typically decreasing 1.4% to 2.5% between z50 and z5 63 cm, as shown by the curvature of the plots in Fig. 5d. Site 2 (gra-dient system C) showed less variation with z position, with a maximum change of 0.9% over the same range of positions.
Human Subject Results
MRI-visible tumor volumes varied greatly between patients, as evidenced by ROI volumes from 0.69 cc to 291 cc at visit MR1 (median57.94 cc) and from 0.17 cc to 110 cc at MR2 (median55.61 cc). Maximum in-plane extent (RL or AP direction) varied from 1 cm to 11 cm. Figure 6
TABLE 3. Phantom ROI Measures: Paired Wilcoxon Sum Rank Test on Percent ADC Error in 8 Rectangular ROIs
Uncorrected GNC Est. mean ADC error Lower 95% CI Upper 95% CI
P-value Est. mean ADC error Lower 95% CI Upper 95% CI P-value Site 1A 19.9 15.02 25.50 0.008 0.9 20.58 3.36 0.641 Site 1B 9.1 6.15 12.15 0.008 3.9 20.31 7.76 0.055 Site 2 7.4 2.93 11.95 0.016 2.3 21.44 5.29 0.109 Site 3 1.4 20.18 3.26 0.078 1.1 20.52 2.90 0.250 Site 4 11.7 8.54 15.17 0.008 0.8 20.99 2.64 0.383 Site 5 9.1 7.32 10.98 0.008 22 22.7 21.08 0.008
TABLE 4. Intersite Comparisons of Phantom ROI Measures: Paired Wilcoxon Signed Rank Test
Uncorrected GNC
Sites Dmeana Dlocationb Lower 95% CI
Upper 95% CI
P-value Dmean Dlocation Lower 95% CI Upper 95% CI P-value 1A to 2 12.5 12.6 8.7 16.2 0.008 1.4 22.0 25.6 2.9 0.383 1A to 3 18.5 18.0 14.2 23.3 0.008 0.2 21.0 22.7 3.3 0.461 1A to 4 8.2 6.7 4.4 12.0 0.008 0.1 0.1 22.8 3.2 0.945 1A to 5 10.8 10.4 6.6 16.1 0.008 2.8 2.0 1.5 5.8 0.008 2 to 3 6.0 5.7 1.2 9.9 0.008 1.2 1.3 22.0 4.6 0.313 2 to 4 4.3 24.0 29.4 0.1 0.055 1.6 1.6 22.4 4.9 0.250 2 to 5 1.7 21.8 26.6 1.8 0.441 4.3 3.9 0.2 7.5 0.039 3 to 4 10.3 210.0 213.8 26.7 0.008 0.3 0.3 21.6 2.7 0.844 3 to 5 7.6 27.4 29.3 26.1 0.008 3.0 3.0 1.7 4.4 0.008 4 to 5 2.6 2.8 20.1 5.0 0.055 2.7 2.8 0.8 4.7 0.016
aDmean: Difference in mean ADC error.
illustrates the range of tumor ROIs analyzed, from a rela-tively small solid tumor (Fig. 6a) to a large tumor with necrotic core (Fig. 6b). Figure 6c,d shows maps of the corre-sponding percent changes in ADC with GNC for these two exams. Despite the large extent of the tumor in Fig. 6b, which results in a large variation in size of the GNC effect across the ROI, the relative spread of the ADC distribution as measured by the standard deviation divided by the mean
did not change much with GNC (original data: mean (SD)51257 307 mm2/s, SD/mean50.24; GNC data: mean (SD)51100 272 mm2/s, SD/mean50.25). This was FIGURE 4: Comparison of gradient modes A and B on the Site
1 scanner.(a,b)Left phantom GNC ADC maps for the two gra-dient modes. Increase in distortion and artifacts are visible in the slower speed gradient B image. (c,d) ADC error profiles along posterior-to-anterior lines as indicated by the arrows in (a,b) for left (c) and right (d) phantoms. Uncorrected (solid lines) and GNC (dashed lines) are shown for gradient system A (thick lines) and B (thin lines).
FIGURE 5: Superior-inferior variations in GNC in the ice water phantom. Axial slice images of the left phantom showing circu-lar ROIs(a)1.2 cm superior offset at edge of the center tube and(b)3.2 cm superior offset in the mixed ice-water region.(c)
Percent error in ADC for the middle ROI, left phantom, for six slices (2.4 cm) within the central tube for each site. Uncor-rected data are shown in cross-hatched bars, GNC data in solid bars. (d)Variation in percent change in ADC with GNC across 18 slices (7.2 cm) for each ROI in the left phantom for Sites 1, 2, 4, and 5. Site 3 used larger blocks of ice, resulting in large signal voids preventing z-axis correction measurements outside of the central tube. Labels give AP position of the ROI. Circles, squares, and triangles represent ROIs 1L, 2L, and 3L, respectively.
true for almost all of the cases investigated, indicating that for individual cases biological variations across the whole-tumor ROI used in this study appear to be larger than the GNC size variations.
Normalized combined ADC histograms for Sites 1, 4, and 5 all showed a noticeable GNC effect, although the Site 5 effect was small, while Site 3 showed essentially identical ADC distributions with and without GNC. Statistical results for the changes in ADC with GNC for each configu-ration and between configuconfigu-rations are given in the top sec-tion of Table 5, for the baseline MR1 visit. All sites showed a statistically significant decrease in ADC with GNC (P<0.01), but the reduction at Site 3 was too small to be of practical significance (20.2%5–2.2*1026mm2/s). MR2 data is not shown but was very similar, with a maximum change with GNC of 212% (2146*1026 mm2/s) for Site 4. Little change in the relative widths (SD/mean) of the tumor ADC distributions was seen with GNC, although Sites 1 and 5 did have small percentage decreases at both visits: Site 1 SD/mean changed 21.7% and25.7%, Site 5
22.3% and 26.4%, for MR1 and MR2, respectively. How-ever, Site 4 SD/mean increased slightly, 1.3% at MR1 and 2.9% at MR2, and Site 3 showed no change. Intersite com-parisons of the percent change in ADC with GNC are given
in the second section of Table 5. The GNC effect at Site 3, running gradient system B, was significantly different from each of the 3 sites running gradient system A.
Results from t-tests on the difference in mean early treatment response in ADC (DADCET) with and without
GNC are given in the third section of Table 5. Mean
DADCET across all patients was effectively unchanged by
GNC: a 9.42% (SD515.7) increase in ADC using uncor-rected data compared to 9.41% (SD515.2) with GNC (P50.96, 95% CI5[–0.58, 0.56]), and no site showed a statistically significant change with GNC. However, there were changes of up to approximately 64% (mean (SD) absolute change 1.66% (1.40%)) in individual patient
DADCETvalues with GNC due to shifts in the tumor ROI
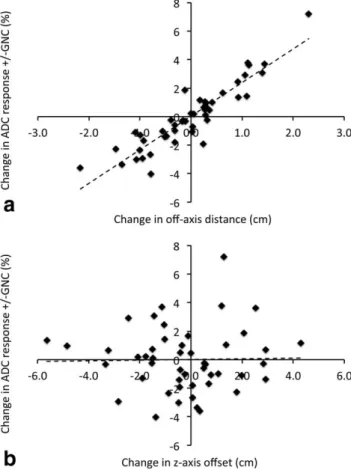
position or extent between MR1 and MR2. Figure 7a shows the difference in DADCETwith and without GNC plotted
against the difference in the in-plane ROI centroid position (ie, off-axis distance from isocenter) between the two visits. A linear regression (dotted line) led to an estimated increase of 2.36% (95% CI5[2.05, 2.67]) in measured DADCET
for each 11 cm change in position of the tumor ROI between visits. The positional changes observed were rela-tively small (mean (SD) change 0.66 (0.54) cm) so that expected changes based on the regression would typically FIGURE 6: Sample slice images with tumor ROIs showing(a)a small solid tumor (Site 3, GE coil, ROI volume54.27 cc, size52.36 32.6431.5 cm3, in-plane position58.68L, 1.22A) and(b)a large ring-shaped tumor around a necrotic core (Site 1, Hologic coil, ROI volume5291 cc, size5103 11.538.9 cm3, in-plane position59.9R, 3.8A). (c,d)The corresponding color-coded maps of
not be higher than 4%. The corresponding estimated Pearson’s correlation ofr50.91 (95% CI: 0.85, 0.95) indi-cates that position shifts of the tumor ROI can explain the bulk of the GNC variation in measuredDADCET. A similar
analysis of change in DADCET versus z-axis (S-I direction)
position changes between visits led to an estimated 0.02% (CI 20.31, 0.36) increase in measured DADCET for each 11 cm change in the z-axis, shown in Figure 7b (mean (SD) z-axis position change 1.51 (1.29) cm). The corre-sponding estimated correlation was r50.02 (95% CI
20.26, 0.30), altogether indicating that GN changes due to z-axis shifts in position have at most a limited effect on ADC treatment response measures. Note that all percentage changes in DADCET given refer to absolute changes in the
DADCET measurement, not percentage changes of that
measurement. DISCUSSION
In this study we examined the effects of GNC on ADC measurements in a breast cancer multisite trial setting using phantom and human MRI data. Using a known ADC
refer-ence phantom (water at 0C), we found a wide range of errors in uncorrected scans. These errors were highly dependent on the gradient system and measurement posi-tion. In geometries typical for clinical breast imaging the uncorrected errors in ADC increased with distance from the magnet isocenter, ranging from over 30% to less than 1%. The ADC errors were in almost all cases positive, implying a higher true b value than the nominal programmed b value for the acquisition. This was expected, given the large lateral offsets (8–10 cm) for all ROIs examined and the known GN trend to increase gradient strength with increased lateral or vertical displacement from the isocenter. In 37 of 40 phantom ROI locations GNC reduced ADC error, in many cases dramatically, indicating a robust correction for GN errors.
Large lateral offsets are unavoidable for breast imaging in horizontal bore clinical MRI scanners, but offsets from isocenter in the AP direction can also be sizeable and dependent on the breast coil used. A recent study of normal breast using DTI found variations in breast tissue ADC along the AP direction,12 which parallel our observations of
TABLE 5. Human Subject Results Mean ADC MR1
(x1026mm2/s) paired
t-test by site
EstimatedDmean with GNC
Lower 95% CI Upper 95% CI P-value
Site 1A 2135.6 2155.6 2115.5 4.7*10214
Site 3 22.3 23.6 20.9 0.0096
Site 4 2130.5 2179.6 281.4 0.0001
Site 5 291.4 2126.1 256.6 0.0003
% change ADC with GNC inter-site comparison 2 sample t-test
Difference in estimated means (%)
Lower 95% CI Upper 95% CI P-value
Site 1A to Site 3 11.08 212.46 29.71 5.1*10216 Site 1A to Site 4 20.14 23.84 4.12 0.9407 Site 1A to Site 5 24.04 1.24 6.84 0.0079 Site 3 to Site 4 10.94 214.78 27.11 8.2*1025 Site 3 to Site 5 7.04 29.63 24.45 0.0002 Site 4 to Site 5 23.90 20.44 8.25 0.0751 DADCET(% change) pairedt-test by site
EstimatedDmean with GNC
Lower 95% CI Upper 95% CI P-value
All patients 20.01 20.58 0.56 0.94
Site 1A 0.14 20.78 1.07 0.75
Site 3 20.04 20.16 0.07 0.35
Site 4 20.86 22.03 0.30 0.13
increasing ADC with increasing anterior offset in the phan-tom scans. This effect was seen most clearly in data from sites using the Sentinelle coil, which positioned the phan-tom more anterior (6 cm) than the GE coil. In all cases GNC effectively removed these variations, leaving no appa-rent systematic trends in ADC error with AP position. It was not clear in our study whether the observed difference in AP position between the two coil types was only due to phantom-specific positioning differences or would carry over into human imaging. The observed difference in mean AP tumor ROI position for the in vivo scans, 1.2 cm, was much smaller than the 6 cm difference observed in the phantom scans, but the relatively small sample size and large variability in breast size and tumor position within the breast do not allow us to draw any conclusions about sys-tematic biases in positioning between the two coil designs.
Longitudinal (superior/inferior) direction offsets appear to be the least significant source of GN errors of the three axes in breast DWI. While the phantom geometry did not
allow precise mapping of ADC error beyond about 61 cm from the isocenter in the SI direction, we did map the GNC effect out to 63.2 cm and observed a maximum change in the ADC correction factor from GNC of 2.5% in this range. Given the limited extent of SI-direction avail-able for measurement, our observations were consistent with that reported elsewhere on other scanners.11 Qualitatively, we observed that the GNC correction was also able to restore ADC uniformity in the SI direction.
We found marked differences in the system character-istics between the two gradient modes on the "dual-speed" scanner, illustrating tradeoffs that must be made in system design between speed and linearity, and thereby in imaging use between qualitative image quality and quantitative accu-racy. While gradient system A, with higher SR and Gmax,
provided clearly superior qualitative image quality by allow-ing lower TE and ESP to be prescribed, the high GN errors resulted in a failure of the qualification standards for the ACRIN 6698 study. In contrast, gradient system B provided sufficient quantitative ADC accuracy, but did not provide sufficient image quality for clinical application with the specified study diffusion protocol. Application of GNC allowed the use of system A gradients at this site for quanti-tative studies, in fact reducing the ADC errors in the phan-tom studies to the lowest level of all equipment configurations investigated.
Our human studies demonstrated the magnitude of GN effects in breast imaging, and also the high degree of variability between scanner configurations. The effects resulting from spatial offsets in the RL and AP directions dominated those of offsets in the SI direction, in particular when longitudinal changes in ADC were measured. We did not observe a reduction in the relative spread of ADC values on an individual-ROI basis, even in cases of extended ROIs with a large spread in GNC values, nor on a site-basis. This would indicate that the intrasubject and intersubject ADC variability is large compared to the GNC effects.18 This may be partly explained by our use of whole tumor multi-slice ROIs, versus single-multi-slice tumor ROIs which have been used in other studies evaluating ADC in breast cancer.19,20 Further work is under way on optimizing ROI definition for treatment response studies, which could better demon-strate the improvements in accuracy obtained with GNC. Although our study focused on absolute ADC measurement, we note that GN effects may also be of significant interest in relative measurement, eg, when normalizing diseased tis-sue ADC to normal tistis-sue ADC, or for diagnostic tests for malignancy.
A limitation of this study is the relatively small num-ber of gradient systems tested due primarily to the software restriction to GE scanners. Further work with either manufacturer-independent correction schemes, or with pro-prietary GNC programs from the other manufacturers of FIGURE 7: Absolute change in measured ADC response
(DADCET5percent change of the mean tumor ADC between
MR1 and MR2) with application of GNC plotted versus differ-ence in(a)the off-axis (combined AP and RL) distance and(b)
the z-axis (SI) distance from magnet isocenter of the respective MR1 and MR2 ROIs. On average, each 11 cm change in off-axis position of the tumor ROI is seen to result in an apparent increase in the measured ADC response of 2.36% (CI 2.05, 2.67). No significant changes were observed due to changes in z-axis position.
MRI scanners, is needed to fully map out the extent of the variability in GN ADC errors across multicenter clinical breast cancer trials. Extension to higher field strengths is also needed due to the increasing use of 3.0T scanners for breast imaging. In addition, this study looked only at a sin-gle type of ROI definition for measuring tumor ADC change. The effects of GNC on the measurement of change in ADC with treatment with different ROI definition parameters still need to be investigated.
In conclusion, this study illustrates the benefits of applying GNC to multicenter breast diffusion studies for more accurate quantification of ADC. If GNC is not avail-able, the results show the need in longitudinal studies to avoid switching between scanner configurations, including receiver coil and multiple gradient modes, for sequential exams on a given patient. GNC will need to be applied in order to eliminate a significant source of error when com-bining results from multiple sites for analysis.
CONFLICT OF INTEREST
ETT and LM are employees of General Electric Company; TC is co-inventor of IP assigned to and managed by the University of Michigan. No other authors have any conflicts of interest to declare.
Contract grant sponsor: National Institutes of Health / National Cancer Institute (NIH/NCI); Contract grant num-bers: UO1 CA151235, U01 CA166104; Contract grant sponsor: NCI; Contract grant numbers: U01 CA079778 and CA080098 to ACRIN.
REFERENCES
1. Partridge SC, Rahbar H, Murthy R, et al. Improved diagnostic accuracy of breast MRI through combined apparent diffusion coefficients and dynamic contrast-enhanced kinetics. Magn Reson Med 2011;65:1759– 1767.
2. Pickles MD, Gibbs P, Lowry M, Turnbull LW. Diffusion changes pre-cede size reduction in neoadjuvant treatment of breast cancer. Magn Reson Imaging 2006;24:843–847.
3. Jackson EF, Barboriak DP, Bidaut LM, Meyer CR. Magnetic resonance assessment of response to therapy: tumor change measurement, truth data and error sources. Transl Oncol 2009;2:211–215.
4. Bammer R, Markl M, Barnett A, et al. Analysis and generalized correc-tion of the effect of spatial gradient field distorcorrec-tions in diffusion-weighted imaging. Magn Reson Med 2003;50:560–569.
5. Bernstein MA, Polzin, JA. Method and system for correcting errors in MR images due to regions of gradient non-uniformity for parametric
imaging such as quantitative flow analysis. United States patent: Gen-eral Electric Company (Milwaukee, WI); 2000.
6. Malyarenko DI, Ross BD, Chenevert TL. Analysis and correction of gradient nonlinearity bias in apparent diffusion coefficient measure-ments. Magn Reson Med 2013 [Epub ahead of print].
7. Tan ET, Marinelli L, Slavens ZW, et al. Improved correction for gradi-ent nonlinearity effects in diffusion-weighted imaging. J Magn Reson Imaging 2013;38:448–453.
8. Glover GH, Pelc NJ. Method for correcting image distortion due to gradient nonuniformity. United States patent: General Electric Com-pany (Milwaukee, WI); 1986.
9. Janke A, Zhao H, Cowin GJ, et al. Use of spherical harmonic decon-volution methods to compensate for nonlinear gradient effects on MRI images. Magn Reson Med 2004;52:115–122.
10. Mattiello J, Basser PJ, Lebihan D. Analytical expressions for the b-matrix in NMR diffusion imaging and spectroscopy. J Magn Reson Ser A 1994;108:131–141.
11. Malyarenko D, Galban CJ, Londy FJ, et al. Multi-system repeatability and reproducibility of apparent diffusion coefficient measurement using an ice-water phantom. J Magn Reson Imaging 2013;37:1238– 1246.
12. Partridge SC, Murthy RS, Ziadloo A, et al. Diffusion tensor magnetic resonance imaging of the normal breast. Magn Reson Imaging 2010; 28:320–328.
13. Padhani AR, Liu G, Koh DM, et al. Diffusion-weighted magnetic reso-nance imaging as a cancer biomarker: consensus and recommenda-tions. Neoplasia 2009;11:102–125.
14. Thoeny HC, Ross BD. Predicting and monitoring cancer treatment response with diffusion-weighted MRI. J Magn Reson Imaging 2010; 32:2–16.
15. Baron CA, Lebel RM, Wilman AH, Beaulieu C. The effect of concomi-tant gradient fields on diffusion tensor imaging. Magn Reson Med 2012;68:1190–1201.
16. Chenevert TL, Galban CJ, Ivancevic MK, et al. Diffusion coefficient measurement using a temperature-controlled fluid for quality control in multicenter studies. J Magn Reson Imaging 2011;34:983–987. 17. van ’t Veer LJ, Dai H, van de Vijver MJ, et al. Gene expression
profil-ing predicts clinical outcome of breast cancer. Nature 2002;415:530– 536.
18. Partridge SC, McKinnon GC, Henry RG, Hylton NM. Menstrual cycle variation of apparent diffusion coefficients measured in the normal breast using MRI. J Magn Reson Imaging 2001;14:433–438. 19. Fangberget A, Nilsen LB, Hole KH, et al. Neoadjuvant chemotherapy
in breast cancer-response evaluation and prediction of response to treatment using dynamic contrast-enhanced and diffusion-weighted MR imaging. Eur Radiol 2011;21:1188–1199.
20. Nilsen L, Fangberget A, Geier O, et al. Diffusion-weighted magnetic resonance imaging for pretreatment prediction and monitoring of treatment response of patients with locally advanced breast cancer undergoing neoadjuvant chemotherapy. Acta Oncol 2010;49:354– 360.