TOWARDS MODELLING OF VISUAL SALIENCY IN POINT CLOUDS
FOR IMMERSIVE APPLICATIONS
Evangelos Alexiou, Peisen Xu
∗, Touradj Ebrahimi
†´
Ecole Polytechnique F´ed´eral de Lausanne (EPFL)
Multimedia Signal Processing Group (MMSPG)
[email protected]
ABSTRACT
Modelling human visual attention is of great importance in the field of computer vision and has been widely explored for 3D imaging. Yet, in the absence of ground truth data, it is unclear whether such predictions are in alignment with the ac-tual human viewing behavior in virac-tual reality environments. In this study, we work towards solving this problem by con-ducting an eye-tracking experiment in an immersive 3D scene that offers 6 degrees of freedom. A wide range of static point cloud models is inspected by human subjects, while their gaze is captured in real-time. The visual attention information is used to extract fixation density maps, that can be further ex-ploited for saliency modelling. To obtain high quality fixa-tion points, we devise a scheme that utilizes every recorded gaze measurement from the two eye-cameras of our set-up. The obtained fixation density maps together with the recorded gaze and head trajectories are made publicly available, to en-rich visual saliency datasets for 3D models.
Index Terms— visual saliency, immersive environments, point clouds, virtual reality, eye-tracking
1. INTRODUCTION
Visual saliency is a fundamental topic that studies the identi-fication of the regions of a scene that draw the attention of ob-servers. Models that predict human visual attention are attrac-tive in computer vision and signal processing communities, and have been proposed for radically different types of imag-ing. For 3D visual information, several algorithms are re-ported for predicting salient regions, based on mesh and point cloud data. Well-known mesh-based saliency schemes de-pend on center-surround filters with Gaussian-weighted cur-vatures [1], shape matching algorithms [2], per vertex dis-tinctness with shape extremities and patch association [3], lo-cal contrast and global rarity [4], and spectral attributes [5].
∗At the time of writing, the author was an exchange student at ´Ecole
Poly-technique F´ed´eral de Lausanne from Nanyang Technology University.
†This work has been conducted in the framework of the Swiss National
Foundation for Scientific Research project Advanced Visual Representation and Coding in Augmented and Virtual Reality (FN 178854).
Point cloud-based models rely on regional contrast using lo-cal shape descriptors to identify distinctness per point [6] or cluster [7], and covariance descriptors [8]. Readers can refer to [9] for a detailed survey.
Visual saliency models are typically validated using as ground-truth fixation density maps that are collected from eye-tracking experiments. In the case of 3D imaging, a lim-ited number of studies has been recorded. Howlett et al. [10] conducted an eye-tracking experiment on mesh simplification algorithms. The subjects were able to examine the degraded models from different viewports through rotation using key arrows. In [11], the performance of [1] was assessed using gaze data that were obtained after inspection of projected im-ages from meshes. Wang et al. [12] performed an experiment with 3D printed figures. This work was recently extended to account for different viewing positions and model construc-tion materials [13]. Lavou´e et al. [14] carried an eye-tracking campaign with animated videos of 3D meshes. Several influ-encing factors were considered, such as model shape, camera position, material, and illumination.
Although the experimental settings that are typically em-ployed in the aforementioned studies provide accurate gaze measurements in highly controlled set-ups, they lead to rather unnatural ways of consumption, with limited or non-existent user engagement. Furthermore, despite the current availabil-ity of dedicated virtual realavailabil-ity (VR) platforms, the influence of visualizing 3D models in immersive experiences hasn’t been explored yet. Visual saliency of VR contents has been inves-tigated in the form of omnidirectional image and video se-quences using head-mounted displays (HMDs). Specifically, several testbeds [15, 16] and datasets [17, 18, 19] have been proposed for gaze- and/or head-tracking data. In [20], the au-thors performed a thorough analysis on gaze and head data collected from extensive experimentation using static omni-directional panoramas on several testing set-ups.
In this study we extend the state-of-the-art by tracking the visual attention of observers in an immersive VR experience with 6 degrees of freedom (DoF). Considering the emerging trends in 3D imaging, point clouds were used to represent the models under inspection. To motivate user exploration, a
task-dependent protocol was adopted. The obtained visual at-tention information is assembled and provided in the form of fixation density maps. Furthermore, a methodology to retain low error gaze measurements for the estimation of fixation points is employed and described. We consider this work as a first step towards visual saliency of 3D models in VR.
2. EXPERIMENT 2.1. Apparatus
The virtual environment was designed in Unity. An HTC Vive Pro headset was used as a viewport to the virtual world with a resolution of 2880x1600 pixels (1400x1600 per eye, 615 ppi), a field of view of110◦, and a frame rate of 90 Hz. To capture gaze data, the Pupil Labs hardware1was attached to the
head-set, consisting of two eye-cameras that track both eyes inde-pendently at a frequency of 120 Hz with an accuracy of0.60◦ under ideal conditions. The acquired information consists of gaze positions in viewport space and associated quality val-ues. The headset position was tracked by VIVE base stations that were installed in the physical room. Both eye- and head-data streams were delivered to Unity and synchronized with the rendering frame rate. Thus, the recorded data correspond to frames that were displayed to each user.
2.2. Models
In this study, 12 static point clouds were selected (6 objects and 6 human figures), the majority of which has been used in JPEG and MPEG standardization activities. The acquisi-tion technique for each model varies, thus leading to different types of artifacts on their structure and texture. To minimize the impact of geometrical irregularities, the contents were ini-tially voxelized. The voxel depth was selected per model after ensuring high system responsiveness to avoid discomfort.
2.3. Procedure
A training phase preceded the actual test, where subjects fa-miliarized themselves with the virtual environment and the navigation means on a dummy content. After feeling com-fortable with the set-up, they were asked to proceed to the actual experiment. The test was split in two rounds (15-20 minutes each), with a mandatory 5-minute break in between. The test was introduced by stating the task that was assigned to the observers: “We ask you to examine a set of models; after visualization, we will ask you to order them based on your preference. We will also ask what is the criterion of your preference”. The subjects were informed that it was not necessary to remember any model, as access to corresponding images would be given at the end of each round. To facilitate their task and to identify potential divergence in the criteria of
1https://pupil-labs.com/
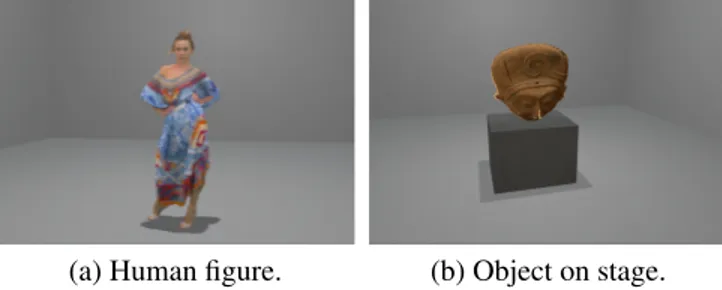
(a) Human figure. (b) Object on stage.
Fig. 1. Virtual reality scene.
preference, in the first round the set of 6 objects was visual-ized, while in the second, the 6 human figures were inspected in random order. No time limitations were applied for the training, or the actual test.
For every test model and for each subject, a session was split into three consecutive steps: (i)external calibration, (ii)
inspection of model, and (iii)internal error profiling. Exter-nal calibrationwas conducted to map the pupil positions cap-tured from the eye-cameras to viewport coordinates. For this purpose, the software for HMDs from Pupil Labs was used with 7 markers in a 2D calibration mode.Inspection of models
was the step where the participants consumed the 3D model, while their viewing behaviour was recorded. Although par-ticular care was devoted to place the headset and adjust the eye-camera parameters for every subject before starting the test, potential HMD displacements can occur during the in-spection. Thus,internal error profilingwas issued at the end of each session, assuming a worst-case scenario for HMD slippage at that point, to compute the average angular error in a regular grid of 9 pre-defined positions (markers). The center-top, bottom, left and right markers were positioned at±18.25◦ in the vertical and horizontal axes, respectively, while the visual angle between the middle and corner mark-ers was25◦. A threshold of7.5◦was used to discard uninten-tional gazing, and a minimum of 100 samples was required; in case of fewer samples, a marker was classified asinvalid.
2.4. Virtual reality environment
The testing environment consisted of a non-distracting virtual room in the shape of a parallelepiped (10x10x5 virtual units), with mid-grey walls. The models were placed in the middle of the room and were scaled appropriately. Smaller objects were placed on top of a stage to allow natural viewing. To en-hance realism, real-time lighting was applied to the scene us-ing a point light source, while shadows were enabled through a custom script developed by the authors. In particular, by projecting vectors defined from the position of the light and every point of the content, a shadow texture was computed and applied on a quad primitive object, simulating a first or-der light reflection. The obtained shadow texture was placed underneath the model. Examples of the VR scene with two different contents are illustrated in Fig. 1.
Every model was loaded in Unity using the Pcx importer2, which converts a point cloud into a mesh-based object. The default renderer provides the options to display a content as a set of a raw points, squares, or disks of fixed size. A cus-tom implementation of a shader to represent each point as a primitive paraboloid [21] was integrated into the software; we also enhanced the default rendering options by allowing adaptive primitive sizes based on local resolutions. In our experiment, paraboloids of adaptive size based on 5 nearest neighbors were used, which resulted in watertight models.
To account for an immersive VR experience with 6 DoF, the users were able to physically navigate the real world space (3.5x3.5 meters), while also rotate their body and orient their head to capture their preferred view of the model under in-spection. Furthermore, to facilitate user interaction, an intu-itive motion control was designed that allowed users to tele-port to the position of their preference (i.e., locomotion), and rotate the camera left-wise and right-wise around the vertical axis using the left and right VIVE controllers, respectively.
2.5. Participants
A total of 21 subjects (9 females) was recruited for this study (average age 26.7 years). Before starting the test, visual acu-ity and color vision of every subject was tested using Snellen and Ishihara charts. The interpupillary distance was measured and the headset was adjusted by the operator accordingly.
3. DATA PROCESSING
The recorded data consist of left and right gaze positions, es-timated after mapping the pupil positions in viewport space, which is normalized and relative to the camera. The mid-dle gaze position is also obtained as a simple average of the above. Thus, provided the camera position, for every human gaze sample, we get three distinct measurements from left, right and middle (gaze types) gaze positions that approximate the actual point of gaze. Instead of selecting only one out of these three measurements, considering that physical move-ments may affect the accuracy of pupil detection on differ-ent regions of the screen due to HMD slippage, we devise a method to keep gaze positions of lower angular error.
Initially, for every human gaze sample, the quality value assigned to the right and left gaze position is assessed, indi-vidually. A gaze position is discarded if the quality value is lower than 0.5. If at least one is discarded, the middle gaze position cannot be used. In case both values are 0, the sample is classified as blink. Moreover, a gaze position is discarded if it is outside the range determined by the markers’ position. After removing low-confidence and out-of-range gaze po-sitions, the angular error of each remaining gaze position is estimated. For this purpose, the data collected from the in-ternal error profilingestablished after each session are used,
2https://github.com/keijiro/Pcx
where the average angular error at each marker is estimated, for every gaze type. For each gaze position, the 4 markers surrounding it are selected. There are two triangles enclosing a point that is lying between four equally spaced vertices. We consider both, starting from the triangle whose vertices are closest to the gaze position. A barycentric interpolation with weights equal to the corresponding angular errors obtained from the profiling is applied. If there is aninvalidmarker in the first triangle, we proceed to the second. If there is an in-validmarker in the second triangle too, the gaze position is discarded. Finally, among the remaining gaze positions, the gaze type with the smallest angular error is kept. This is re-peated for every human gaze sample to maintain high quality estimations while avoiding discarding useful data.
To identify fixation points, the dispersion-based I-DT al-gorithm [22] is employed with 150 ms minimum duration and1◦maximum dispersion. The window length is adjusted to avoid duplicated fixations. An additional constraint that a fixation can only be obtained from consecutive measurements of the samegaze typeis set, while a minimum number of 4 samples is required for a period of 150 ms.
After a fixation is detected, the average gaze position is estimated over the duration of the fixation. The correspond-ing average angular error is computed based on barycentric interpolation, similarly to what has been done for individual gaze positions. If the fixation point is out-of-range, or there is no triangle with valid markers, the fixation is discarded. Otherwise, the direction of the fixation is computed as the vector between the average camera and average gaze position in world coordinates, over the duration of the fixation.
A cone is cast towards this direction, and the points of the model that fall inside the cone are collected. Since no colliding can be achieved with points, a set of angles and dis-tances to split the cone into a non-overlapping set of volumes is defined, which we call cone-sectors. Moreover, a thresh-old of acceptable depth for the points that lie in a cone-sector is determined, leading to a truncated-cone-sector. The lat-ter is defined by the current cone-sector, the enclosed point that is closest to the origin, and the acceptable depth along the direction of the cone. Once a truncated-cone-sector is identified, the remaining points lying in the same cone-sector are not considered. Thus, frontal points of the model are se-lected, while points that correspond to occluded regions are discarded. This procedure is repeated for every cone-sector, and the resultant set of points constitutes the fixation.
Finally, the points determined from the procedure above are weighted as follows. Letfbe a fixation with angular error θand durationt. Letxbe a point of the fixation,pits distance from the central ray of the cone, anddthe distance between the origin and the projection ofxonto the ray. Withσf =
d·tan(θ), the weight of the pointxis given as:
w(x) = q t 2πσ2 f e− p2 2σ2f . (1)
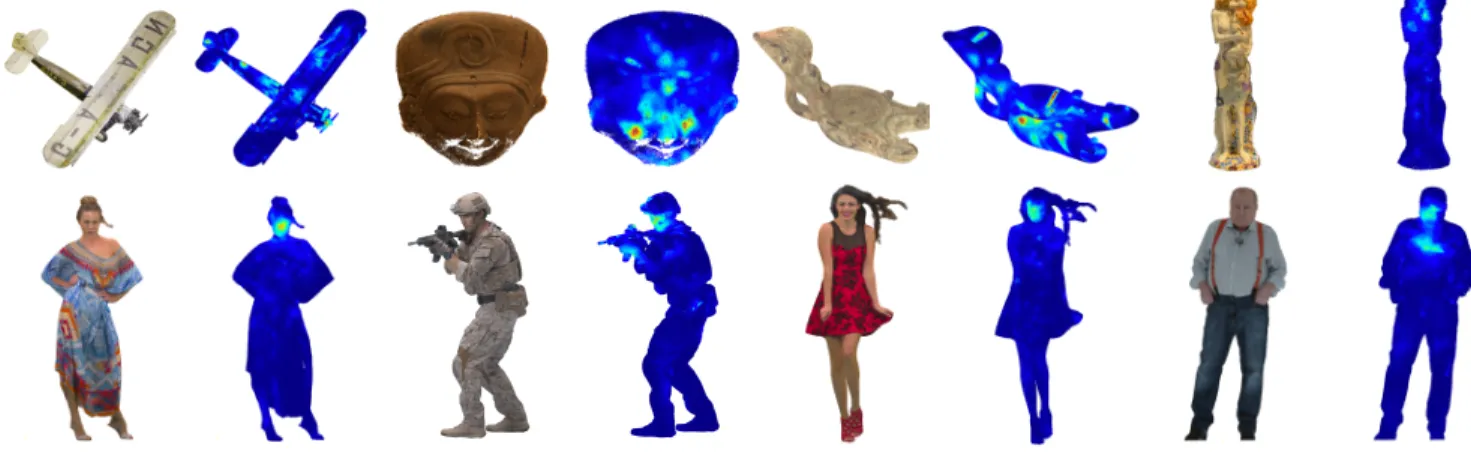
Fig. 2. A sub-set of the test models with corresponding fixation density maps. Sessions where a high percentage of fixations come from
low-quality, or out-of-range gaze measurements should be avoided, as they would not be representative of the entire viewing experience of one user. Thus, sessions with good tracking accuracy and high percentage of in-range fixations are determined; the former is based on the ratio of the total number of low-confidence gaze positions excluding blinks, divided by the total number of gaze positions, whereas the latter is based on the ratio of in-range divided by the total fixations. A threshold of 17.5% is set for low-confidence and75%for in-range fixations. If both conditions are satis-fied, a session is qualified as valid. The fixation points from valid sessions are aggregated across the subjects for each model, forming a fixation density map.
4. RESULTS
Following the proposed method, 73% of the sessions were used to form fixation density maps (15.25±2.5subjects per model), with an average of10%low-confidence gaze samples and92%in-range fixations. The average number of valid fix-ations per model is44.1±7, with a duration of259.1±30.5 ms, and an angular error of1.9◦±0.84◦. This corresponds to a reduction of99.1%,85.5%, and109.6%with respect to the angular error estimated after theinternal error profilingfor the right, left, and middle gaze, on the same set of sessions.
In Fig. 2, the fixation density maps are illustrated for the modelsbiplane3,egyptian mask4,romanoillamp3,statue klimt4, longdress [23], soldier [23], redandblack [23], ulli wegner[24]. It can be seen that visual attention is attracted by low-level features such as edges and contrast, and high-level features such as faces. Attention is also drawn on text and signs (e.g.,biplane), as well as unexpected objects (e.g., chest ofulli wegner). These observations are in alignment with trends observed in visual attention experiments using
3https://jpeg.org/plenodb/
4http://mpegfs.int-evry.fr/MPEG/PCC/DataSets/pointCloud/CfP/datasets/
other types of imaging modalities in different environments. The average time of interaction found to be similar for both objects and human figures datasets (60.9±10.7against 56.4±4.6sec.). A tendency of subjects spending more time on bigger and more complicated objects (e.g.,biplane) was naturally observed. The models were mostly inspected from mid- to close-range distances. For example, the76%of the recorded gaze samples in the human figures dataset (height of 1.85 virtual units) are collected from distances of inspection that lie inside a circle of radius 2.5 virtual units.
Based on post-questionnaires, the majority of the partici-pants were naive users of VR. The immersion level and the to-tal quality of experience was reported to be high, with grades of 4.15 and 4.35 out of 5, respectively. The visual quality of the contents under inspection was graded as 3.7. For the above questions a 5-grading scale was used (5: Excellent, 4:
Good, 3:Fair, 2:Poor, 1: Bad). The discomfort levels were rated low, with 1.15 out of 3 (1: No, 2: Mild, 3: Strong). Regarding the criteria of preference, “realistic” (6), “details (e.g., hair)” (6), “friendliness” (3), and “color” (3) were the most common keywords for human figures, while the most popular for objects were “realistic” (5), “smoothness” (3), “color” (3), and “aesthetic” (2). In parenthesis, the number of keyword occurrence is indicated, in a total of 21 subjects.
5. CONCLUSIONS
In this study, an eye-tracking experiment in VR was con-ducted adopting a 6 DoF task-dependent viewing scenario. To obtain accurate fixation density maps and compensate limita-tions of consumer market hardware, a method to exploit the highest-quality recorded gaze measurements was introduced based on a per-session profiling, reducing remarkably the av-erage angular error. Moreover, a scheme to determine areas of fixations in a point cloud has been proposed. The result-ing fixation density maps along with the recorded material are made publicly available in the following URL:mmspg. epfl.ch/visual-attention-point-clouds/.
6. REFERENCES
[1] C. H. Lee, A. Varshney, and D. W. Jacobs, “Mesh saliency,” inACM SIGGRAPH 2005 Papers, New York, NY, USA, 2005, SIGGRAPH ’05, pp. 659–666, ACM. [2] P. Shilane and T. Funkhouser, “Distinctive regions of
3D surfaces,” ACM Trans. Graph., vol. 26, no. 2, June 2007.
[3] G. Leifman, E. Shtrom, and A. Tal, “Surface regions of interest for viewpoint selection,” in2012 IEEE Confer-ence on Computer Vision and Pattern Recognition, June 2012, pp. 414–421.
[4] J. Wu, X. Shen, W. Zhu, and L. Liu, “Mesh saliency with global rarity,” Graph. Models, vol. 75, no. 5, pp. 255–264, Sept. 2013.
[5] R. Song, Y. Liu, R. R. Martin, and P. L. Rosin, “Mesh saliency via spectral processing,” ACM Trans. Graph., vol. 33, no. 1, pp. 6:1–6:17, Feb. 2014.
[6] E. Shtrom, G. Leifman, and A. Tal, “Saliency detection in large point sets,” in2013 IEEE International
Confer-ence on Computer Vision, Dec 2013, pp. 3591–3598.
[7] F. P. Tasse, J. Kosinka, and N. Dodgson, “Cluster-based point set saliency,” in Proceedings of the 2015 IEEE
International Conference on Computer Vision (ICCV),
Washington, DC, USA, 2015, ICCV ’15, pp. 163–171, IEEE Computer Society.
[8] Y. Guo, F. Wang, and J. Xin, “Point-wise saliency de-tection on 3D point clouds via covariance descriptors,”
Vis. Comput., vol. 34, no. 10, pp. 1325–1338, Oct. 2018. [9] X. Liu, L. Liu, W. Song, Y. Liu, and L. Ma, “Shape con-text based mesh saliency detection and its applications,”
Comput. Graph., vol. 57, no. C, pp. 12–30, June 2016. [10] S. Howlett, J. Hamill, and C. O’Sullivan, “Predicting
and evaluating saliency for simplified polygonal mod-els,” ACM Trans. Appl. Percept., vol. 2, no. 3, pp. 286– 308, July 2005.
[11] Y. Kim, A. Varshney, D. W. Jacobs, and F. Guimbreti`ere, “Mesh saliency and human eye fixations,” ACM Trans. Appl. Percept., vol. 7, no. 2, pp. 12:1–12:13, Feb. 2010. [12] X. Wang, D. Lindlbauer, C. Lessig, M. Maertens, and
M. Alexa, “Measuring the visual salience of 3D printed objects,” IEEE Computer Graphics and Applications, vol. 36, no. 4, pp. 46–55, July 2016.
[13] X. Wang, S. Koch, K. Holmqvist, and M. Alexa, “Track-ing the gaze on objects in 3D: How do people really look at the bunny?,” ACM Trans. Graph., vol. 37, no. 6, pp. 188:1–188:18, Dec. 2018.
[14] G. Lavou´e, F. Cordier, H. Seo, and M.-C. Larabi, “Vi-sual attention for rendered 3D shapes,”Comput. Graph. Forum, vol. 37, pp. 191–203, 2018.
[15] E. Upenik, M. ˇReˇr´abek, and T. Ebrahimi, “Testbed for subjective evaluation of omnidirectional visual content,”
in2016 Picture Coding Symposium (PCS), Dec 2016,
pp. 1–5.
[16] A. De Abreu, C. Ozcinar, and A. Smolic, “Look around you: Saliency maps for omnidirectional images in vr ap-plications,” in2017 Ninth International Conference on
Quality of Multimedia Experience (QoMEX), May 2017,
pp. 1–6.
[17] X. Corbillon, F. De Simone, and G. Simon, “360de-greee video head movement dataset,” inProceedings of
the 8th ACM on Multimedia Systems Conference, New
York, NY, USA, 2017, MMSys’17, pp. 199–204, ACM. [18] E. J. David, J. Guti´errez, A. Coutrot, M. P. Da Silva, and P. Le Callet, “A dataset of head and eye movements for 360◦videos,” inProceedings of the 9th ACM
Multi-media Systems Conference, New York, NY, USA, 2018,
MMSys ’18, pp. 432–437, ACM.
[19] S. Knorr, C. Ozcinar, C. O Fearghail, and A. Smolic, “Director’s cut - a combined dataset for visual attention analysis in cinematic VR content,” inThe 15th ACM SIGGRAPH European Conference on Visual Media Pro-duction, 2018.
[20] V. Sitzmann, A. Serrano, A. Pavel, M. Agrawala, D. Gutierrez, B. Masia, and G. Wetzstein, “Saliency in VR: How do people explore virtual environments?,”
IEEE Transactions on Visualization and Computer Graphics, vol. 24, no. 4, pp. 1633–1642, April 2018. [21] M. Sch¨utz and M. Wimmer, “High-quality point-based
rendering using fast single-pass interpolation,” in2015 Digital Heritage, Sep. 2015, vol. 1, pp. 369–372. [22] D. D. Salvucci and J. H. Goldberg, “Identifying
fixa-tions and saccades in eye-tracking protocols,” in Pro-ceedings of the 2000 Symposium on Eye Tracking
Re-search & Applications, New York, NY, USA, 2000,
ETRA ’00, pp. 71–78, ACM.
[23] E. d’Eon, B. Harrison, T. Myers, and P. A. Chou, “8i voxelized full bodies, version 2 – a voxelized point cloud dataset,” ISO/IEC JTC1/SC29 Joint WG11/WG1 (MPEG/JPEG) Doc. m40059/M74006, Jan. 2017. [24] T. Ebner, I. Feldmann, O. Schreer, P. Kauff, and
T. Unger, “HHI point cloud dataset of a boxing trainer,” ISO/IEC JTC1/SC29/WG11 Doc. m42921, Jul. 2018.