for Your Molar Mass Range
Daniela Held,PSS Polymer Standards Service GmbH, Mainz, Germany.
Resolution, molar mass separation range, solvent consumption, and analysis time are key factors that have to be balanced when performing gel permeation chromatography/size-exclusion chromatography (GPC/SEC). Depending on the application and environment, whether routine quality control (QC) or research and development (R&D), one of these parameters can be dominant and will affect GPC/SEC column selection.
The concept of specifi c resolution has been developed for GPC/SEC to understand and compare resolution and to determine the infl uence of the molar mass accuracy.1
Inspection of the calibration curve of a GPC/SEC column can give a good indication of resolution. The slope of the calibration curve directly indicates resolution; the fl atter the slope, the higher the resolution.2
Good resolution (a fl at slope) can only be achieved for a limited molar mass separation range when one column is used, which is acceptable for protein (or antibody) and oligomer analysis. However, when analyzing synthetic polymers or natural macromolecules
effi cient separation over a large molar mass separation range is required. For this, columns of the same dimensions and particle size (but different porosity) are often coupled in series. This is a very successful approach but has some potential pitfalls such as mismatch, which can lead to artifacts in chromatograms and the resulting molar mass distributions.
Column Types
In general, linear, mixed-bed, or multipore columns have a broad pore size distribution and cover a wide molar mass range with a constant resolution. Single porosity columns with a narrow pore size distribution cover a smaller molar mass separation range but with a high resolution. Resolution can be increased for all types of columns by adding a column of the same type and porosity. The separation range of single porosity columns can be expanded by adding a column of the same type with different, correctly matched porosity. The differences between linear, mixed-bed, multipore columns, and single porosity columns was covered in detail in a past instalment of Tips
Shoulders in gel permeation/size-exclusion chromatograms (GPC/SEC) can be a result of sample characteristics or down to the wrong choice of
columns or column combinations. Proper selection helps to measure true results.
re d it : D a n ie l Ku li n sk i/ G e tt y I m a g e s
Selecting the Upper Molar Mass Separation Limit
When selecting a column or combination of columns for GPC/SEC, users often only know the approximate average molar mass (average weight molecular [Mw]). However, wrong column choices
can be made if the breadth of the molar mass distribution (related to the polydispersity index [PDI]) of the sample is not considered.
For example: If a typical sample PDI value for synthetic polymers, produced by free-radical polymerization, is two, the molar mass range covered can be very broad. In this case, users should select an upper molar mass limit that is 10× higher than the Mw of the highest samples
to be analyzed. Figure 1 shows the molar mass distribution for a European reference material, a poly(styrene) of Mw = 181,200 Da and
PDI = 2.26. Although the average molar mass is relatively low for this polymer, molar masses up to 2 million Dalton are present.
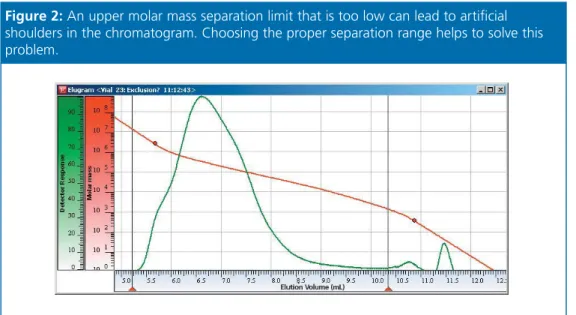
Figure 2 shows an example of when a fraction of the sample molar masses is higher than the exclusion limit (the upper molar mass separation limit). It shows the refractive index (RI) detector
calibration curve (red). The two red dots mark the highest and lowest molar mass of the calibration standards.
An artifi cial shoulder appears in the chromatogram at approximately 6 mL elution volume when the exclusion limit has been reached. This is not related to sample characteristics, but is the result of the resolution change indicated by the change of the slope of the calibration curve.
second, correctly matched column with a higher exclusion limit than the fi rst column.
Selecting the Right Combination
It is not possible to combine linear or mixed bed columns and single porosity columns in all combinations — if the porosities and the calibration curve slopes do not match for each of the columns combined, chromatographic artifacts (such as shoulders) can arise giving
Figure 1: Many synthetic and natural macromolecules have a broad molar mass distribution and therefore a higher polydispersity index (PDI). This example shows the molar mass range covered for an poly(styrene) European reference material with a PDI around two and a medium-molecular-weight.
Material relationships
Molecular weight for proteins and polymers by SEC-MALS
FRESH
CHOICE
20 Angles
More MALS detector angles = More accuracy.
2 Clicks
From data to results - It’s so easy to get precise, repeatable results.
1 Call
For Worldwide service and support by the global light scattering experts.
MOREANGLES MORE DATA MORE CHOICE
The amazing new Viscotek SEC-MALS 20 detector is the new choice from Malvern for molecular weight and size of proteins and polymers. With 20 angles, the revolutionary
XGTVKECNƃQYEGNNYKVJTCFKCNQRVKEURTQFWEGUVJGDGUV/#.5
FCVCQDVCKPCDNGCP[YJGTG/CMGVJGHTGUJEJQKEGPQY
TO FIND OUT MORE AT www.malvern.com/morechoice
Figure 3 shows an analysis of three different Dextran samples on two analytical GPC/SEC columns with different porosities. One of the samples, Dextran 40 (red), seems to be bimodal as a shoulder is present. However, this shoulder is not part of the sample and cannot be seen on a single column. This shoulder is a result of a mismatch of the porosities.
Subsequent calculation of the raw data erroneously creates a shoulder in the molar mass distribution of this sample. Furthermore, small changes in the column manufacturing process can shift or eliminate the shoulder making it appear to be a real property of the sample. Long-term reproducible results based on such a
Porosity mismatch is not always readily visible in the calibration curve. Figure 4 shows a calibration curve where a very small porosity and a very large porosity column have been combined. The resulting calibration curve has two regions with very different slopes and an infl ection point can be identifi ed. This combination would defi nitely produce chromatographic artifacts.
On the other hand, the calibration curve can look as would be expected but there could still be a mismatch problem. Such a mismatch can only be detected by probing the region of the infl ection point using reference materials with a broad molar mass
Figure 2: An upper molar mass separation limit that is too low can lead to artifi cial shoulders in the chromatogram. Choosing the proper separation range helps to solve this problem.
Up to now, it is not possible to overcome these problems with advanced calibration data fi tting even if absolute detection, such as on-line laser light scattering, is used. Molar mass distributions can still show artifi cial shoulders if the porosities do not match. A better solution is to optimize the separation by adding correctly matched columns.
Summary
There are some general rules that are more or less true for all columns, independent of the
tEnsure that the upper molar mass separation limit is suffi cient taking the PDI of your samples in account. Verify that all parts of the sample elute in a region with suffi cient separation by overlaying the calibration curve with the sample.
t Avoid combining linear columns of different types; linear columns with single porosity columns (for example, linear +100 Å); and single porosity columns with non-matching porosities — or only do so following the manufacturer’s recommendation or by doing
Figure 3: Chromatograms of three Dextrans with broad molar mass distributions and different molar mass averages. The red trace seems to be bimodal, but this is a chromatographic artifact resultant of porosity mismatch of the two combined columns.
13th International Symposium on Hyphenated Techniques in Chromatography and Separation Technology (HTC-13)
The 13th International Symposium on
Hyphenated Techniques in Chromatography and Separation Technology (HTC-13) will be held at the Old Saint John Conference Center,Bruges, Belgium, from January 29-31 2014. The three-day event will feature recent findings from leading academic and industrial experts on chromatographic and mass spectrometric techniques covering fundamental aspects, instrumental developments and state-of-the-art applications. A number of key researchers in the field have been invited including: Alois Jungbauer, Peter Schoenmakers, Hian-Kee Lee, Tadeusz Gorecki, Michal Holcapek, Ralf Zimmermann, Fred Regnier, Bruno Le Bizec, Gabriel Vivo-Truyols, Philip Marriott, Luigi Mondello, Janusz Pawliszyn, Valérie Pichon, Bart Devreese, Gert Desmet, Robert Shellie, Davy Guillarme, Hans-Gerd Janssen, Yvan vander Heyden, Emily Hilder, Frank David, Hernan Cortes and Tuulia Hyötyläinen.
The HTC-13 programme features state-of-the-art overview lectures, tutorials, keynote and oral presentations encompassing fundamental chromatographic developments and application areas. An emphasis will be placed on oil and petrochemicals during sessions organized by the Royal Society of Chemistry (RSC). Other areas of interest cover computational chromatography and life sciences, new data-treatment methods, metabolomics, green hyphenated chromatography, natural products and hyphenated electro-driven systems.
Instrument and equipment vendors will display their latest systems in the large exhibition space which is integrated with catering and presentations of shortlisted posters.
Several awards will be presented including the Lifetime Achievement Award, sponsored by LCxGC Europe, honoring a scientist who has been distinguished by outstanding achievements in the field of hyphenated techniques in chromatography and for distinguished service to the international chromatographic community, and the HTC-award, sponsored by Elsevier Science for the most innovative paper or poster. The most innovative poster will also be awarded a specific poster award by the scientific advisory committee.
To encourage scientific exchange and friendship building, the scientific program will be topped off by a rich social programme consisting of a welcome party, reception at the historical Town Hall, beer degustation evening, symposium dinner and a farewell cocktail reception.
Short courses will be organized on January 28 on capillary electrophoresis, gas chromatography and high-performance liquid chromatography troubleshooting and advanced mass spectrometry. HTC is also organizing a job market. Scientists seeking a job that involves hyphenated systems (participants and non-participants of the meeting) will be given facilities to meet potential employers.
The 3rd International Symposium on Hyphenated Techniques for Sample Preparation (HTSP-3) will be
held alongside HTC-13 on January 28-29 2014. The HTSP meeting is a strong programme in its own right, with a number of experts from around the world as invited speakers. Participants of HTSP will be able to catch a glimpse of some of the HTC-13 lectures and posters - and vice versa.
Tel: +32 92649606 Fax: +32 92649606
E-mail: [email protected]
E-mail: [email protected]
Website: www.pss-polymer.com tInvestigate unexpected shoulders carefully.
Review the calibration curve with respect to changes in slope and use reference materials with a broad molar mass distribution to detect hidden porosity mismatch. Please note that porosity mismatch can even occur within one column, for example, if the manufacturer blends materials in a linear or mixed column to cover a wider molar mass range.
In conclusion, applying these three basic rules will help to establish GPC/SEC methods that can be used over a long time period with high
References
1. W.W. Yau, J.J. Kirkland, D.D. Bly, and H.J. Stoklosa,
Journal of Chromotography A125(1), 219–230 (1976).
2. D. Held, The Column 7(2), 14–16 (2011). 3. T. Hofe, The Column4(4), 20–23 (2008).
Daniela Held studied polymer chemistry in Mainz (Germany) and is working in the PSS software and instrument department. She is also responsible for education and customer training.
Figure 4: Calibration curve of two columns with non-matching porosities. The curve has two different slopes resulting in erroneously chromatograms with shoulders.
John Hinshaw, renowned expert in gas chromatography and the longtime author of the “GC Connections” column in LCGC, provides invaluable advice about how to handle some of the most common diffi culties faced by users of gas chromatography as well as with best practices to avoid problems in the fi rst place.
GLOBAL LAUNCH OF
NEW
e
BOOK SERIES
Five Keys to Successful GC Methods
FREE
Download
A FORMAT
FOR EVERYONE
This new e-book is available for the iPad or for a standard
computer web browser
Specifi c topics covered include:
➤Peak Problems: How to handle partially resolved or distorted peaks that yield poor quantitation ➤System Operation: The steps to follow for
restoring an idle GC column to operating condition
➤Air Leaks: What happens when air leaks into the carrier-gas line, and what to do about it
➤Preventive Maintenance: How to avoid crises through periodic maintenance of your GC system ➤Upgrading GC: Guidelines for upgrading your
GC laboratory to use high speed GC and generate your own gases