Identification, Review, and Systematic
Cross-Validation of microRNA Prognostic
Signatures in Metastatic Melanoma
Kaushala Jayawardana
1,7, Sarah-Jane Schramm
2,3,7, Varsha Tembe
2,3,7, Samuel Mueller
1,
John F. Thompson
3,4, Richard A. Scolyer
3,5,6, Graham J. Mann
2,3and Jean Yang
1In metastatic melanoma, it is vital to identify and validate biomarkers of prognosis. Previous studies have systematically evaluated protein biomarkers or mRNA-based expression signatures. No such analyses have been applied to microRNA (miRNA)-based prognostic signatures. As a first step, we identified two prognostic miRNA signatures from publicly available data sets (Gene Expression Omnibus/The Cancer Genome Atlas) of global miRNA expression profiling information. A 12-miRNA signature predicted longer survival after surgery for resection of American Joint Committee on Cancer stage III disease (>4 years, no sign of relapse) and outperformed American Joint Committee on Cancer standard-of-care prognostic markers in leave-one-out cross-validation analysis (error rates 34% and 38%, respectively). A similar 15-miRNA biomarker derived from The Cancer Genome Atlas miRNA-seq data performed slightly worse (39%) than these current biomarkers. Both signatures were then assessed for replication in two independent data sets and subjected to systematic cross-validation together with the three other miRNA-based prognostic signatures proposed in the literature to date. Five miRNAs (miR-142-5p, miR-150-5p, miR-342-3p, miR-155-5p, and miR-146b-5p) were reproducibly associated with patient outcome and have the greatest potential for application in the clinic. Our extensive validation approach highlighted among multiple independent cohorts the translational potential and limitations of miRNA signatures, and pointed to future directions in the analysis of this emerging class of markers.
Journal of Investigative Dermatology(2016)136,245-254;doi:10.1038/JID.2015.355
INTRODUCTION
The deadliest form of skin cancer, melanoma, is a major health problem in many countries and accounts for approx-imately 50,000 deaths annually worldwide (Slipicevic and Herlyn, 2012). In recent years, therapies that target acti-vating mitogen-activated protein kinase pathway mutations and immune checkpoints such as PD1 and CTLA4 have begun to extend the overall survival of a subset of eligible (suitably targetable) patients (Menzies and Long, 2013). However, a series of studies by Balch et al. (2001, 2009) continues to provide the primary basis of evidence for the current melanoma patient staging system, defined by the
American Joint Committee on Cancer (AJCC). According to this consensus, patients with melanoma likely to progress to nodal metastatic disease (AJCC stage III) are principally indicated by the number of metastatic nodes, the tumor burden at the time of staging, and the ulceration and thick-ness of the primary melanoma. In this setting, 5-year survival estimates range from 29% to 81.5% (Balch et al., 2009). Patients with a worse prognosis would potentially have a net benefit from even toxic effective adjuvant therapies, if they could be accurately identified. Balancing the competing risks of prognosis and surgical and/or systemic treatment needs to be informed by more accurate, biomarker-driven assessment of both patient clinical outcome and predicted treatment response. The ongoing analysis and validation of molecular biomarkers proposed in the literature so far is, therefore, an essential area of research.
To date, a number of studies have systematically reviewed and/or cross-validated protein biomarkers (as assessed by immunohistochemistry) and/or gene expression signatures derived from global mRNA profiling (Gould Rothberg and Rimm, 2010; Gould Rothberg et al., 2009; Mandala` and Massi, 2014; Schramm and Mann, 2011; Schramm et al., 2013). These studies have summarized a vast body of work and provided insights into the translational potential of these biomarkers. In recent years, a third class of molecule— expressed microRNA (miRNA)—has emerged as having prognostic potential. The earliest study of this class of markers in metastatic melanoma (Segura et al., 2010) identified, from
formalin-fixed paraffin-embedded tissue, 18 miRNAs
showing significant overexpression in patients with longer
1School of Mathematics and Statistics, The University of Sydney, Sydney,
NSW, Australia;2The Westmead Millennium Institute for Medical
Research, The University of Sydney, Sydney, NSW, Australia;3Melanoma
Institute Australia, Sydney, NSW, Australia;4Discipline of Surgery, Sydney
Medical School, The University of Sydney, Sydney, NSW, Australia;
5Discipline of Pathology, Sydney Medical School, The University of
Sydney, Sydney, NSW, Australia; and6Tissue Pathology and Diagnostic Oncology, Royal Prince Alfred Hospital, Sydney, NSW, Australia
7These authors contributed equally to this work.
Correspondence: Sarah-Jane Schramm, Sydney Medical School, The University of Sydney at Westmead Millennium Institute for Medical Research, 176 Hawkesbury Road, PO Box 412, Westmead, NSW 2145, Australia. E-mail:sarah-jane.schramm@sydney.edu.au
Abbreviations: AJCC, American Joint Committee on Cancer; LOOCV, leave-one-out cross-validation; miRNA, microRNA; TCGA, The Cancer Genome Atlas
Received 2 March 2015; revised 6 August 2015; accepted 17 August 2015; accepted manuscript published online 9 September 2015
ORIGINAL ARTICLE
survival (>18 months). A subsequent analysis showed that a six-miRNA subset (150, 342, 455-3p, miR-145, miR155, and miR497) could predict post-recurrence survival with accuracy at 80.2%. A study soon after (Caramuta et al., 2010) proposed another six miRNAs (miR-191, miR-193b, miR-365, miR-338, miR-193a, and let-7i) in association with shorter survival (1e12 months, fresh frozen regional lymph node metastases, 15 patients).
The recent release of miRNA expression profiling in meta-static melanomas from The Cancer Genome Atlas (TCGA; Akbani et al., 2015) as well as our own group (GSE59334; Tembe et al., 2014) provided an unprecedented opportunity to propose signatures and validate their performance together with the above-mentioned biomarkers. We have, therefore, con-ducted a multistaged analysis and systematic cross-validation of
all tissue-based miRNA prognostic signatures in metastatic melanomas proposed in the literature to date (Figure 1), yielding insights into the translational potential of this class of markers as well as future research directions in the field. RESULTS
Identification of microRNA prognostic signatures using publicly available data
We used global miRNA expression profiles from AJCC stage III lymph node disease (Tembe et al., 2014) to identify a signature (Table 1,Supplementary Figures S1 and S2online) indicative of good prognosis, previously defined (Mann et al., 2013) as the time from surgery to death from melanoma greater than 4 years with no sign of relapse. The 12-miRNA signature produced a mean error rate of 33% under
leave-Figure 1. Methods schematic.We proposed two prognostic signatures from publicly available data sets (GEO/TCGA) of miRNA expression profiling information in metastatic melanomas. Signatures were evaluated for accuracy in predicting patient survival (NSC classification) and compared with AJCC standard-of-care prognostic factors (Balch et al., 2009), assessed by logistic regression. Signatures were tested in two previously reported cohorts (Caramuta et al., 2010; Segura et al., 2010). This analysis was extended to encompass an extensive (three-part) and systematic cross-validation of all miRNA-based signatures of prognosis in metastatic melanoma proposed to date. For comparability among results, LOOCV error rates were used in all tests. AJCC, American Joint Committee on Cancer; GEO, Gene Expression Omnibus; LOOCV, leave-one-out cross-validation; NSC, nearest shrunken centroids; REMARK, REporting recommendations for tumor MARKer prognostic studies; SKM, Skin Cutaneous Melanomas; TCGA, The Cancer Genome Atlas.
one-out cross-validation (LOOCV) that was lower (38%) than our estimate obtained using the four most statistically sig-nificant clinicopathologic prognostic parameters in stage III melanomas as described above (Balch et al., 2009). The combined error rate of the 12-miRNA signature, modeled as a prevalidated vector (Tibshirani and Efron, 2002), and the clinicopathologic variables was 41%.
We repeated the analysis using AJCC stage III lymph node disease samples from TCGA Skin Cutaneous Melanoma consortium (Supplementary Figures S2 and S3, Table S3 on-line). Because the number of samples falling into the survival classes used in the analysis described above was small (Supplementary Table S3), we redefined “better” prognosis as the time from surgery to death due to melanoma greater than 3 years (no sign of relapse) and “worse” prognosis as patients surviving for less than 2 years after the same. The LOOCV error rate of this 15-miRNA signature (39%) was higher than the accuracy (37%) of the four standard-of-care clinicopath-ologic variables. The combined error rate was 42% (Table 2). Evaluation of direct overlap among independent prognostic signatures
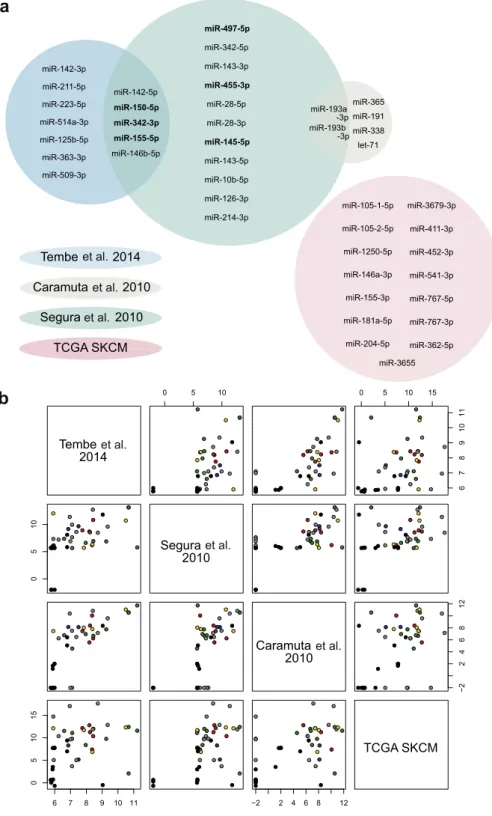
No miRNAs were common to all biomarkers. The following intersections were observed: miR-142-5p, miR-150-5p, miR-342-3p, miR-155-5p, and miR-146b-5p (Segura et al., 2010; Tembe et al., 2014), and 193a-3p and miR-193b-3p (Caramuta et al., 2010; Segura et al., 2010) (Figure 2,Supplementary Table S4online).
The examination of intersections among signatures using the raw expression values showed that at least some lack of overlap could be attributed to the absence of any measure-ment for a particular miRNA within a given data set. Alter-natively, the test-set miRNA was not detected or was filtered out during data preprocessing in the validation expression profiling studies (Figure 2, Supplementary Table S4, Figure S7, results and discussiononline).
Systematic cross-validation of microRNA-based prognostic signatures in metastatic melanoma
Part 1—Validation of each signature and its classes (Table 3A,
Supplementary Figure S8online). The six miRNAs proposed by Caramuta et al. (2010) produced the lowest error rate observed (13%) from among all the estimates in this study. However, this finding did not validate (48%) when we examined the larger, independent sample size of 40 from Tembe, and was not evaluable in the remaining validation data sets.
The 18-miRNA signature (Segura et al., 2010) achieved an estimated error rate of 22% in its own data. Error rates were higher in independent validation, ranging between 27% (Caramuta data) and 42% (TCGA data). The six-miRNA signature (Segura et al., 2010) performed similarly, produc-ing an error rate of 27% in its own data. Again, values were higher in independent data sets: 31% (Tembe data) and 33% (TCGA data). Only one miRNA was available for validation via the Caramuta data (40%).
Our 12-miRNA signature (Tembe et al., 2014) performed best (33%) among its own 45 samples but increased (38%) when examined using the 13 eligible samples from TCGA data. The signature did not validate (54%) via the data from
Caramuta although the sample size was, once again, small (13) and the number of miRNAs able to be evaluated was limited to 7 (of 12).
The 15-miRNA TCGA signature performed poorly (39%) in analysis using its own data (Table 3A, diagonal). Additionally, it could not be validated using the Tembe (52%) or Caramuta data (62%) although a critical caveat was that only five and three, respectively, of the miRNAs in the 15-miRNA signature were evaluable in those data sets.
Part 2—Validation of the test-set feature only (Table 3B,
Supplementary Figure S8). The validation of the 18-miRNA signature (Segura et al., 2010) produced error rate estimates of 27% (Caramuta data, 7 of 11 miRNAs assessed), 31% (Tembe data, 16 of 18 miRNAs assessed), and 43% (TCGA, all miRNAs evaluated). The six-miRNA signature (Segura et al., 2010) performed similarly. Notably, for both signa-tures, the error rate estimates in the Tembe data validation experiments were identical to the results produced in Part 1 because of patient samples being apportioned to better and worse survival classes in the same manner, despite the different follow-up definitions used.
The six-miRNA signature (Caramuta et al., 2010) produced mixed results in the Part 2 validation setting: 51% (Tembe data, five of six miRNAs assessed) and, using all miRNAs, 31% and 35% in the Segura and TCGA data sets, respectively.
The 12-miRNA signature (Tembe et al., 2014) performed well when examined via the Segura expression data (29%, 11 of 12 miRNAs examined). However, the feature did not validate in the other independent data sets: 53% (Caramuta, seven evaluable miRNAs) and 52% (TCGA, all miRNAs evaluated).
The 15-miRNA signature (TCGA) validated using data from Segura (39%, 10 of 15 miRNAs assessed). However, the error rate could not be observed elsewhere, possibly because of the small number of miRNAs able to be eval-uated in those tests: 53% in the Caramuta data set (three evaluable miRNAs) and 52% using the Tembe data (five miRNAs evaluated). Indeed, several miRNAs from TCGA signature were either removed from validation expression data during normalization or else were not assayed to begin with (Supplementary Figure S8 and Table S4).
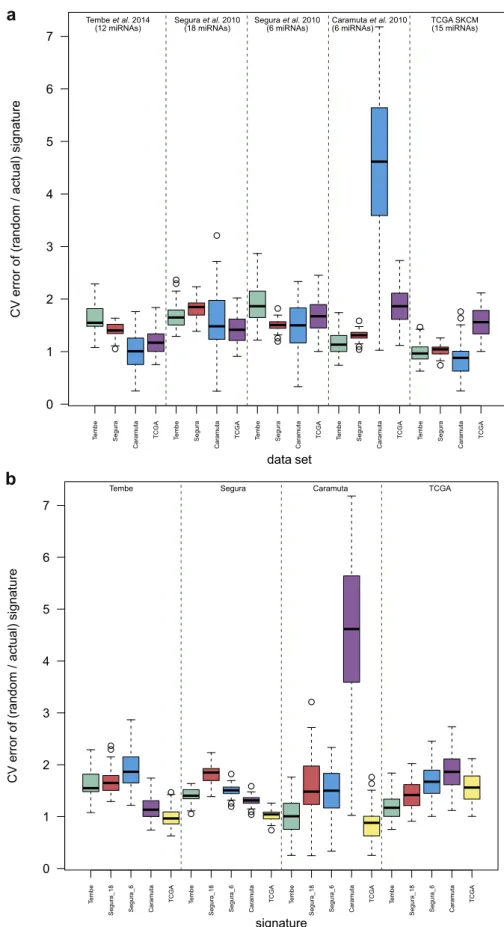
Part 3—Evaluation of prognostic miRNA signatures relative to equivalent random gene sets (Figure 3,Table 3B, bold). In most cases, the proposed signatures showed improved ac-curacy [range 8e45%] over random gene sets (Table 3B). In the three instances where signature accuracy did not show a relative increase, the signature had not itself validated (error rates approximately 50%) in those data to begin with. For signatures that were validated using the Tembe and Caramuta data sets, random gene sets produced the expected error rates of approximately 50%. The same observation could not be made for signature assessments using the Segura data where random gene sets predicted accuracy better than would be expected by chance (range 40e41%). The opposite obser-vation was made for TCGA validation (range 61e66%).
To enable more detailed consideration of improvements in the accuracy of the five signatures relative to random gene
K Jayawardanaet al.
microRNA Signatures and Metastatic Melanoma
Table 1. Summary of features of microRNA-based prognostic signatures reviewed and cross-validated in this study Expression
data source Biomarker miRNAs
Sample size
Sample
characteristics Platform Classes compared
Performance in a
multivariate setting Data link Caramuta
et al. (2010)1
Six mRNAs predictive of short survival after diagnosis of regional lymph node metastases
miR-338, let-7, miR-365, miR-191, miR-193b-3p, miR-193a-3p 16 FF Agilent-016436 Human miRNA Microarray 1.0 G4472A (470 miRNAs), miRBase release 9.1 <13 mo, cf.>60 mo survival from metastasis detection
Differentially expressed miRNAs were not significantly associated with age at diagnosis, gender, or Breslow tumor thickness of the
primary tumors GEO Accession Number: GSE19387 Segura et al. (2010)1 18 miRNAs predictive of longer post-recurrence survival in metastatic patients miR-214-3p, miR-126-3p, miR-143-5p, miR-28-5p, miR-342-5p, miR-10b-5p, miR-28-3p, miR-143-3p, miR-145-5p, miR-497-5p, miR-455-3p, miR-146b-5p, miR-155-5p, miR-342-3p, miR-150-5p, miR-142-5p, miR-193b-3p, miR-193a-3p
59 FFPE Rosetta Genomics custom microarrays
(911 miRNAs)
Longer survival (those who survived 18 mo or more from
the date of resection of the metastatic tumor), cf. shorter survival (patients who survived
less than 18 mo after same)
When the six-miRNA signature and AJCC stage were included in the model, other variables
such as age, sex, or time to first recurrence were not significant. Some miRNAs
from the signature were related to stage and site
of metastasis Data generously provided directly bySegura et al. (2010) Segura et al. (2010)1 Six-miRNA predictor of longer post-recurrence survival in metastatic patients miR-145-5p, miR-497-5p, miR-455-3p, miR-155-5p, miR-342-3p, miR-150-5p 59 Tembe et al.
(2014)2 good prognosis, relapse-12-miRNA predictor of free survival after resection
of metastatic lymph node disease miR-509-3p, miR-363-3p, miR-125b-5p, miR-514a-3p, miR-223-5p, miR-211-5p, miR-142-3p, miR-146b-5p, miR-155-5p, miR-342-3p, miR-150-5p, miR-142-5p
45 FF Agilent Human miRNA Microarray Release 16.0,
8x60K
Good prognosis, defined as time from surgery to death from melanoma>4 y with no sign of relapse, cf. poor prognosis (patients surviving<1 y after
same)
The 12-miRNA signature performed better (lower error rate) compared with the four dominant standard-of-care clinicopathologic variables3
GEO Accession Number: GSE59334
TCGA2 15-miRNA predictor of better prognosis, relapse-free survival after resection
of metastatic lymph node disease hsa-miR-105-5p4, hsa-miR-105-5p4, hsa-miR-1250-5p, 146a-3p, hsa-miR-155-3p, hsa-miR-181a-5p, 204-5p, hsa-miR-362-5p, hsa-miR-3655, miR-3679-3p, hsa-miR-411-3p, hsa-miR-452-3p, 541-3p, hsa-miR-767-5p,hsa-miR-767-3p 23 FF BSGSC IlluminaHiSeq_mRNASeq
Better prognosis, defined as time from surgery to death from melanoma>3 y with no sign of relapse, cf. worse prognosis (patients surviving<2 y after
same)
The 15-miRNA signature performed slightly worse (higher error rate) compared
with the four dominant standard-of-care clinicopathologic variables3
TCGA data portal, SKCM
Abbreviations: FF, fresh frozen; FFPE, formalin-fixed paraffin-embedded; GEO, Gene Expression Omnibus; GSE, Gene Expression Omnibus series; SKCM, Skin Cutaneous Melanoma; TCGA, The Cancer Genome Atlas; TNM, tumor-node-metastasis.
1Biomarker identified in a previous study. 2Signature identified in this study.
3The four variables are tumor-positive lymph nodes, tumor burden at the time of staging (microscopic vs. macroscopic), presence or absence of primary tumor ulceration, and thickness of the primary melanoma (Balch et al., 2009).
4Refers to hsa-miR-105-1_mature (MIMAT0000102) and hsa-miR-105-2_mature (MIMAT0000102): identical miRNA sequence, different genomic loci.
K Jayaw ardana et al. microRNA Signatures and Metastatic Melanoma Jo urnal of In vestig ati ve Dermatol ogy (2016), V olume 136
sets, we computed an “improvement over random signature” score (Figure 3, Supplementary Materials and Methods, Table S6 online). We found that all but one signature—the six-miRNA signature (Segura et al., 2010)—showed the largest gains in accuracy over random equivalent gene sets when assessed via their own expression data. In contrast, the six-miRNA signature (Segura et al., 2010) displayed greater gains in accuracy over random sets when evaluated using the data from Tembe. In terms of validation in independent data sets overall, the two signatures from Segura et al. (2010) showed the largest improvement over random gene sets, whereas the smallest gains were observed for TCGA-derived signature.
Signature evaluation using the concordance index (C-index) The signatures showing the highest concordance between the predicted and actual patient survival times (integrated C-in-dex score ¼0.83; weighted average of the C-index in each independent validation data set) were the 12-miRNA signa-ture (Tembe et al., 2014) and the 18-miRNA signature (Segura et al., 2010) (Supplementary results and discussion, Table S5 online).
DISCUSSION
In melanoma, as with other cancers, accurate prognostic information is essential for clinicians to be able to reliably stratify patients for a comparative assessment of therapeutic interventions. In this study, we identified two miRNA-based prognostic signatures and, for compliance with the REport-ing recommendations for tumor MARKer prognostic studies criteria (McShane et al., 2005), compared the performance of these signatures with the prognostic accuracy of standard-of-care clinicopathologic markers (Balch et al., 2009). We then undertook a systematic meta-analysis of all tissue-based prognostic biomarkers derived from the studies of miRNA expression profiling in metastatic melanoma reported in the literature so far.
Our identification of a prognostic signature in the data from Tembe et al. (2014) had a number of advantages compared with previous studies (Caramuta et al., 2010; Segura et al., 2010). To begin with, it involved the largest sample size involving fresh frozen tissue to be analyzed in
that setting to date (45 vs. 15). Our signature analysis was also restricted to the evaluation of AJCC stage III regional lymph node metastases, whereas the study fromSegura et al. (2010) included both stage III and stage IV samples from different tissue sites (brain, distant skin, local recurrence, regional lymph node, visceral, and regional skin). The more restrictive approach we used likely reduced the potential for confounding effects because of sample heterogeneity. Even so, the overlap of five miRNAs (miR-142-5p, miR-150-5p, miR-342-3p, miR-155-5p, and miR-146b-5p) among the signatures from these two studies (the two most statistically powered in the field so far) was encouraging from a repro-ducibility perspective. That these same miRNAs were observable in independent expression profiling experiments suggests that they should be immediately prioritized for further biomarker validation and functional analyses, including consideration as potential therapeutic targets. Moreover, the identification of these miRNAs in both fresh frozen and formalin-fixed paraffin-embedded tissue suggests that a protocol leveraging biobanks of the latter specimen type would be suitable for ongoing work.
The recently available data from TCGA Skin Cutaneous Melanoma study offered the opportunity to explore miRNA-based prognostic biomarkers via a different platform in miRNA-seq. However, it is interesting that this analysis did not produce a signature of high accuracy, nor was that signature validated in the independent data. Small sample size seems a probable explanation, supported by similar re-sults in a lack of validation for the signature obtained in the other small cohort (Caramuta et al., 2010). It is also possible that as yet obscure features of TCGA data set per se may have contributed to the result. For example, the survival data from TCGA were less mature than the data from Tembe et al. (2014), reflected in differences in the overall distribution of survival times between them.
In spite of these hurdles, our study revealed that the two signatures from Segura et al. (2010) and the 12-miRNA signature from the data set fromTembe et al. (2014) could indeed be validated in independent data. Notably, and consistent with prior observations, the latter signature was more accurate when compared with the top-ranking Table 2. Summary of error rates (estimated via LOOCV) for the miRNA prognostic signatures identified in this study using publicly available data
LOOCV error rate Method of assessment
Tembe et al. (2014)1
12-miRNA prognostic signature 33% NSC
Standard-of-care variables2 36% Logistic regression
Standard-of-care variables2and 12-miRNA signature combined 41% Prevalidated vector in a logistic regression framework TCGA SKCM
15-miRNA prognostic signature 39% NSC
Standard-of-care variables2 37% Logistic regression
Standard-of-care variables2and 15-miRNA signature combined 42% Prevalidated vector in a logistic regression framework
Abbreviations: GEO, Gene Expression Omnibus; LOOCV, leave-one-out cross-validation; NSC, nearest shrunken centroids; SKCM, Skin Cutaneous Melanoma; TCGA, The Cancer Genome Atlas.
1Data publicly available via GEO GSE Accession Number: GSE59334.
2Number of tumor-positive lymph nodes, tumor burden at the time of staging (microscopic vs. macroscopic), presence or absence of primary tumor
ulceration, and thickness of the primary melanoma (Balch et al., 2009).
K Jayawardanaet al.
microRNA Signatures and Metastatic Melanoma
standard-of-care biomarkers (Balch et al., 2009) that were previously shown to yield an error rate of 52% (mean fivefold CV error rates) (Jayawardana et al., 2014). The improvement in the classification error rate that we observed in some of the signatures evaluated herein, therefore, indicates the urgent need for further examination in larger cohorts—including
formalin-fixed paraffin-embedded tissue—as they become available. Prior reports (Jayawardana et al., 2014) have also clearly demonstrated in independent cohorts that despite similar estimated error rates observed between biomarkers derived from mRNA and miRNA platforms, different subsets of patients could be correctly classified by the different data
a
b
et al. et al. et al. et al. et al. et al.et al. et al. et al. et al.
et al. et al.
et al.
Figure 2. Overlap among the miRNA-based signatures.(a) Venn diagram for the overlap among the miRNA-based signatures evaluated in this study. Circle sizes represent the actual relative size of each signature. The six-miRNA signature fromSegura et al. (2010)is shown in bold. (b) Scatter plots of the union of all miRNAs present in at least one of the signatures among the four validation data sets. Expression values are the raw values of the miRNA expression data in each data set, transformed for ease of comparison (Supplementary Table S4). Colors represent miRNAs common between signatures and the value of
2 was used to represent miRNAs that were not present in the raw data, even before any filtering was done. SKCM, Skin Cutaneous Melanoma; TCGA, The Cancer Genome Atlas.
sources, which was another key for the motivation behind this meta-analysis.
The methodological framework used in our study is pro-spectively applicable to the upcoming signatures of interest and/or other emerging potential validation data sets. More-over, our comparison of signatures with equivalent random gene sets from the same expression data shows that not all evaluations produced the expected random set error rate of 50%. In the case of the Segura expression data, where random sets of miRNAs achieved the error rates of 40%, cohort heterogeneity (a mixture of samples of patients with stage III and IV disease as well as several tissue types) may have been responsible. Also of note, the large range of improvement scores observed using the biomarker from Caramuta et al. (2010), as assessed in its own data, shows that there are random gene sets with predictive power similar to the signature itself.
One obvious limitation of this work is the small sample size of the cohorts currently available for analysis, particu-larly when split on patient outcome. Thus, despite enormous efforts to address the issue of tissue shortage through con-sortia such as TCGA, our study has further demonstrated
(Schramm et al., 2012, 2013; Scolyer and Thompson, 2012) the ongoing issues in the dearth of independent cohorts available for testing and validation of prognostic biomarkers. In melanoma, generally, this situation continues to hamper the relevance of such markers to the clinic (Tremante et al., 2012). This challenge is precisely the reason that we have used a multifaceted meta-analysis approach. In it, we have trained the data on one data set and tested the effect on another independent cohort. This testing across different combinations of training and validation sets gives, in essence, the most unbiased picture in the literature to date of the utility of each biomarker proposed.
A recent review (Segura et al., 2012) compiles the evi-dence of the functional roles of miRNAs in melanomagenesis and progression, and of their clinical utility as biomarkers, prognostic tools, and potential therapeutic targets. These authors highlighted several “Clinical Next Directions and Future Perspectives,” notably the need for accurate and easily standardized progression risk biomarkers that determine disease burden or predict its outcome, as well as the impor-tance of leveraging data from burgeoning resources such as TCGA. As we (Schramm and Mann, 2011; Schramm et al., Table 3. Summary of results, reported as LOOCV error rates, for independent validation of miRNA prognostic signatures in metastatic melanoma
(A) Validation of the test set feature1(microRNA set) and classes (survival endpoints).4
BiomarkerY
Data/
Tembe et al. (2014)2 Segura et al. (2010) Caramuta et al. (2010) TCGA
Tembe et al. (2014)2(12 miRNAs) 33% [12] Not evaluable3 54% [7] 38% [12]
(23:22) (1:1) (6:7) (5:8)
Segura et al. (2010)(18 miRNAs) 31% [16] 22% [18] 27% [7] 42% [18]
(23:22) (36:23) (8:7) (25:11)
Segura et al. (2010)(6 miRNAs) 31% [6] 27% [6] 40% [1] 33% [6]
(23:22) (36:23) (8:7) (25:11)
Caramuta et al. (2010)(6 miRNAs) 48% [5] Not evaluable3 13% [6] Not evaluable3
(18:22) (1:2) (8:7) (2:8)
TCGA (15 miRNAs) 53% [5] Not evaluable3 62% [3] 39% [15]
(23:22) (1:7) (6:7) (11:12)
(B) Validation of the test set feature1(microRNA set) only, i.e. using survival classes of the validation data set).4
BiomarkerY
Data/
Tembe et al. 20142(45) Segura et al. 2010(59) Caramuta et al. 2010(15) TCGA (23)
Tembe et al. 20142(12 miRNAs) 33% [12] 29% [11] 53% [7] 52% [12]
53% 41% 51% 62%
Segura et al. 2010(18 miRNAs) 31% [16] 22% [18] 27% [7] 43% [18]
51% 40% 44% 61%
Segura et al. 2010(6 miRNAs) 31% [6] 27% [6] 40% [1] 39% [6]
59% 40% 58% 66%
Caramuta et al. 2010(6 miRNAs) 51% [5] 31% [6] 13% [6] 35% [6]
59% 40% 58% 66%
TCGA (15 miRNAs) 53% [5] 39% [10] 53% [3] 39% [15]
52% 40% 47% 61%
Abbreviations: LOOCV, leave-one-out cross-validation; GEO: Gene Expression Omnibus; GSE, Gene Expression Omnibus Series.
1Number of miRNAs able to be assessed in each validation data set is indicated in square brackets. Number of samples assessed in each class (longer
survival-to-shorter survival) is given in parentheses.
2Data publicly available via GEO GSE Accession Number: GSE59334. 3Insufficient sample size for analysis.
4Feature performance is also measured by its improvement over the accuracy of equivalent random signatures (shown in bold). See alsoFigure S8.
K Jayawardanaet al.
microRNA Signatures and Metastatic Melanoma
2012, 2013), and others (Gould Rothberg et al., 2009; McShane et al., 2005), have previously stated, for ideal clinical relevance, molecular signatures should be readily and reproducibly identifiable, show clear and independent
relationships with specific survival outcomes, and do so with added or greater sensitivity than the current set of biomarkers. The significance of this work is in its comprehensive assess-ment of the potential of miRNA signatures, from the
a
b
Figure 3. Comparison of miRNA-based prognostic signatures with equivalent random gene sets. Assessment of the performance of miRNA-based prognostic signatures relative to equivalent random gene sets: we considered the improvement in the prediction error of the signatures relative to the prediction errors of equivalently sized random miRNA sets. The improvement score was calculated as the CV error of the random signature/CV error of the signature of interest, for each set of the 100 random gene sets generated, producing 100 such improvement scores in each of the four validation data sets (section “Materials and Methods”;Supplementary Materials and Methods). These scores are represented in boxplots to reflect the actual values as well as their variability. (a) Improvement scores ordered by signature. (b) Improvement scores ordered by validation data set. CV, cross-validation; SKCM, Skin Cutaneous Melanoma; TCGA, The Cancer Genome Atlas.
information available to date to guide clinical decisions. Via several approaches, we have shown that there is a potential translational value in the biomarkers identified in the study by Segura et al. (2010)as well as the signature identified herein using the data fromTembe et al. (2014).
MATERIALS AND METHODS
Melanoma specimens, and clinical and pathologic data
Melanoma specimens, clinicopathologic data, and miRNA data sets (Table 1) are described in theSupplementary Materials and Methods, along with the steps for preprocessing and the normalization of all miRNA expression data (Supplementary Figures S1, S2, and S4eS6; Tables S1eS3online).
Identification of survival-associated signatures via publicly available data sets and comparison with AJCC standard-of-care prognostic factors
We defined the standard-of-care variables as the four most statistically significant clinicopathologic prognostic parameters in stage III melanomas (Balch et al., 2009): the number of tumor-positive lymph nodes, tumor burden at the time of staging (microscopic vs. macroscopic), presence or absence of primary tumor ulceration, and thickness of the primary melanoma. The signature identifica-tion protocol is detailed in the Supplementary informaidentifica-tion (Supplementary Figure S3). In sum, feature selection was defined by the median expression difference (median robust) of survival groups: good versus poor (Tembe data, Supplementary Figure S1, Tables S4eS6,Supplementary Appendix 1online) and better versus
worse (TCGA data, Supplementary Figure S2, Supplementary
Appendix 2 online). Classification was performed using nearest shrunken centroids, default parameters (Tibshirani et al., 2002). A logistic regression model was used to classify the standard-of-care variables. We examined the performance of the signatures (assessed as prevalidated vectors; Tibshirani and Efron, 2002) together with standard-of-care variables under LOOCV using logistic regression.
Evaluation of overlap among signatures
We examined the direct overlap of miRNAs and also considered the raw expression values in each of the four data sets for the miRNAs present in at least one of the four signatures.
Cross-validation of signature accuracy among independent data sets
The accuracy of each signature in predicting patient clinical outcome was measured in each of the other expression data sets using LOOCV error rates. It proceeded in three parts described below. As reported in the section above, not all miRNAs of a given signature were present in processed and normalized independent expression data because of them being either not detected, not measured, or below filtering limits (Supplementary Table S4). In these instances, the assessment proceeded using the smaller number of miRNAs actually available for analysis (Table 3, square brackets). To improve readability, we refer to expression data sets by the first author of study in which they were originally published, that is, “Tembe” for the expression data from Tembe et al. (2014), and so forth. Signatures are referred to by the number of miRNAs they contained (Table 1) and the study from which they were extracted if not this work. Nearest shrunken centroids and LOOCV were used to assess all cases (Supplementary Materials and Methods).
In Part 1 of our validation approach, each of the five signatures was examined together with its associated classes (survival end-points), in each of the remaining available cohorts (Table 3a).
In Part 2 of validation, we considered each signature without re-gard to its associated classes (Table 3B). This is because the exami-nation of signatures and their associated classes, as we performed above, often leads to ineffectual sample size because of differences among cohorts in survival distribution, tissue type, and/or other factors. In Part 2, we instead used the survival endpoints associated with the validation expression data set. In this way, the sample size available for analysis was increased relative to the tests described above (Table 3, parentheses), whereas the prognostic utility of the signature per se was examined in relatable, although not identical, survival classes.
In Part 3, we assessed the prognostic value of signatures relative to random gene sets. The tendency to interpret signatures that are significantly associated with survival as having biological and/or clinical relevance has been challenged in recent years by findings in breast cancer data sets that “random” gene sets also tend to cluster patients into prognostically different subgroups (Beck et al., 2013; Venet et al., 2011). To deal with this issue, we therefore compared the predictive power of each signature with that of 100 random gene sets of the same size, and produced 100 corresponding LOOCV error rates. The improvement over the random signature was defined as “Improvement over random signature¼CV error of the random signature/CV error of the signature of interest.” For each set of the 100 random signatures, we calculated 100 such improvement scores (Supplementary Materials and Methods).
Signature assessment using Uno’s concordance index (C-index)
All signatures were assessed using Uno’s C-index (Uno et al., 2011), an approach routinely used in the medical literature to quantify the capacity of a given biomarker to discriminate among subjects with different event times (Uno, 2013) (Supplementary Materials and Methods).
CONFLICT OF INTEREST
The authors state no conflict of interest. ACKNOWLEDGMENTS
The authors are grateful for the following financial support: Australian Post-graduate Award (KJ), International PostPost-graduate Research Scholarship (KJ), The University of Sydney (YHY), Australian Research Council Future Fellowship (YHY), Cancer Institute New South Wales Clinical Research Fellowship (RAS), National Health and Medical Research Council of Australia Practitioner Fellowship (RAS), Program Grants of National Health and Med-ical Research Council of Australia (633004, JFT/GJM/RAS), The Australian Research Council (DP130100488, YHY/SM/GJM), Translational Program Grant of the Cancer Institute New South Wales (10TPG/1/02: GJM/ RAS/JFT). The authors are grateful to our colleagues for their support and intellectual engagement.
SUPPLEMENTARY MATERIAL
Supplementary material is linked to the online version of the paper atwww. jidonline.org, and athttp://dx.doi.org/10.1038/JID.2015.355.
REFERENCES
Akbani R, Akdemir KC, Arman Aksoy B, et al. Genomic classification of cutaneous melanoma. Cell 2015;161:1681e96.
Balch C, Gershenwald J, Soong SJ, et al. Final version of 2009 AJCC mela-noma staging and classification. J Clin Oncol 2009;27:6199e206. Balch CM, Buzaid AC, Soong SJ, et al. Final version of the American Joint
Committee on Cancer staging system for cutaneous melanoma. J Clin Oncol 2001;19:3635e48.
Beck AH, Knoblauch NW, Hefti MM, et al. Significance analysis of prognostic signatures. PLoS Comput Biol 2013;9:e1002875.
Caramuta S, Egyhazi S, Rodolfo M, Witten D, Hansson J, Larsson C, Lui W. MicroRNA expression profiles associated with mutational status
K Jayawardanaet al.
microRNA Signatures and Metastatic Melanoma
and survival in malignant melanoma. J Invest Dermatol 2010;130: 2062e70.
Gould Rothberg BE, Bracken MB, Rimm DL. Tissue biomarkers for prognosis in cutaneous melanoma: a systematic review and meta-analysis. J Natl Cancer Inst 2009;101:452e74.
Gould Rothberg BE, Rimm D. Biomarkers: the useful and the not so useful— an assessment of molecular prognostic markers for cutaneous melanoma. J Invest Dermatol 2010;130:1971e87.
Jayawardana K, Schramm S-J, Haydu L, et al. Determination of prognosis in metastatic melanoma through integration of clinico-pathologic, mutation, mRNA, microRNA, and protein information. Int J Cancer 2014;136: 863e74.
Mandala` M, Massi D. Tissue prognostic biomarkers in primary cutaneous melanoma. Virchows Arch 2014;464:265e81.
Mann GJ, Pupo GM, Campain AE, et al. BRAF mutation, NRAS mutation, and the absence of an immune-related expressed gene profile predict poor outcome in patients with stage III melanoma. J Invest Dermatol 2013;133: 509e17.
McShane LM, Altman DG, Sauerbrei W, Taube SE, Gion M, Clark GM. REporting recommendations for tumor MARKer prognostic studies (REMARK). Nat Clin Pract Oncol 2005;2:416e22.
Menzies AM, Long GV. Recent advances in melanoma systemic therapy. BRAF inhibitors, CTLA4 antibodies and beyond. Eur J Cancer 2013;49: 3229e41.
Schramm S-J, Campain AE, Scolyer RA, Yang YH, Mann GJ. Review and cross-validation of gene expression signatures and melanoma prognosis. J Invest Dermatol 2012;132:274e83.
Schramm S-J, Mann GJ. Melanoma prognosis: a REMARK-based systematic review and bioinformatic analysis of immunohistochemical and gene microarray studies. Mol Cancer Ther 2011;10:1520e8.
Schramm S-J, Menzies AM, Mann GJ. Molecular biomarkers of prognosis in melanoma: how far are we from the clinic? Melanoma Res 2013;23:423e5. Scolyer RA, Thompson JF. Biospecimen banking: The pathway to personalized
medicine for patients with cancer. J Surg Oncol 2012;107:681e2. Segura MF, Belitskaya-Levy I, Rose AE, et al. Melanoma microrna signature
predicts post-recurrence survival. Clin Cancer Res 2010;16:1577e86. Segura MF, Greenwald HS, Hanniford D, Osman I, Hernando E. MicroRNA
and cutaneous melanoma: from discovery to prognosis and therapy. Carcinogenesis 2012;33:1823e32.
Slipicevic A, Herlyn M. Narrowing the knowledge gaps for melanoma. Upsala J Med Sci 2012;117:237e43.
Tembe V, Schramm S-J, Stark MS, et al. microRNA and mRNA expression profiling in metastatic melanoma reveal associations with BRAF mutation and patient prognosis. Pigment Cell Melanoma Res 2014;28:254e66. Tibshirani R, Hastie T, Narasimhan B, Chu G. Diagnosis of multiple cancer
types by shrunken centroids of gene expression. Proc Natl Acad Sci 2002;99:6567e72.
Tibshirani RJ, Efron B. Pre-validation and inference in microarrays. Stat Appl Genet Mol Biol 2002;1e18.
Tremante E, Ginebri A, Lo Monaco E, et al. Melanoma molecular classes and prognosis in the postgenomic era. Lancet Oncol 2012;13:e205e11. Uno H. survC1: C-statistics for risk prediction models with censored survival data.
R package version 1.0-2,http://CRAN.R-project.org/package=survC1; 2013. Uno H, Cai T, Pencina MJ, D’Agostino RB, Wei LJ. On the C-statistics for
evaluating overall adequacy of risk prediction procedures with censored survival data. Stat Med 2011;30:1105e17.
Venet D, Dumont JE, Detours V. Most random gene expression signatures are significantly associated with breast cancer outcome. PLoS Comput Biol 2011;7:e1002240.