Portland State University Portland State University
PDXScholar
PDXScholar
Dissertations and Theses Dissertations and Theses
3-17-2020
Tending the Fire: Wildfire Risk Management at the
Tending the Fire: Wildfire Risk Management at the
Interface
Interface
Cody Randolph Evers Portland State University
Follow this and additional works at: https://pdxscholar.library.pdx.edu/open_access_etds Part of the Environmental Sciences Commons
Let us know how access to this document benefits you.
Recommended Citation Recommended Citation
Evers, Cody Randolph, "Tending the Fire: Wildfire Risk Management at the Interface" (2020). Dissertations and Theses. Paper 5416.
Tending the Fire:
Wildfire Risk Management at the Interface
by
Cody Randolph Evers
A dissertation submitted in partial fulfillment of the requirements for the degree of
Doctor of Philosophy in
Earth, Environment and Society
Dissertation Committee: Max Nielsen-Pincus, Chair
Alan Ager Andres Holz Vivek Shandas
Antonie Jetter
Portland State University 2020
Abstract
Escalating loss from wildfire in the American West has made clear the need to rethink wildfire risk, including how such risks result from the unique interaction of social and natural dynamics within the wildland urban interface. Unfortunately, techniques for studying these interactions remain limited. The intent of this research is to address this gap. In each of four chapters, I examine different aspects of wildfire risk management through a coupled human-natural lens. I document how wildfire activity has shifted over three decades across forest and shrubland systems in the western US and connect these changes to the simultaneous growth in development within fire-prone wildlands. Using wildfire models, I then examine the transmission of wildfire risk from public land into nearby communities to quantify both the magnitude and geographic extent of wildfire exposure across the American West. These results show how community exposure has become geographically concentrated within several dozen regional hotspots, each featuring a distinct mix of exposure conditions. The dissertation then shifts its focuses to wildfire management within one specific hotspot, North Central Washington. Here I map where wildfire risk management crosses ownership boundaries to address risk and how the resulting organizational diversity appears to shape the roles that different
organizations play. Finally, I look at the network structure of relationships among those managing wildfire risk and show that geographic proximity and shared risk lead to collaboration. Together, this work represents a cohesive body of research that expands coupled social and biophysical knowledge of wildfire risk management.
Dedication
To my parents for their unconditional support To my wife for her courage and perseverance
Acknowledgments
The research presented in this dissertation would not have been possible without the guidance and support of many. A special thanks goes to Max Nielsen-Pincus, the chair of my dissertation committee, for his reliably, timely, and sage advice. The work of Alan Ager provided the foundation for much of this research. I deeply appreciate his drive and curiosity. Thanks goes to Andres Holz for inspiring the work in Chapter 1 and for the intellectual engagement and honesty that he applies to all of his work. I thank Vivek Shandas for our early conversations on community resiliency and ecosystem services. His enthusiasm and creativity always inspired. The Rocky Mountain Research Station of the USDA Forest Service provided financial support for much of this research. I also wish to acknowledge the training and support provided by the National Science Foundation Integrated Graduate Research and Education Traineeship (IGERT) program. A dissertation is a long journey influenced by many colleagues and friends. Thanks goes to numerous classmates and colleagues at Portland State University, Oregon State University and University of Oregon.
Table of Contents
Abstract ... i
Dedication ... ii
Acknowledgments ... iii
List of Tables ... viii
List of Figures ... xi
Introduction: Wildfire Risk Management at the Interface ...1
Risk at the interface ... 2
Chapter overview ... 4
Chapter 1: Shifting Fire Regimes in the American West ...9
1. Shifting Fire Regimes in the American West ... 11
2. Methods ... 15
2.1. Classifying vegetation and fire regimes ... 16
2.2. Classifying social dimensions of fire activity ... 17
2.3. Analytics ... 18
3. Results ... 19
3.1. Shifts in fire activity among vegetation systems ... 19
3.2. Shifts in wildfire regimes within vegetation systems ... 22
3.3. Social dimensions of shifting fire regimes. ... 24
4. Discussion ... 27
5. Conclusion ... 32
6. Figures ... 34
Chapter 2: Archetypes of Community Wildfire Exposure ...44
1. Archetypes of Community Wildfire Exposure ... 46
2. Methods ... 50
2.1. Study Area ... 50
2.2. Simulation exposure to communities ... 51
2.3. Characterizing wildfire exposure ... 53
2.4. Gradient and cluster analysis of wildfire exposure ... 55
3. Results ... 56
3.1. Community exposure to wildfire originating from national forests ... 56
3.1. Variation in conditions among highly exposed communities ... 58
3.2. Archetypes of community wildfire exposure ... 59
4. Discussion ... 62
4.1. National forest sources areas ... 63
4.2. Community exposure areas ... 65
4.3. Connecting multiple scales of exposure ... 66
4.4. Limitations and Future Research ... 67
5. Conclusion ... 69
6. Figures ... 70
7. Tables ... 75 Chapter 3: Organizational Geography of Wildfire Risk Management ...81
1. Organizational Geography of Wildfire Risk Management ... 82
1.1 Wildfire risk and land tenure ... 84
1.2 Organizational geography ... 86
2. Methods ... 88
2.1. Study area ... 88
2.2. Data collection ... 89
2.3. Data analysis ... 91
2.4. Estimating organizational geography ... 92
3. Results ... 95
3.1. Organizational groups and roles ... 95
3.2. Locations of work ... 96
3.3. Organizational geographies ... 99
3.5. Organizational diversity and role specificity ... 100
4. Discussion ... 101
4.1 Organizations involved in addressing wildfire risk ... 101
4.2. Organizational geographies of wildfire risk management ... 102
4.3. Organizational diversity and role specificity ... 104
4.5. Participatory GIS and its limitations. ... 107
5. Conclusion ... 108
6. Figures ... 110
Chapter 4: Collaboration in the Wildfire Risk Management System ...114 1. Collaboration in the Wildfire Risk Management System ... 115
2. Methods ... 120
2.1. Study area ... 120
2.2. Wildfire risk management system (WRMS) survey ... 121
2.3. Relational analysis using exponential random graph models (ERGM) ... 122
3. Results ... 126
3.1. Wildfire risk management community ... 126
3.2. Locations of work ... 126
3.3. Predictors of work relationships ... 127
3.4. Spatial influence on work relationships ... 130
4. Discussion ... 131
5. Conclusion ... 134
6. Figures ... 136
Conclusion: Wildfire Risk Management at the Interface ...140 Summary and contribution of research ... 139
Future research directions ... 143
Concluding remarks ... 144 References ...147
List of Tables
Chapter 1
Table 1. LANDFIRE fire regime groups for the western US (Rollins et al., 2009). ...17 Table 2. Cross-tabulation between vegetation potential and fire regime group. Marginal
totals are shown in bold (data source: LANDFIRE). ...18 Table 3. Change in annual area burned (AAB) among fire regimes groups for forest and
shrubland systems. Changes are reported as an absolute value, percent, and as a proportional share of the overall change. ...20 Table 4. Change in the wildland urban interface between 1990 and 2010 by vegetation
potential and fire regime group. Changes are reported both as area and structure count in terms of absolute change, growth, and the proportional share of growth. IM = intermixed WUI; IF = interface WUI. Shr = share of WUI structure and area as of 2010. ...26
Chapter 2
Table 1. Variables used to distinguish the nature of wildfire exposure among threated communities. Variables reflect conditions found within the national forest source area (NF), exposed areas of the community (C), or both (NF/C). ...75 Table 2. Descriptive statistics of wildfire exposure among highly exposed communities
(n=516). The reference values represent the average conditions among western national forests and western communities (WUI and non-WUI). ...77
Table 3. Loadings of exposure variables on the 8 components (F1-F8) used to distinguish community archetypes. Components are ordered by the variance explained. Loadings greater than 0.5 are shown in bold while loadings less than 0.1 are omitted. ...78 Table 4. Descriptive statistics show differences in the character of exposure among 5
community archetypes, represented as mean values and standard deviations. ...79
Chapter 3
Table 1. Roles related to addressing wildfire risk. Roles capture roles related to wildfire risk before, during, and after wildfires. ...93 Table 2. Geographic context variables used to predict the distribution of work of
organizational groups, along with a brief description and source for each. All reference data were processed at a 270-m spatial resolution. ...94 Table 3. Number of responses by organizational group along with the number of work
locations reported in the five-year period prior to 2018. ...96 Table 4. Role participation by organization type (i.e., % of respondents that reported
role). Cells marked with +/- had higher/lower role participation than the average (based on 95% confidence interval). ...97 Table 5. Organizational geographies (%) based on underlying land ownership. Cells
marked with +/– were more/less common than expected based on chi-squared tests. ...98
Table 6. Portion of work locations reported inside the WUI or within 1-mile, 2.5-miles, or 5-miles of the WUI, grouped by primary organizational groups. ...99 Table 7. Importance of environmental covariates in determining the working geography
of each organizational group. ...100
Chapter 4
Table 1. Estimated coefficients from the complete ERGM model. Positive estimates reflect factors promote working relationships among actors while negative
List of Figures
Chapter 1
Figure 1. (A) Large wildfires occurring in the western US between 1984 and 2015 prior- and post-2000. (B) Environmental site potential alongside WUI and non-WUI developed areas. ...34 Figure 2. (A) Map of forest systems colored by fire regime (103.5 M ha, 23% of area
shown). (B) Map of shrubland systems colored by fire regime (124.6 M ha, 28% of area shown). Other cover types (primarily grasslands and barren) are shown in light grey (data source: LANDFIRE). ...35 Figure 3. (A) Annual area burned (AAB) colored by vegetation system (forest, shrubland,
grass, other). (B). Annual values prior- and post-2000 with significance (p-values less than 0.05 highlighted in red). (C/D) Same as above but reported as an annual proportional share (%/yr). ...36 Figure 4. (A) Annual burn ratio between forest- and shrub-systems by year (bars colored
by vegetation potential; green = forest; brown = shrub). (B) Annual burn-ratio compared to overall annual area burned. Differences between periods in the distributions of AAB and burn-ratio are shown above and to the right. In both panels, the 1:1 ratio is shown as a horizontal solid line. Significance labeled for trends in each panel. ...37 Figure 5. Percent of wildfire burn area (n=9228) within forest system (compared to other
dominant vegetation potential. Green = forest; Orange = shrubland; Purple = grassland. ...38 Figure 6. Variation in annual area burned by dominant fire regime within forest (A) and
shrubland (B) systems, divided prior- and post-2000 (Wilcox p-values less than 0.05 are in bold). (C/D) Same as above but transformed to annual proportional share (%). Fire regimes: FRG1 = frequent and low-severity, FRG2 = frequent and severe; FRG3 = intermittent and mixed-severity; FRG4 = intermittent and severe; FRG5 = infrequent with variable severity. ...39 Figure 7. Pairwise comparison of annual burn ratios among forest wildfire regimes and
annual area burned. Panels are equivalent to that shown in Figure 4A.
Significance of the trend (dashed line) is labeled (trend) along with correlation with the total annual area burned (AAB; equivalent to Figure 4B). Significant values are highlighted. Fire regimes: FRG1 = frequent and low-severity, FRG2 = frequent and severe; FRG3 = intermittent and mixed-severity; FRG4 =
intermittent and severe; FRG5 = infrequent with variable severity. ...40 Figure 8. Pairwise comparison of the trends in burn-ratios among shrubland wildfire
regimes. Significance of the trend (dashed line) is labeled (trend) along with correlation with the total annual area burned (AAB; equivalent to Figure 4B). Significant values are highlighted. Fire regimes: FRG1 = frequent and low-severity, FRG2 = frequent and severe; FRG3 = intermittent and mixed-severity; FRG4 = intermittent and severe; FRG5 = infrequent with variable severity. ...41
Figure 9. Proportion and trends (dashed line) of annual area burned partitioned by land ownership and protection status (all vegetation types; panels ordered by overall proportional share of fire; note differences in y-axes). Trends lines over period are shown as dashed lines. Y-axes are freely scaled so note labeled values. FSM/P = National forest managed/protected; PRM/P = Private managed/protected; BLM/P = Bureau of Land Management managed/protected; STM/P = State
managed/protected. ...42 Figure 10. Change in fire activity (median AAB) and WUI (ha and structure count).
Arrows labeled by vegetation potential, fire regime group, and WUI type: F = forest; S = shrub; 1-5 = fire regime group; M = mixed WUI; F = interface WUI. The top row represents WUI change as area. The bottom row represents WUI change as structure count. ...43
Chapter 2
Figure 1. Community wildfire exposure was determined using the area where wildfire and development intersect (red-hashed area). The archetype of community exposure was based on conditions within both the source area where wildfire ignited (yellow-hashed area) and the exposed area of the community (red hashed). Conditions for both areas were averaged for the entire community based on thousands of possible wildfires. ...70 Figure 2. Community wildfire exposure was grouped into 5 exposure archetypes based on
analysis (left). The number of clusters (k=5) was chosen based on the change in the area under the curve (right) for successive cumulative density functions (middle). ...71 Figure 3. Map of the western US shows the 516 communities that account for 80% of the
wildfire exposure originating in the national forest. Areas of the national forest that contribute the most exposure are shown in orange and the most exposed areas within communities are shown in magenta. ...72 Figure 4. Exposure patterns for highly exposed communities divided into five archetypes,
as shown in the dendrogram and consensus plot above and in the map below. Differences in the height of branches in the dendrogram reflect differences within and among clusters. Branches of the dendrogram dominated by a single color in the consensus plot represent greater homogeneity among communities within archetypes (e.g., C2 open-interface), while branches containing a mixture of colors represent groupings that are less distinct. ...73 Figure 5. Community archetypes reflect different priorities for managing wildfire risk.
Vegetation management, for instance, is effective in only half of highly exposed communities (i.e., C3 mixed-interface and C4 forested-intermix communities). Differences in prioritization also indicate different needs for cross-boundary coordination and which actors are involved. ...74
Chapter 3
Figure 1. The study area is located in North Central Washington on the east side of the Cascade Mountains (50 miles east of Seattle). More than 380,000 people reside in the region. Major communities are labeled. For reference, the study area is broken into six drainages: 1) Methow, 2) Okanogan, 3) Chelan, 4) Wenatchee, 5) East of the Columbia, and 6) Yakima. ...110 Figure 2. Organizational geographies for six major organization groups involved in
wildfire risk management. Highlighted locations represent those areas predicted by the work distribution models that had similar environmental attributes to actual work locations. ...111 Figure 3. Relationship between organizational diversity (derived from the overlap of all
organizational geographies) and role diversity (derived from the total number of reported roles) grouped by organizational group. ...112
Chapter 4
Figure 1. Transformation in the wildfire risk management system as risk becomes more complex. Three transformations are illustrated: risk interdependency; spatial externalities, and; coordinated management. ...136 Figure 2. (A) Principal land cover North Central Washington study area shows a mixture
of forest and shrubland systems. (B) Fire frequencies vary between 30 and 500 years with the most flammable areas occurring at the transition zone from
dryland-forest to open desert-steppe. (C) Land ownership represents a mixture of private and public lands with developed areas occupying valley bottomlands. .137
Figure 3. Relationship between the social network and reported work location. Actor-to-actor collaborative work-ties (A) are superimposed over ties that connect the Actor-to-actor to the location of work (B). Social distance in A is implied by the relative distance between actor nodes. ...138
Introduction:
Wildfire Risk Management at the Interface
Risks from wildfire have continued to escalate despite substantial efforts to protect people and property. The dynamics underlying this trend center on the area where human and natural communities meet – the wildland urban interface. Nationwide, the wildland urban interface (WUI) contains more than 40 million structures, of which a substantial portion are found in areas prone to frequent wildfire. A recent insurance report estimated as many as 800,000 homes are built in areas of extreme fire risk, which
collectively represent more than $220 billion dollars at risk. The magnitude of this estimate has been brought into sharp relief in recent years as home losses from fires in California in 2017 and 2018 totaled more than $33 billion dollars, led to hundreds of deaths, and forced one of the nation's largest utilities to file bankruptcy over the resulting liability.
Given increased hazard and surging suppression costs, government agencies are under intense pressure to improve risk governance. To do this, agencies have increasingly turned to risk-based decision making, which proponents argue allows for improved efficiency, proactive management of risk, and improved capacity for achieving management objectives. Yet, traditional definitions of risk focus on events that are
relatively well understood, have a known frequency of occurrence, and have a clear direct relationship between the event and its impact. Wildfire risks violate many of these
wildfire. No one agency or stakeholder owns complete responsibility for the event and wildfire risk management increasingly requires multiple actors to coordinate their actions. Risks are not evenly distributed in the landscape, nor do they mean the same thing for all the different parties, which can make it unclear who should do what and why they should do it. This ambiguity compounds uncertainty since different people react to the same risk in different ways and depending on how that risk is framed. Further, various social and biophysical feedbacks lead to a litany of seemingly paradoxical
outcomes. When wildfires are suppressed, fuels accumulate, which promotes the size and severity of the future fire, ultimately making suppression more difficult. Such feedbacks are also seen among social actors. For instance, by treating wildfire risk as an
environmental hazard, rather than one linked to social behaviors, governments effectively subsidize the cost of developing in fire-prone areas, which in turn promotes more
development in high-risk areas and increased risk exposure over time.
Risk at the interface
Viewing wildfire as an event that occurs at an interface provides some insights into these dynamics. An interface reflects a place at which independent and somewhat unrelated systems meet and act on each other. In the simplest sense, fire is a chemical reaction that occurs at the interface between oxygen and fuel. At larger scales, wildfire activity occurs at the interface between weather and fuels. In order to propagate, fire depends on the gaseous byproducts produced as fuels are heated and organic matter begins to disassociate. Water, which is present in both living and dead fuels, serves to counteract this process by absorbing heat and dampening the reaction. Thus, fire activity
occurs at a global interface where fuels are available to burn and conditions are sufficiently dry for fire to propagate.
The risk from wildfire is also found at the interface. Representing the possibility of loss, wildfire risk is technically found where wildfire threatens directly threatens something of value. Geographically, this interface is found where communities and wildland meet. Here, wildlands capable of burning carry fire towards and through communities, creating the possibility of catastrophic loss. Much of this development occurred during a period in the twentieth century when wildfire was relatively quiescent, due in large part to long-standing policies of aggressive fire suppression. This, in turn, resulted in communities acutely ill-adapted to deal wildfire. Even to this day, many zoning rules in many threatened communities encourage homeowners to build and landscape using flammable materials and vegetation.
Social and biophysical characteristics within and surrounding WUI largely determine how and the degree to which communities are affected, how wildfire can be accommodated, and the type of institutional changes in wildfire risk governance that need to be made. Yet the reciprocal nature of these social and biophysical feedbacks can lead both communities and surrounding ecosystems to fall into undesirable states that resist easy fixes while risk continues to mount. Some of these problems can emerge when social institutions become misaligned with the ecological processes they intend to
manage, including when wildfire and wildfire risk spills across jurisdictional boundaries. In such cases, affected social actors must coordinate their actions, each working in
distinct geographies and/or function at different scales (e.g., individual, local, state, federal). These changes require time, investments, and foresight.
Despite advances in the conceptual framing of wildfire risk as a coupled human and natural system, empirical research on coupled wildfire risk remains lacking. My dissertation speaks to this gap by approaching the topic of wildfire risk as a coupled social and natural system. As a result, I approach this topic from several disciplinary angles – fire ecology, geography, and social science – and combine a variety of research techniques, including remote sensing, wildfire simulation, social surveys, network analysis, and participatory GIS mapping. The research is organized into four chapters, each written as an individual paper with its own set of research questions, results, and conclusions. This differs from the traditional dissertation monograph, yet my intention is that, taken together, the chapters create a cohesive body of work. The theme of the interface is present throughout this work. This research suggests that the reason that wildfire risk has expanded so rapidly in the wildland urban interface is the result of a diverse set of both social and biophysical processes operating on multiple scales. The interaction of society and the surrounding environment has resulted in a diversity of contexts under which risk must be managed and a spectrum of adaptive responses that need to be documented and learned from. What follows is a brief overview of each chapter.
Chapter overview
Chapter 1 examines the social and biophysical changes in wildfire activity in the western US over three decades. Beginning near the turn of the century, these changes
resulted in a series of national policies and programs designed to address elevated wildfire activity. Most of these efforts were designed targeted at restoring historical fire regimes, which describe the frequency and severity of disturbance that shaped landscapes prior to Euro-American settlement of the West. Still, fire regimes are a dynamic property of ecosystems resulting from the interaction of ignition sources, vegetation, and climate trends and patterns. What is more, the human footprint on fire regimes can be marked, both by changing the timing, frequency, and locations of ignitions, but also in terms of suppressing naturally occurring fires. Therefore, the possibility exists that the very standards used to guide national fire management programs have become obsolete and that wildfire activity has and will continue to evolve in directions in which current research and management practices are ill-suited.
Chapter 2 focuses on wildfire exposure to communities resulting from fires igniting in nearby national forests. Given its historical role managing wildfire, much of the attention on increased wildfires have been directed towards the US Forest Service (USFS), due in part to massive amenity value that national forests and public lands have come to have on nearby communities. Besides leading the USFS to increasingly frame its management mission in terms of ecosystems services and recreation opportunities, the slow encroachment of homes created the conditions that allow massive wildfires in public lands to threaten nearby communities. The agency has begun to address this threat
through a spectrum of strategic initiatives, but rarely are all tools appropriate to all contexts. Chapter 2 examines wildfire transmission from national forests into
simulation to estimate risk and builds from previous work using network approaches to describing wildfire risk. Looking at wildfire risk in the Western US reveals how much development, and therefore risk, is clustered into several dozen geographic clusters. These include areas like the Wasatch Front in Utah, the Front Range of Colorado, and North Central Washington. While labeling any one of these areas as a problem would come as no surprise, these areas also represent a deep library of learned experience as people and organizations within these regions have prepared for, experienced, and recovered from wildfire. Taking this perspective, there is much that can be learned from each region, and an urgent need to be able to apply that knowledge to other regions also experiencing elevated fire risk.
The following chapters switch scales to look at wildfire risk management in North Central Washington, one of the several dozen national risk hotspots discussed above. These chapters focus on the wildfire risk management system, a term meant to describe the spectrum of social actors involved in addressing wildfire risk in the region given that no one actor has the authority or capacity to coordinate all aspects of this endeavor. Framing wildfire risk management in terms of a network of interconnected individuals, organizations, and agencies is a novel aspect of this work, particularly given its
quantitative focus. Given its novelty, I frame these chapters around a series of relatively basic questions: Who is involved in wildfire risk management? What do they do? Where do they work? How do different actors work together?
My interest in Chapter 3 lies in understanding where different organizations involved in wildfire risk management actually work. For agencies that manage public
lands or fire districts associated with certain jurisdictions, this may seem rather obvious. Yet, when it comes to risk mitigation, fire response, and fire recovery, there an extensive set of organizations working outside their particular boundaries. Other organizations lack any specific ownership or special access to land yet play a critical role in managing wildfire risk. Further, as fires increased in size and intensity, there is a greater reason for individuals and organizations to be considered with risk in adjacent lands, and this is especially true in a mixed ownership landscape that characterizes much of the WUI. I examine differences in where organizational groups work using a term called risk management tenure. That tenure reflects, at least in part, some area of the landscape in which the organization maintains some interest or responsibility in managing wildfire risk. This notion is akin to the habitat range for a given species. Organizations, much like organisms, operate within specific geographies, which can be likened to the habitats of individuals groups of organisms. The extent of these geographies is tied to some extent on those of other organizational groups. Much like ecologists use the sightings of
organisms to estimate their geographic home ranges, I employ similar techniques to map the ‘habitats’ of different organizational groups with interests in wildfire. The analogy can be extended further to that of organizational diversity, which like biodiversity, reflects those areas of the landscape where risk tenures overlap. This overlap provides new opportunities for collaboration, but also new challenges and constraints for planning and implementing projects. Thus, another question raised in this chapter is how
become narrower in their mission? Or do they expand their mission to support a greater number of roles?
Finally, Chapter 4 looks at the social structure of collaboration among the risk management professionals surveyed above. Collaboration arises when two individuals or organizations are able to accomplish together what would be more difficult or impossible to do alone. Yet, organizations must also be careful in allocating their time given the amount of energy that initiating and sustaining collaboration takes. Over time, such partnerships naturally form, and taken as a whole, can be described as a network. In principle, the structure of this network thus reflects where benefits of collaboration outweigh costs, while the absence of ties can indicate the opposite. The entire network can then be decomposed into a small set of building blocks and using a new branch of network statistics, identify those patterns that are likely the result of some set of social processes, rules, or institutions. Given the increased emphasis on cross-boundary planning and management, I am particularly interested in how geography, fire activity, and ownership influence the relationships that form.
Chapter 1:
Shifting Fire Regimes in the American West
Abstract
Fire regimes provide a critical reference for management and restoration programs seeking to move disturbed ecosystems closer towards historical ranges of variability. Yet, the 21st century has marked a drastic shift in wildfire activity within many areas of the world including the western US, southern Australia, and Mediterranean Europe. This chapter looks at trends in large wildfire activity in the western US in
relation to mapped historical wildfire regimes. Primarily, I ask whether a greater share of the wildfire area burned over the past 30 years has occurred within areas historically characterized by mixed to high-severity wildfire events. In addition, as land ownership in many fire-prone regions in the US becomes increasingly fragmented and as large fires grow in size, fire regimes have taken on critical social dimensions as well. Thus, I
secondarily ask how wildfire activity has shifted with respect to the social landscape, and specifically with regards to land ownership. Finally, I look at the shift in the social and biophysical complexity of these regimes. I report a number of significant changes in fire activity during the era of mega-fire. Despite substantial increases in both shrub and forest cover, wildfire has accelerated more quickly among forest systems. Within forest
systems, a greater proportion of wildfire is occurring in mixed and high-severity regimes over the period surveyed. These changes have also shifted wildfire activity from BLM and private land tenures into the national forest. These results illustrate that while fire
regimes continue to be a useful frame for understanding fire activity and wildfire risk in the landscape, their utility becomes increasingly contingent upon trajectories of both climate and development.
Keywords
Fire regimes; Wildfire management; Environmental change
Research Highlights
● An acute shift in wildfire behavior around the year 2000 coincided with a series of management programs and actions aimed at stemming its increase.
● Fire activity has increased in most fire regimes within the western US, although it is especially prominent in forested systems.
● Within forested systems, increases in annual burn area are particularly pronounced in forests where fires historically occurred intermittently.
● The significance of these shifts is amplified by the broadscale expansion of the wildland urban interface into both forest and shrub wildland.
● Risk management policy targeting low and mixed fire regime forestland remains relevant, although rapid changes in other regimes suggest the need for expanded policy options.
1. Shifting Fire Regimes in the American West
Fire regimes translate highly stochastic wildfire events into meaningful ecological benchmarks. By characterizing ecosystem processes at the scale of decades to centuries, these regimes produce relatively stable estimates of burn frequency and severity. Fire regimes function as more than ecological descriptors; they also serve as a critical policy tool in contemporary planning and management regimes (Keane et al. 2009). Based on the management principle that ecosystems should be maintained within their historical range of variability in order to restore and maintain resilience, fire regimes are critical for quantifying ecological departure, expected fire behavior, and risk exposure estimates (Seidl et al. 2016), which are subsequently used to prioritize management actions.
Tracing at least to the 2000 US National Fire Plan, land managers have routinely utilized fire regimes in the planning and implementation of management programs at both project and landscape scales. Indeed, these requirements were codified in the 2003 Healthy Forest Restoration Act (USFS 2003), and all subsequent Farm Bills and omnibus spending bills identify fire regimes where hazardous forest reduction projects are
prioritized (Taylor 2019). Federal and state programs and planning documents have relied on this legal framework for land management decisions for decades, which, in turn, has shaped the investment of tens of billions of dollars used to conduct fuel treatments over millions of hectares (Valliant & Reinhardt 2017).
The increase in wildfire activity is well documented for the western US (Littell et al. 2009), as well as many other fire-prone areas around the globe (Krawchuk et al. 2009). Yet the overall increase in recorded wildfire activity may mask relative changes
among different types of fire regimes and vegetation types. Thus, there is a need to look at changes in fire activity across all vegetation in an integral way to report proportional changes over time in fire. While the annual area burned will vary by fire regime due to different return intervals, the ratio of area burned between any two fire regimes should remain constant over time, assuming social and environmental constraints on fire activity remain constant. Changes in climate, vegetation, ignition-patterns, suppression, and landscape-response affect these constraints, thus creating novel conditions under which fire regimes begin to change, which are likely to manifest as altered burn-ratios over time. For example, longer and hotter fire seasons unlocks fuels where wildfire activity was historically constrained by the lack of flammable conditions, including in forests characterized by mixed and high-severity fire regimes (Reilly et al. 2017, Holafsky et al. 2018). Human actions have also shaped extant fire regimes. Human ignitions of wildfire have vastly altered the timing of wildfire as well as expanded the spatial scale over which they occur (Balch et al. 2017). Aggressive fire suppression has been central to wildfire management for most of the twentieth century, and the resultant fuel loads have shifted fire behavior from frequent low-severity towards present-day high-severity megafires in many forests across the western US (Hessburg 2015).
Fire regimes are shaped by bottom-up and top-down constraints, which Krawchuk and Moritz (2011) posit vary along a wet-to-dry gradient. On the wetter extreme, fuels are abundant and fuel moisture acts as the primary constraint to fire. In these conditions, hotter and drier weather will result in more fire. On the drier extreme, flammable
activity. In these environs, antecedent precipitation is critical in building fine fuels. McKenzie and Littell (2016) demonstrate how differences within annual burn area among western US ecoregions vary both with regards to aridity in addition to moisture
conditions in the growing season prior to the fire. At the ecoregional scale, they report a loose negative relationship between year-of and year-prior precipitation, such that prior year moisture conditions tend to be less correlated with area burnt in regions where the area burnt is correlated with fire weather (McKenzie and Littell 2016).
Differential shifts in fire activity suggest that the operation window where land managers have the greatest leverage may be shifting towards forests where the
effectiveness of fuel reduction efforts is not well understood or where such actions may push the forest further outside of historic structure and composition (Schoennagel et al. 2018). For instance, thinning and prescribed burns are often appropriate in dry forests where land management and fire suppression have shifted historically open, park-like forests into the denser even-aged forest of today. On the other hand, this typical dry forest strategy so dominates both the literature and policy papers in the western US that few adaptation options have been described for other forest types, especially those in which disturbances are driven less by forest structure and fuels, and more by climate and weather (Schoenagel et al. 2004; Perry et al. 2011; Halofsky et al. 2018). There thus exists the risk that warming-mediated patterns in fire activity will evolve in directions for which existing policy and science are ill-prepared, especially given the degree to which mapped fire regimes dictate the implementation of many of the programs.
As fire activity shifts, so too does the relationship between fire activity and underlying ownership, planning, and management regimes. Regions were fire activity had been relatively quiescent during much of the 20th century are now confronting wildfire at frequencies and intensities that make established programs and protocols inefficient if not entirely ineffective (Moritz et al. 2014). In particular, the management of wildfire risk has been profoundly reshaped development within the wildland urban
interface (WUI). Radeloff et al. report that between 1990 and 2010, the wildland urban interface increased in terms of land use by 30%, representing the most rapid change in land use during the period. They further find that development within the wildfire perimeters occurred at roughly double the national growth rate in houses, exacerbating the adverse relationship between development and wildfire.
These factors further separate the backward-looking dimension of fire regimes as a historical reference from the forward-looking dimension of fire regimes as a
management-heuristic. This separation may be contributing to the emergence of ‘mega-disturbances’ in temperate forests (Millar and Stephenson 2015). The scale of these disturbances continues to far outmatch the capacities of federal and state land managers (North et al. 2015; Moritz et al. 2017; Schoennagel et al. 2018) yet continue to generate intense political pressure to accelerate the rate and scale of mitigation efforts that were developed under drastically different conditions. This chapter seeks to compare recent fire trends within and among established fire regimes to evaluate how wildfire activity has changed over time, with a particular interest in the years following 2000 that have been increasingly referred to as the age of megafires. I address the following questions:
How has annual area burned changed with respect to established fire regime types, and do these changes differ among major vegetation types? Has the proportional share of fire among vegetation systems and fire regimes shifted over time? How are these shifts distributed within the wildland urban interface and among different land ownerships?
2. Methods
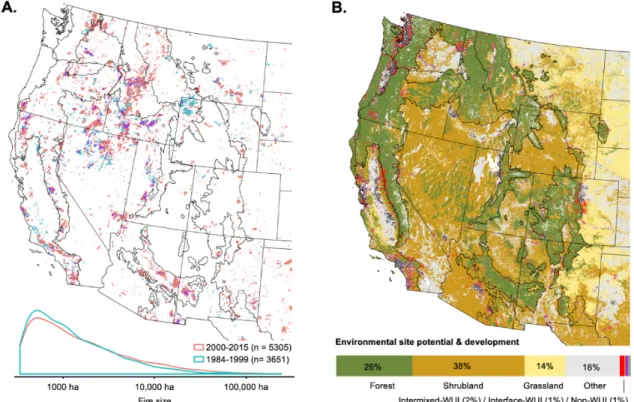
The western USA, defined here as the area west of the 100th meridian in the
conterminous US, is a geographically diverse region composed of forest ecosystems (27%) and lowland shrublands and deserts (39%; Figure 1). Compared to fire-prone areas globally, fires are relatively infrequent, large in size, and intense (Archibald et al. 2013). Most fires occur between May and October (Westerling 2003), with timing dependent primarily on latitude and secondarily on elevation. Three decades of large fires (1984 to 2015) were assessed using perimeters recorded by the Monitoring Trends in Burn Severity program (n=8956, MTBS 2018). Perimeters were intersected with several geographic layers in order to measure changes in wildfire patterns during that period. Reference data were resampled to a 270 m grid based on majority coverage. Fire
perimeters were grouped as prior- and post-2000 (i.e., 1984-1999, 2000-2015) based on (a) previous climate-fire trends (Abatzoglou et al. 2017), and (b) the development of the US National Fire Plan circa 2000. Burn perimeters range from 500 ha to more than 1,000,000 ha in size.
Figure 1. (A) Large wildfires occurring in the western US between 1984 and 2015 prior- and post-2000. (B) Environmental site potential alongside WUI and non-WUI developed areas.
2.1. Classifying vegetation and fire regimes
Landscapes were classified in terms of vegetation potential and historical fire regimes. Vegetation potentials (ESP; Rollins et al. 2009, Holsinger et al. 2006) describe the climate-constrained late-stage successional communities in the absence of
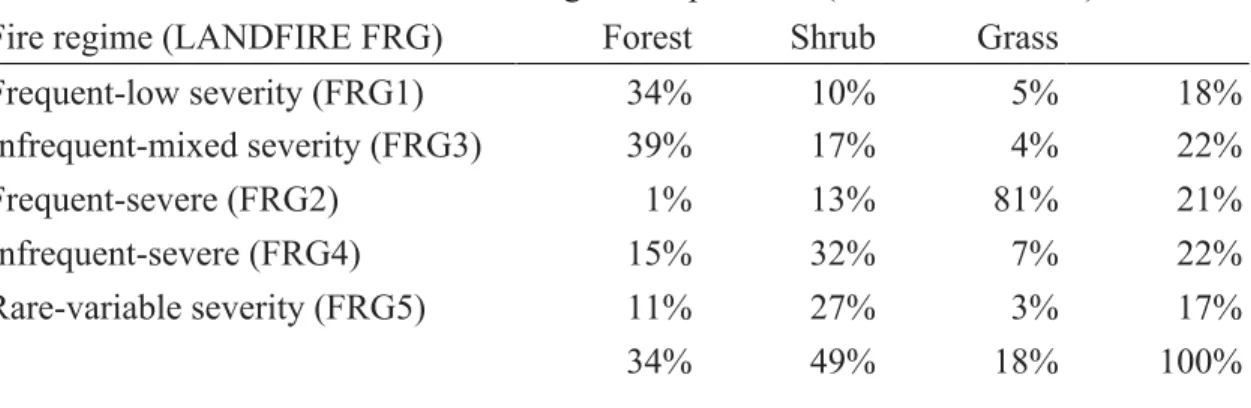
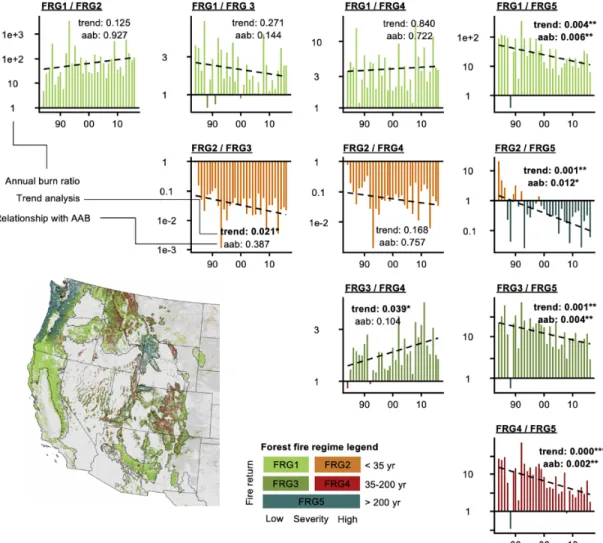
disturbances (e.g., wildfire, human activities, etc.), which makes it is more appropriate for longer time-series analyses. Similar to Abatzoglou and Kolden (2013), vegetation potential was aggregated into forest systems (upland forest and woodland, 27%), shrubland systems (39%), grassland systems (14%), and other natural systems (e.g., sparse vegetation, wetlands, undetermined; 17%). Fire regimes were described according to the frequency and severity of wildfire disturbance using five Fire Regime Groups (FRG) described by LANDFIRE (Table 1). FRGs were assigned for the entire US based on historical (pre-European) fire return interval and first-order fire effects with regards to the dominant overstory (see Rollins et al., 2009). LANDFIRE measures fire severity in terms of mortality within the dominant overstory. Severe fire regimes tend to result in more than 75% mortality within the dominant overstory, while mortality in those low-severity regimes tends to be less than 25%. Such measures are clearly scale-dependent. Severity is generally unspecified in FRG5 fire regime due to its long return interval and bimodal distribution between fuel-limited (e.g., low desert shrubland) and moisture-limited systems (e.g., high subalpine). It is important to note that fire regimes describe typical fire behavior and not the actual severity of the wildfires that occurred. Fire regimes are strongly associated with vegetation potential (Table 2). Forest systems have historically experienced frequent low-severity (34%) or infrequent low-to-mixed severity
fire regimes (39%) while shrublands often exhibited higher severity regimes with longer fire return (frequent=12%, intermittent=32%, rare =27%). Grass systems – typically defined by frequent high-severity fires – represent less than 20% of the region and an even smaller share of its fire. As a result, this work focuses primarily on fire regimes in forest and shrubland systems (Figure 2).
Table 1. LANDFIRE fire regime groups for the western US (Rollins et al., 2009).
Group Fire return Severity Veg potential*
FRG1 Frequent (0-35 years) Low (occasionally mixed) Forestland
FRG2 Frequent (0-35 years) Replacement Grassland
FRG3 Intermittent (30-200 years) Mixed (occasionally low) Forest / shrub
FRG4 Intermittent (30-200 years) Replacement Shrubland
FRG5 Rare (200+ years) Any severity (often severe) Forest / shrub
* dominant vegetation physiognomy as a product of both climate and disturbance
2.2. Classifying social dimensions of fire activity
Landownership was constructed from the USGS Protected Areas Database (PAD 2016). Public land covers more than half the western US. Major land-tenure tenures were divided into protected and non-protected lands according to PAD. As a general rule, the USFS manages lands at higher elevations that have heavier fuel while the Bureau of Land Management (BLM) manages lands with finer fuels such as grasses and shrubs. All land not covered by the PAD data were assumed private and were further divided into
developed and undeveloped areas. Developed areas contained structure density greater than 6.1 structures per hectare and were further divided into non-WUI, interface-WUI
(development abutting wildland) and intermix-WUI (development within wildlands) using definitions and WUI descriptions developed by Radeloff et al. (2006).
Table 2. Cross-tabulation between vegetation potential and fire regime group. Marginal totals are shown in bold (data source: LANDFIRE).
Vegetation potential (LANDFIRE ESP)
Fire regime (LANDFIRE FRG) Forest Shrub Grass
Frequent-low severity (FRG1) 34% 10% 5% 18% Infrequent-mixed severity (FRG3) 39% 17% 4% 22% Frequent-severe (FRG2) 1% 13% 81% 21% Infrequent-severe (FRG4) 15% 32% 7% 22% Rare-variable severity (FRG5) 11% 27% 3% 17% 34% 49% 18% 100%
Figure 2. (A) Map of forest systems colored by fire regime (103.5 M ha, 23% of area shown). (B) Map of shrubland systems colored by fire regime (124.6 M ha, 28% of area shown). Other cover types (primarily grasslands and barren) are shown in light grey (data source: LANDFIRE).
2.3. Analytics
MTBS fire perimeters were intersected against underlying raster stacks containing the above-mentioned layers for vegetation potential, FRG, and PAD ownership then summarized for each fire in terms of area burned. Trends in fire activity were assessed both as annual area burned (AAB) and as a proportional share within a given year. I group values prior- and post-2000, although I considered other breakpoints by examining the absolute difference in median AAB across a range of breakpoint values. Differences between periods were assessed using the non-parametric Wilcoxon signed-rank test. To assess changes in relative burn frequency over time, I compare annual burn ratios, which
measure the extent of area burned within one fire regime group with respect to another. Under static climate conditions, the burn ratio should be constant. All burn ratios were log-transformed to address their bounded nature. Trends in burn-ratios were assessed using the Mann-Kendall test. Finally, burn-ratios were compared to overall AAB, and this relationship was tested as a standard linear regression.
3. Results
3.1. Shifts in fire activity among vegetation systems
AAB increased substantially between 1984 and 2015. While various breakpoints were considered, the difference in AAB between periods was greatest from 1999 and 2001 (see Figure 3A). Thus, AAB is divided into two periods for the remainder of the results: 1984-1999 and 2000-2015. Median AAB increased 164% (0.76 M ha/yr) from 0.47 M ha/yr prior to 2000 (SD = 0.48 M ha/yr) to 1.23 M ha/yr after to 2000 (SD = 0.79 M ha/yr). Most large wildfires during the period burned in either forests or shrublands (83%), yet the rate of increase differed between the two vegetation types. The median forest AAB increased from 0.16 M ha to 0.62 M ha (385% increase, Wilcox p-value < 0.001) while the median shrubland AAB increased from 0.27 M ha to 0.44 M ha (162% increase, p-value < 0.001). Despite increases in both systems, forest AAB saw a greater proportional increase such that forest fires became the dominant wildfire activity. Between 1984-1999, forest wildfires accounted for 31% of the total area burned, which rose to 44% between 2000-2016, reflecting a three-fold increase in forestlands AAB. By contrast, fire activity within shrublands proportionally dropped from 52% to 43% after 2000, despite a 2-fold increase in shrubland AAB.
Figure 3. (A) Annual area burned (AAB) colored by vegetation system (forest, shrubland, grass, other). (B). Annual values prior- and post-2000 with
significance (p-values less than 0.05 highlighted in red). (C/D) Same as above but reported as an annual proportional share (%/yr).
Table 3. Change in annual area burned (AAB) among fire regimes groups for forest and shrubland systems. Changes are reported as an absolute value, percent, and as a proportional share of the overall change. Historical mean fire return intervals (MFRI) derived from LANDFIRE.
Vegetation
potential regime Fire Historical MFRI (ha/yr) AAB 84-99 (ha/yr) AAB 00-15 (ha/yr) Δ (ha) Δ (%) Δ (share) Forest FRG1 1,372,678 82,565 338,179 255,614 310% 37% FRG2 49,665 2,185 5,019 2,834 130% 0% FRG3 383,104 27,874 184,960 157,086 564% 23% FRG4 125,525 18,590 71,195 52,605 283% 8% FRG5 22,088 1,066 20,734 19,669 1845% 3% Shrub FRG1 291,824 21,650 53,617 31,966 148% 5% FRG2 903,918 12,444 22,899 10,455 84% 2% FRG3 236,968 46,851 104,821 57,970 124% 8% FRG4 438,209 119,403 247,165 127,762 107% 18% FRG5 63,752 47,116 27,098 -20,018 -42% -3%
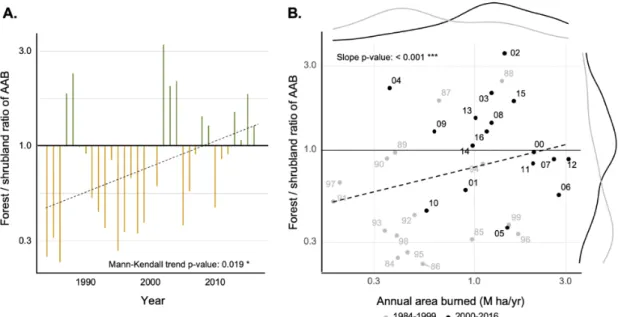
Reflected as an annual burn ratio between forest and shrubland, forest AAB exceeded shrubland AAB in 9 out of 16 years post-2000, compared to 2 of 16 years prior-2000 (Figure 4A). The overall trend is positive and significant (Mann-Kendall statistic = 0.288, p = 0.019). This trend is correlated with the overall increase in AAB. Figure 4B shows the ratio between forest and shrubland AAB against overall AAB (i.e., regardless of the vegetation system), with each point representing a single year. The figure shows a significant positive relationship between total AAB and the proportion of that area
occurring within forest systems. The margin distribution curves show significant differences in both dimensions, suggesting substantial shifts in both AAB post-2000 in addition to the proportional share of fires occurring in forested systems.
Figure 4. (A) Annual burn ratio between forest- and shrub-systems by year (bars colored by vegetation potential; green = forest; brown = shrub). (B) Annual burn-ratio compared to overall annual area burned. Differences between periods in the distributions of AAB and burn-ratio are shown above and to the right. In both panels, the 1:1 ratio is shown as a horizontal solid line. Significance labeled for trends in each panel.
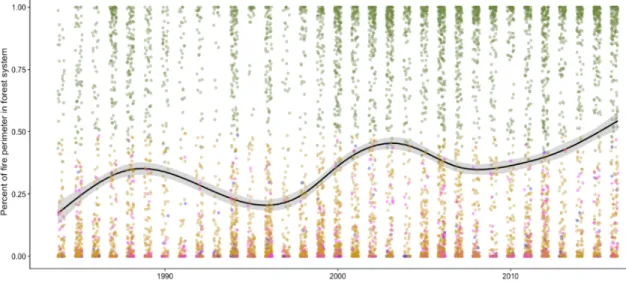
I also examined the vegetation systems involved at the level of individual fires to determine whether the increase in forest AAB may be the result of interactions between shrub and forest systems. Because of the lack of cover, open shrubland fires can grow rapidly in size, so I examined the degree to which expansion of forest fires may have been the result of fires expanding rapidly under open conditions. Figure 5 shows the proportion of a given fire that occurred within forested systems for all MTBS fires (n=9228) over time. While the trend line shows a greater portion of forest-dominant fires over time, the perimeter of individual fires continued to bifurcate between shrub- and forest-systems. Most individual fires (90%) occurred exclusively in either shrub or forest systems while relatively few fires spanned both shrub and forest sites. This bifurcation possibly reflects the divergent environmental constraints that define fire activity within each environment.
Figure 5. Percent of wildfire burn area (n=9228) within forest system (compared to other vegetation types) colored by dominant vegetation system. Point color reflects dominant vegetation potential. Green = forest; Orange = shrubland; Purple = grassland.
3.2. Shifts in wildfire regimes within vegetation systems
Differences in fire activity varied among fire regimes within both forest and shrubland systems. Figure 6 shows the annual area burned (millions of hectares) by forest (left) and shrubland systems (right). Among forests, wildfire AAB significantly increased in 4 out of 5 fire regimes: FRG1 from 0.08 M ha/yr to 0.33 M ha/yr (415%, Wilcox p < 0.001); FRG3 from 0.03 M ha/yr to 0.15 M ha/yr (500%, Wilcox p < 0.001); FRG4 from 0.02 M ha/yr to 0.07 M ha/yr (390%, Wilcox p-value < 0.001), and; FRG5 from 1070 to 20100 ha/yr (2000%, Wilcox p < 0.001). While wildfire in low-severity FRG1 forest systems remained dominant in most years, it dropped its annual share from 60% to 55%. This change was reflected in the proportional gains in FRG3 and FRG5. Changes in fire activity within shrubland systems were subtler. Overall AAB increased in 3 out of 5 fire regimes: FRG1 from 0.02 to 0.05 M ha/yr (240% increase); FRG2 from 0.01 to 0.02 M ha/yr (200% increase), and; FRG4 from 0.12 to 0.25 M ha/yr (208% increase). The proportional split among shrubland fire regimes has remained steady.
Figure 6. Variation in annual area burned by dominant fire regime within forest (A) and shrubland (B) systems, divided prior- and post-2000 (Wilcox p-values less than 0.05 are in bold). (C/D) Same as above but transformed to annual
proportional share (%). Fire regimes: FRG1 = frequent and low-severity, FRG2 = frequent and severe; FRG3 = intermittent and mixed-severity; FRG4 =
intermittent and severe; FRG5 = infrequent with variable severity.
Change in the proportional share of wildfire activity among different fire regimes reflected a differential acceleration in some fire regimes. Figure 7 depicts changes in annual burn ratios between all pairwise fire regime combinations in forest systems. For each pair, the significance of the trend is reported (Mann-Kendall test) in addition to the
correlation between the ratio and AAB. Changes in annual burn ratios were most notable among FRG5 forests, where fire activity has accelerated faster than in all other forest regimes. For instance, in 1990, AAB in forests characterized by low-severity fire regimes (FRG1) was approximately 100-times more common than fire activity in FRG5 forests, although by 2010 this ratio was an order of magnitude less. This trend was similar, although slightly more muted, with regards to mixed-severity regimes (FRG3). The relationships were highly correlated with overall AAB.
Figure 7. Pairwise comparison of annual burn ratios among forest wildfire regimes and annual area burned. Panels are equivalent to that shown in Figure 4A. Significance of the trend (dashed line) is labeled (trend) along with
correlation with the total annual area burned (AAB; equivalent to Figure 4B). Significant values are highlighted. Fire regimes: FRG1 = frequent and low-severity, FRG2 = frequent and severe; FRG3 = intermittent and mixed-severity; FRG4 = intermittent and severe; FRG5 = infrequent with variable severity.
While wildfire activity shifted towards higher severity regimes within forest systems, trends in shrublands were more complex. Further, while some shrub fire regimes show a relationship between annual burn activity and where that activity occurs, there does not appear to be a significant difference pre- and post-2000. Specifically, the correlation between overall AAB and annual burn ratios were statistically significant for comparisons between FRG1/FRG3, FRG1/FRG5, and FRG3/FRG4. In general, wildfire activity has shifted towards low-severity shrub regimes (FRG1 & FRG3) and moved away from high-severity regimes (FRG2, FRG3, & FRG5). Despite the overall increase in shrubland fire activity, no pairing showed significantly differential acceleration among fire-regimes.
Figure 8. Pairwise comparison of the trends in burn-ratios among shrubland wildfire regimes. Significance of the trend (dashed line) is labeled (trend) along with correlation with the total annual area burned (AAB; equivalent to Figure 4B). Significant values are highlighted. Fire regimes: FRG1 = frequent and low-severity, FRG2 = frequent and severe; FRG3 = intermittent and mixed-severity; FRG4 = intermittent and severe; FRG5 = infrequent with variable severity. 3.3. Social dimensions of shifting fire regimes.
Figure 9 shows proportional changes in area burned by land ownership over time (both forest and shrublands). The area burned by large fires has increased significantly in USFS and declined in BLM and private lands, both of which tend to occupy drier
ecosystems at lower elevations. Trends in USFS managed lands are particularly notable. These lands occur at lower elevations relative to protected wilderness and roadless areas.
Figure 9. Proportion and trends (dashed line) of annual area burned partitioned by land ownership and protection status (all vegetation types; panels ordered by overall proportional share of fire; note differences in y-axes). Trends lines over period are shown as dashed lines. Y-axes are freely scaled so note labeled values. FSM/P = National forest managed/protected; PRM/P = Private
managed/protected; BLM/P = Bureau of Land Management managed/protected; STM/P = State managed/protected.
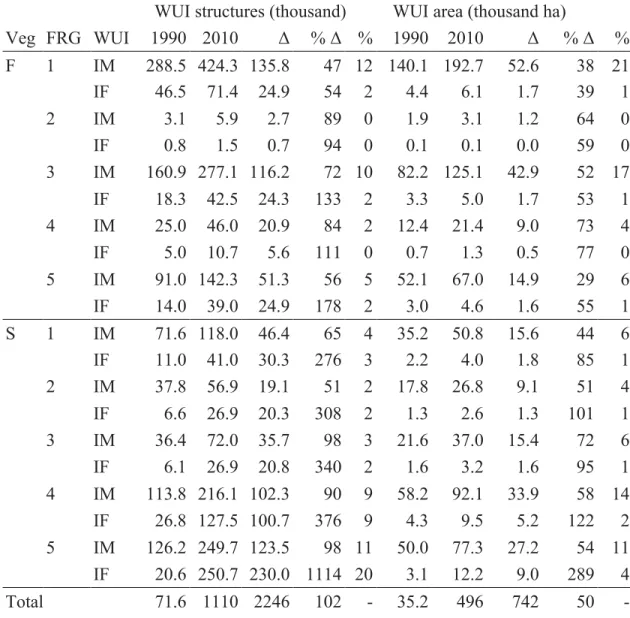
Even though the actual degree of intersection between fire and development remains limited, wildfires pose risks to communities well before reaching developed areas. Allocation suppression resources are often proportional to the potential for loss. Expansion of development within the fire-prone wildland urban interface increases the chance that fire threatens life and property. Still, it remains unclear how this expansion has varied with respect to both vegetation type and fire regime given that most definitions of WUI do not distinguish between shrub or forest wildlands, much less the particular fire regime present in each. Intermixed WUI in forested areas continued to be the most
expansive form, although it expanded at a slower rate than shrubland intermix and interface WUI. While intermixed WUI in FRG1 forestlands continued to be the most prevalent both in terms of area covered and the number of structures, it expanded at a slower rate than almost any other WUI class. Nonetheless, in 2010, there were nearly a half million structures in FRG1 forests. Table 4 shows that expansion of the
WUI-structures was particularly notable within the shrubland interface, with growth well above 300%, and in the case of shrubland FRG5, well beyond 1000%. The expansion of forest-WUI was particularly notable in FRG3 and FRG4 fire regimes. Expansion of the
shrubland-interface WUI was particularly notable in the FRG4 and FRG5 fire regimes. Figure 10 plots change of the WUI against AAB across vegetation potential and fire regime as a single vector. The butt of the arrow reflects the earlier value (i.e., 1990) while the head of the arrow shows the latter (i.e., 2010). Arrows in the diagonal represent the change in both domains, vertical arrows highlight changes primarily in the growth of WUI, while horizontal arrows show change primarily in AAB. The expansion of the WUI is described both in terms of total area and number of structures. Most WUI structures are located in forests in FRG1, FRG3, and FRG5 while shrubland WUI was most extensive in FRG4 and FRG5.
Figure 10. Change in fire activity (median AAB) and WUI (ha and structure count). Arrows labeled by vegetation potential, fire regime group, and WUI type: F = forest; S = shrub; 1-5 = fire regime group; M = mixed WUI; F = interface WUI. The top row represents WUI change as area. The bottom row represents WUI change as structure count.
Table 4. Change in the wildland urban interface between 1990 and 2010 by vegetation potential and fire regime group. Changes are reported both as area and structure count in terms of absolute change, growth, and the proportional share of growth. IM = intermixed WUI; IF = interface WUI. Shr = share of WUI structure and area as of 2010.
WUI structures (thousand) WUI area (thousand ha)
Veg FRG WUI 1990 2010 Δ % Δ % 1990 2010 Δ % Δ % F 1 IM 288.5 424.3 135.8 47 12 140.1 192.7 52.6 38 21 IF 46.5 71.4 24.9 54 2 4.4 6.1 1.7 39 1 2 IM 3.1 5.9 2.7 89 0 1.9 3.1 1.2 64 0 IF 0.8 1.5 0.7 94 0 0.1 0.1 0.0 59 0 3 IM 160.9 277.1 116.2 72 10 82.2 125.1 42.9 52 17 IF 18.3 42.5 24.3 133 2 3.3 5.0 1.7 53 1 4 IM 25.0 46.0 20.9 84 2 12.4 21.4 9.0 73 4 IF 5.0 10.7 5.6 111 0 0.7 1.3 0.5 77 0 5 IM 91.0 142.3 51.3 56 5 52.1 67.0 14.9 29 6 IF 14.0 39.0 24.9 178 2 3.0 4.6 1.6 55 1 S 1 IM 71.6 118.0 46.4 65 4 35.2 50.8 15.6 44 6 IF 11.0 41.0 30.3 276 3 2.2 4.0 1.8 85 1 2 IM 37.8 56.9 19.1 51 2 17.8 26.8 9.1 51 4 IF 6.6 26.9 20.3 308 2 1.3 2.6 1.3 101 1 3 IM 36.4 72.0 35.7 98 3 21.6 37.0 15.4 72 6 IF 6.1 26.9 20.8 340 2 1.6 3.2 1.6 95 1 4 IM 113.8 216.1 102.3 90 9 58.2 92.1 33.9 58 14 IF 26.8 127.5 100.7 376 9 4.3 9.5 5.2 122 2 5 IM 126.2 249.7 123.5 98 11 50.0 77.3 27.2 54 11 IF 20.6 250.7 230.0 1114 20 3.1 12.2 9.0 289 4 Total 71.6 1110 2246 102 - 35.2 496 742 50 -
4. Discussion
At the outset of this chapter, I asked whether changes in fire activity will alter management landscape such that current programs are poorly suited to match those changes. Fire activity has increased across the western US, although done so at rates that depend on both vegetation potential and fire regimes. Over the period examined, wildfire activity in forest systems expanded at nearly twice the rate of shrublands, such that forest fire has become the dominant fire activity in most years. The fire regime variable
constraints hypothesis provides some insight as to why these shifts are occurring. Setting aside suppression, fire activity in most forest systems is constrained by a combination of fuels and moisture, whereas fire in most shrubland systems is primarily constrained by fine fuels. Changes in fire activity suggest shifts in underlying constraints, which in turn has allowed fire to expand more rapidly in certain conditions (Krawchuk et al. 2009).
Given the time needed to accumulate biomass, forests tend to form in conditions that limit fire frequency or severity. In most forests, fuel moisture serves as the primary constraint to fire. Low-severity fire regime forests are somewhat unique since higher temperatures, longer fire seasons, drier fuel conditions of these forests tend to favor fire. Here, availability of fuel historically limited the size and intensity of flames, yet due to an extended fire deficit in during much of the 20th century, due in part to aggressive
suppression, has essentially primed these forests for more severe fires (Reilly et al 2017; Haugo et al. 2019). This included sites that had forest potential but were maintained in savannah or open-prairie conditions from frequent burns. Comparing historical
of supporting forests historically existed in grassland, shrubland, or open-canopy states (Hessburg et al 2019). Haugo et al. (2019) examined fire activity in the Pacific Northwest during the same period and reported fire deficits in all forests, though specifically in those that historically burned frequently.
Acceleration of forest wildfire activity was particularly acute within mixed to high-severity regime forests. Annual large forest wildfire frequency in mesic and northern forests is significantly correlated with spring and summer temperature with the largest fire years occurring in years with both warm spring and summer temperatures and early-spring snowmelt. For instance, fire seasons average approximately 3 months longer than those found 3 decades earlier (Westering 2016). What is more, over the same period, the average large wildfire burn time grew from nearly six days to over 50 days. The most sensitive forests are ones that historically had a mean snow-free season of just two to four months and high spring and summer evapotranspiration. As wildfire shifts into mixed and high-severity forests, larger-scale landscape patterns become comparatively more
important in determining the fire activity. Past burn perimeters can both inhibit fire spread in the period immediately following a fire, as well as enhance its spread once flammable shrubs and grasses have reestablished (Parks et al. 2016; Ager et al. 2017). Fire in mesic conditions is driven by climate as dry and warm conditions deplete fuel moisture, increase evapotranspiration, and widen soil water deficits. Because these conditions are linked to regional fluctuations in climate, fire conditions tend to form across wide swaths of the landscape (Heyerdahl et al. 2008; Liu et al. 2016).
Given the increase in wildfire across all forest types, there remains substantial debate on the role of management in this transition (Hessburg et al. 2016; Schoennagel et al. 2017). While evidence of the effectiveness of these programs is well-established in lower severity regimes, there is a weaker ecological understanding of the natural range of variability of mixed fire regimes in the western US, and thus managers face greater uncertainty as to what guidelines to follow. These results suggest that an increasingly greater portion of wildfires have been occurring in forests characterized by mixed-to-high fire regimes. Further, fire occurring under extreme conditions tends to become decoupled from previous hazardous fuel reduction efforts. It is increasingly important to critically evaluate the effectiveness and implications of applying strategies conceived for dry forests with low-severity regimes into forests where wildfire has historically been less frequent and more severe (McWethy et al. 2019). Further, there is evidence that in human-dominated landscapes that past actions have simplified forest structure and created the conditions that have amplified the scale of disturbances. For instance, Summerfield et al. 2018 noted that in areas of high disturbance activity (i.e., high severity, prevalence, etc.), disturbance patches were larger and less complex in the human-dominated landscapes outside of protected areas than in protected areas. Even still, large-scale disturbances can override the effect of human land use and dominate landscape patterns in forest ecosystems. Since many of these effects are climate-sensitive, future conditions could produce a more coarse-grained landscape from the increased scale of disturbance (Hessburg et al. 2019).
While fire in forest systems has increased at a quicker rate in higher-severity regimes with longer fire return intervals, fire in FRG1 forests remains the most extensive in terms of annual area burned. In the examination of fire activity, I did not consider changes in fire severity. Numerous other studies have reported these changes. Reilly et al. (2017) reported a five-fold increase in burn severity in low-severity forests. Combined with poor post-fire recruitment, increased severity may result in substantial and
irreversible loss of dry-forests (Kemp et al. 2019; Davis et al. 2019) due to the interval-squeeze resulting from increasingly frequent disturbance and reduced plant growth (Enright et al. 2015). While fuel management activities have been extensive in low-severity regime forests, the actual amount of overlap between fires and treated stands is quite low (Barnett et al. 2016). This suggests that management is unlikely to have
significantly altered burn area, although these measures may hide indirect effects of such treatments on fire activity. Suppression activity may be more successful in these forest types and climate change may have weakened the antecedent effect of rainfall pulses on the growth of fine fuels. Further, it could be that warming effects on fire size were blunted in these forests due to a relative lack of heavy fuels compared to other fire-regime forests.
Most studies on change in fire activity continue to preference forest systems, which has led to a comparative gap in knowledge regarding changes in shrubland systems. Exceptions include ecoregional studies such as McKenzie and Littell (2017) as well as Parks et al. (2015). For example, in examining fire deficits throughout the western US, Parks et al. (2015) note a fire surplus in certain shrubland systems, which they