Study on business-related services
Main report
Client: European Commission, DG Enterprise and Industry
Rotterdam, 12 December 2012
Study on business-related
services
Main report
Client: European Commission, DG Enterprise and Industry
Nora Plaisier Gert-Jan Linders Erik Canton
2 SJ-M/GJL FN97638Rep
About Ecorys
At Ecorys we aim to deliver real benefit to society through the work we do. We offer research, consultancy and project management, specialising in economic, social and spatial development. Focusing on complex market, policy and management issues we provide our clients in the public, private and not-for-profit sectors worldwide with a unique perspective and high-value solutions. Ecorys’ remarkable history spans more than 80 years. Our expertise covers economy and competitiveness; regions, cities and real estate; energy and water; transport and mobility; social policy, education, health and governance. We value our independence, integrity and partnerships. Our staff are dedicated experts from academia and consultancy, who share best practices both within our company and with our partners internationally.
Ecorys Netherlands has an active CSR policy and is ISO14001 certified (the international standard for environmental management systems). Our sustainability goals translate into our company policy and practical measures for people, planet and profit, such as using a 100% green electricity tariff, purchasing carbon offsets for all our flights, incentivising staff to use public transport and printing on FSC or PEFC certified paper. Our actions have reduced our carbon footprint by an estimated 80% since 2007. ECORYS Nederland BV Watermanweg 44 3067 GG Rotterdam P.O. Box 4175 3006 AD Rotterdam The Netherlands T +31 (0)10 453 88 00 F +31 (0)10 453 07 68 E netherlands@ecorys.com Registration no. 24316726 W www.ecorys.nl
Table of contents
Preface 5
Summary 7
1 Introduction 11
2 Services in the EU economy: some key issues 13
2.1 Business services in the EU economy: overview of the sector 13
Industry definition 13
Industry overview 13
Importance of business services in the sector structure of the EU economy 18
2.2 Productivity in business services 19
2.3 Interaction with downstream sectors 22
Outsourcing 22
Co-production 23
Knowledge spill-overs 24
2.4 Information asymmetry and the role of standards 24
Current status of standards development 25
The role of service standards 26
Standardization versus customization in services 27
2.5 Selection of sectors for detailed analysis 27
3 Main findings on advertising and market research 31
3.1 Sector overview 31
3.2 Competitive position 31
3.3 Market conditions, downstream relations and business response 31
3.4 Framework and regulatory conditions 32
3.5 SWOT analysis 34
4 Main findings on design 35
4.1 Sector overview 35
4.2 Competitive position 35
4.3 Downstream relations and market conditions 35
4.4 Framework and regulatory conditions 36
4.5 SWOT analysis 37
5 Main findings on facility management 39
5.1 Sector overview: industrial cleaning 39
5.2 Competitive position of the industrial cleaning sector 39
5.3 Downstream relations and market conditions of the industrial cleaning sector 40 5.4 Framework and regulatory conditions for the cleaning sector 40
5.5 SWOT analysis for the cleaning sector 41
5.6 Sector overview for private security services 42
5.7 Competitive position of private security services 43
5.8 Downstream relations and market conditions for private security services 43 5.9 Framework and regulatory conditions for private security services 44
4 Study on business-related services
5.10 SWOT analysis for private security services 45
6 Main findings on technical consulting 47
6.1 Sector overview 47
6.2 Competitive position 47
6.3 Downstream relations and market conditions 48
6.4 Framework and regulatory conditions 48
6.5 SWOT analysis 50
7 SWOT analysis of business services: a synthesis of the sector studies 51
7.1 Strengths 51
7.2 Weaknesses 51
7.3 Opportunities 52
7.4 Threats 53
8 Market failures relevant to business services 55
8.1 Market structure- existence of entry and exit barriers? 55
8.2 Asymmetric information 57
8.3 Spill-over effects 59
9 Policy recommendations 61
9.1 Reducing information asymmetry in the interaction with the client 61
9.2 Enhancing innovation and knowledge spill-overs 62
9.3 Addressing entry and exit barriers 65
Preface
This report presents the results of the study on business-related services, which is carried out by Ecorys for the European Commission (DG Enterprise) under the framework contract for Sector Competitiveness Studies (SCS).The project started in September 2011 with data analysis and a literature review, the results of which were presented in the interim report in January 2012. In addition, four case studies were conduced by the following experts: Gert-Jan Linders, Lars Meindert and Susan Warmerdam (Ecorys) conducted the study on Advertising and Market research. Isabelle de Voldere (IDEA) was leading the study on design services, Paul Baker (Ecorys) the study on Facility Management (industrial cleaning and private security services), and Benita Kidmose Rytz (DTI) the study on technical consulting. This report contains a summary of the literature and case studies, provides a synthesis of the strengths, weaknesses, opportunities and threats, identifies market failures and formulates policy recommendations for business services. We would like to thank the interviewees for their co-operation in this study, and Henk Kox (CPB) for constructive feedback on draft versions of this report. We also want to thank officials from the European Commission, and in particular Peder Christensen, Chris Allen and Jerneja Jug, for their guidance and feedback during all stages of the project.
Erik Canton Teamleader
Summary
Background and objectives
Over the last few decades, the EU has become a “service economy” as service sectors have grown faster than manufacturing sectors, and services now account for some 70 percent of the EU economy. This also implies that the performance of the EU economy will largely depend on the performance of the service sectors.
In this report we concentrate on an important segment of the service sectors, namely business services. The business service sector currently accounts for almost 2000 billion euro turnover and 24 million people are directly employed in the sector in a total of more than 5 million enterprises. Several studies have shown that the level of productivity in business services is substantially below that of the U.S., explaining a large part of the productivity gap between the EU and the U.S. at the macroeconomic level. The question then comes to the fore what is behind this malfunctioning of EU business services, and what can be done at EU and national policy levels to improve its
performance.
We focus in particular on four business to business service sectors: 1) advertising and market research; 2) design; 3) facility management; and 4) technical consulting. The study should provide a comprehensive analysis of the strategic issues for each of the selected service sectors and explore strategies to respond to the challenges. We make policy recommendations both for the individual sectors and across sectors.
Key issues
The vast majority of enterprises in business services are SMEs, with strong emphasis on the micro and small enterprise segments. The medium sized category is underrepresented in the business services sector. Productivity performance of business services over time is lagging behind compared to manufacturing. This malfunctioning of business service sectors may also affect the performance of downstream sectors, as the importance of business services in value chains of manufacturing and service industries has grown rapidly since the last decade of the previous century. The increased demand for specialized knowledge inputs in manufacturing, combined with outsourcing of parts of these services, implies that performance of manufacturing and service industries in the EU have become more interdependent. About 12% of intermediate consumption in manufacturing is accounted for by business services.
Three forms of interactions with downstream sectors are of particular importance: (1) outsourcing, (2) co-production, and (3) knowledge spill-overs. These interactions can co-exist, and are not mutually exclusive. With regard to outsourcing it is important to distinguish between two very different types of outsourcing: outsourcing of low-skilled activities versus outsourcing of high-skilled activities. Outsourcing of the first type of activities is driven almost exclusively by cost
considerations, whereas outsourcing of high-skilled activities is often influenced by skills considerations as well. In knowledge intensive sectors companies tend to outsource those specialised (and often complex in nature) services for which they lack the required expertise in-house or for which no full time position within the company can be created.
The production of services often requires interaction between client and provider. This is referred to as co-production. Hence, service providers need clients with sufficient “absorptive capacity”
8 Study on business-related services
(knowledge, capacity and dedicated resources and effort) to be productive and provide effective services. Clients need to find service providers that will be willing and able to engage in effective co-production.
Knowledge spill-overs yield economic benefits for client firms of business service sectors. Particularly for knowledge intensive and creative services, co-production of service solutions by service provider and client involves knowledge transfers. This can lead to innovation in client sectors.
We summarise in this main report our findings from the four in-depth sector studies on advertising and market research, design, facility management and technical consulting and provide a synthesis of these sectors in terms of their strengths, weaknesses, opportunities and threats (SWOT). Common strengths of the business service sectors is that they have been able to effectively respond to their clients’ needs. Increased multidisciplinarity in their service provision allows business service providers to interact with the client at multiple stages of the value chain. Business service firms often play a role in their clients’ innovation.
The market structure, and in particular the “missing middle”, is considered a weakness of the business service sector. For a variety of reasons, micro and small companies show limited growth. At the same time, there is increased consolidation, concentration and scale enlargement, which discourages competition. Some services are particularly vulnerable to business cycle fluctuations. A number of developments provide opportunities for business service sectors. The economic downturn may cause clients to seek cost savings from outsourcing of certain services, and especially in the New Member States there seems to be scope for further expansion due to this outsourcing. Technological developments, further uptake of ICT and social media, and the shift to more sustainable modes of production opens new markets and creates opportunities for innovative firms.
Threats, or better called challenges, mainly refer to the hard economic situation, which makes it for example more difficult to get access to finance, which is needed to be able to innovate. Some business service sectors are affected by the fact that the European industrial base is declining, and production activities are relocated outside Europe. Especially in engineering consulting, skill shortages are creating bottlenecks to the expansion of business activities.
Market failures in business service sectors
Next we address the issues identified in the sector studies in more detail to investigate whether certain issues are related to market failure, as market failure can provide a reason for government policy intervention. In particular we look at: (1) market structure, (2) asymmetric information, and (3) spill-overs.
Regarding market structure, we find that all four business service sectors show a prevalence of micro and small enterprises, including a large number of self-employed, and a limited number of large players. On the one hand it can be argued that such a market structure is the outcome of market segmentation, in the sense that the small and large companies serve different markets and do not directly compete with each other, and related transaction costs. On the other hand, this phenomenon of the missing middle may be worrying, as recent research provides indications that small companies in business services witness lower productivity performance. Market failures related to imperfect information and the specific characteristics of business services as experience
goods may prevent small companies from growing to medium-sized and large companies. Market segmentation could diminish when small and large companies would work together more
intensively. This improves access to larger markets for small firms.
Asymmetric information on the value of the delivered service can make clients hesitant to buy these services from business service sectors. This has to do with the experience good character
mentioned earlier (the value of the service becomes known only after delivery to the client), but also with the complex nature of the service which require a certain in-house knowledge base in the client company in order to be able to effectively engage in co-production of the requested service. Thirdly, knowledge intensive business services contribute to the innovation potential of their clients and the exchange of knowledge often takes place beyond the usual market transactions and can thus be labelled as knowledge spill-overs. The “owner” of the knowledge cannot appropriate the full benefits of his or her investment to acquire or develop the knowledge, which may lead to under-investment in innovation from a social viewpoint. This introduces the issue of intellectual property rights, and how these rights should be protected by the business service providers. We notice that the IPR issue becomes particularly complex in environments where production of the service is the outcome of complex interactions between multiple actors (co-production with the client, cooperation with academic partners, insights from other disciplines etc.).
Policy recommendations
The policy recommendations in our study follow naturally from our observations regarding market failures.
Information asymmetry in the interaction with the client can, in principle, be reduced by using standards. Such standards in business services are typically more oriented towards process (e.g. ISO standards regarding process quality in market research) and input (such as minimum standards on labour qualifications of staff), as outputs are mostly intangible and often tailor-made. Next to standards there are other avenues to reduce information asymmetry and increase transparency in business services, for example websites with client rating of services.
Innovation in business services can be promoted along various lines, including through supplying labour with the right skills (certainly in the area of science, mathematic and technological skills), fostering science-industry collaborations, providing the right incentive structures for cooperation with third parties, and promoting innovative solutions in procurement.
Addressing entry and exit barriers will help micro and small companies in their development to medium-sized and large companies. Implementation of the Small Business Act principles will help to address some of the entry or further growth barriers of small companies. Another factor that may foster growth is to increase awareness in client sectors of the added value and innovation business services can bring. One reason why client firms may undervalue business services is lack of absorptive capacity.
1 Introduction
Background
Over the last few decades, the EU has become a “service economy” as service sectors have grown faster than manufacturing sectors, and services now account for some 70 percent of the EU economy. This also implies that the performance of the EU economy will largely depend on the performance of the service sectors. This is not only because of the large share of services in the economy, but also because of indirect effects: many companies in the manufacturing sector rely on external services providers for both routine services and specialist expertise (business services). A better functioning of business services industries and markets would therefore also benefit other sectors and ultimately consumers. This study analyses four business to business service sectors: 1) advertising and market research; 2) design; 3) facility management; and 4) technical consulting. Objectives of the study
The study should provide a comprehensive analysis of the strategic issues for each of the selected service sectors and explore strategies to respond to the challenges. It should make policy
recommendations both for the individual sectors and across sectors. A key part of the analysis is to examine the relationship between the selected service sectors and some of the most important manufacturing client sectors, to illuminate the main issues related to outsourcing, market fragmentation, internationalisation and innovation in business related services.
Structure of the report
This report is structured as follows. Chapter 2 looks in more detail at the role of the services sectors in the EU economy and explores some of the key issues. This sets the stage for the remainder of the report. Chapter 3 to 6 summarise the main findings for the selected services sectors:
advertising and market research (Chapter 3); design (Chapter 4); facility management (Chapter 5); and technical consulting (Chapter 6). Chapter 7 presents the strategic outlook for the sectors and analyses their strengths, weakness, opportunities and threats (SWOT). Chapter 8 identifies and describes several market failures prevalent in the selected sectors. Finally, Chapter 9 concludes with policy recommendations.
2 Services in the EU economy: some key issues
In the previous chapter we mentioned the importance of the services sectors in the EU economy. In this chapter we elaborate on the role of business services in the EU economy, and we sketch the key issues that will be discussed in greater detail in the remainder of the report.
2.1 Business services in the EU economy: overview of the sector
Industry definitionBusiness services consist of a range of professional services and support services. This includes knowledge-intensive and creative professional services (such as management consultancy, design activities, marketing services and architectural and engineering services) and IT services, but also labour recruitment services and support services such as security services and industrial cleaning activities. To demarcate the activities classified as business services, we start from an operational definition of business services provided by Eurostat as consisting of the activities in NACE revision 1.1 Divisions 72 and 74.1 We will make use of the most recent data for the industry overview, based on NACE revision 2 classification where possible. The correspondence of these two NACE
classifications unavoidably leads to some small differences in the operational demarcation of industries in the business services sector, but we stay as close as possible to the demarcation above and include all industries that fall within our definition as far as data are available.
Industry overview
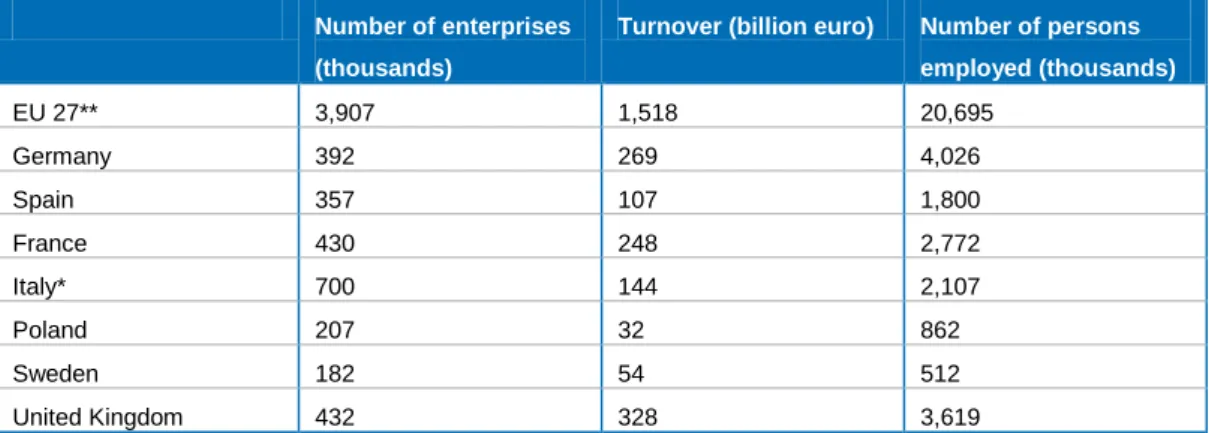
The business service sector currently accounts for almost 1,500 billion euro turnover and 21 million people are directly employed in the sector at a total of almost 4 million enterprises (see table 2.1 below). Firms from the UK, Germany and France together account for about 56% of total EU turnover in the sector. Average firm size in terms of persons employed in Sweden, Italy and (to a lesser extent) Poland and Spain is smaller than in these three countries. Turnover per person employed is lower in Poland, compared to other countries reported in the table.
Table 2.1 Business services: number of enterprises, turnover and number of persons employed (2010)
Number of enterprises (thousands)
Turnover (billion euro) Number of persons employed (thousands) EU 27** 3,907 1,518 20,695 Germany 392 269 4,026 Spain 357 107 1,800 France 430 248 2,772 Italy* 700 144 2,107 Poland 207 32 862 Sweden 182 54 512 United Kingdom 432 328 3,619
Notes: Business services are defined closely following the operational definition of Eurostat and Kox (2012), as far as NACE rev. 2 correspondence and data availability allow. The activities of head offices are excluded. * Data for Italy are for 2009. ** Data for investigation activities for EU27 is for 2008. Source: Eurostat SBS.
1
See e.g. http://epp.eurostat.ec.europa.eu/portal/page/portal/european_business/special_sbs_topics/business_services and Chapter 25 of Eurostat (2009) European business — Facts and figures. The business services sector includes among others the five industries that have been selected for detailed sector studies (see section 2.5): private security, industrial cleaning, design services, technical consulting, and advertising and market research. Design activities are somewhat hidden in the NACE revision 1.1 class 74.87 Other business activities n.e.c.
14 Study on business-related services
Table 2.2 reveals that the vast majority of the firms in business services are micro-enterprises (between 1 and 9 persons employed).2 Comparing the patterns for business services to the overall pattern for the non-financial business economy at the EU level, the category of micro enterprises is overrepresented in the share of firms. Small- and medium sized firms are underrepresented in the business services sector. The share of medium and large-sized firms in terms of turnover is a bit lower than in the overall business economy. Comparing the patterns for turnover and employment between and within these two broad economic sectors leads to some tentative conclusions on productivity. First, micro-firms in business services appear relatively more productive compared to larger firms in business services than in the overall business economy. Medium and large firms appear relatively more productive on average in the business economy compared to their position in business services. Second, SME firms appear to be more productive than large enterprise in the business services sector. No clear disadvantage for micro-sized firms appears from these
aggregate figures. This is in contrast to detailed econometric evidence from the literature based on a more sophisticated productivity measure and on firm-level micro-data for disaggregated business services, which we will discuss in section 2.2.
Table 2.3 shows for a selection of EU Member States that the vast majority of enterprises in business services is SME, with strong emphasis on the micro and small enterprise segments though patterns vary within these segments between Member States. Only Germany and the UK show a relatively larger share of medium sized firms. Large enterprises are a comparable fraction of the sector across the EU, albeit a bit larger in Germany.
Table 2.2 EU-27 – Business services and Non-financial business economy: number of enterprises, turnover and number of persons employed by employment size class (% of total)
Number of enterprises Turnover Persons employed
Size class 1-9 10-49 50-249 250+ 1-9 10-49 50-249 250+ 1-9 10-49 50-249 250+ Business services Business services Business services EU-27 94.2 4.6 0.8 0.2 29.6 19.7 17.7 33.0 28.7 16.1 17.1 38.1
Business economy Business economy Business economy
EU-27 91.8 6.9 1.1 0.2 18.8 19.2 19.5 42.5 29.6 20.6 16.8 32.9 Note: Data for non-financial business economy: 2005. This aggregate consists of manufacturing and service sectors in the private sector, except financial and insurance services. Data for business services: most recent year (2010, or 2009 if latest available). Business services are defined closely following the operational definition of Eurostat and Kox (2012), as far as NACE rev. 2 correspondence and data availability allow. Source: Eurostat SBS
2
See the Eurostat definitions of SME and constituent firm size classes at http://ec.europa.eu/enterprise/policies/sme/facts-figures-analysis/sme-definition/index_en.htm.
Table 2.3 Business services: number of enterprises, turnover and number of persons employed by employment size class (2010; % of total).
Number of enterprises Turnover Number of persons employed
Size class 1 2-9 10-19 20- 49 50-249 250 + 1 2-9 10-19 20- 49 50-249 250 + 1 2-9 10-19 20- 49 50-249 250 + EU 27 69.8% 24.5% 3.1% 1.4% 0.8% 0.2% 11.9% 17.7% 8.7% 11.0% 17.7% 33.0% 12.1% 16.6% 7.2% 8.9% 17.1% 38.1% Germany 41.6% 44.9% 7.5% 3.6% 2.0% 0.5% 5.3% 17.0% 10.2% 12.9% 19.5% 35.0% 4.0% 16.5% 8.9% 10.3% 20.5% 39.9% Spain* 66.4% 27.9% 3.6% 1.2% 0.7% 0.2% 9.0% 18.3% 8.8% 9.3% 18.5% 36.1% 13.0% 19.3% 6.9% 7.5% 13.4% 40.0% France 80.7% 13.7% 3.2% 1.5% 0.7% 0.1% 15.9% 16.7% 8.0% 10.8% 15.0% 33.2% 10.4% 15.7% 8.4% 9.2% 13.6% 42.9% Italy** 78.4% 18.9% 1.7% 0.6% 0.3% 0.1% 15.2% 25.3% 8.1% 8.2% 14.4% 28.8% 26.6% 21.2% 5.8% 5.9% 11.4% 29.1% Poland 71.2% 25.6% 1.6% 0.8% 0.5% 0.2% 19.0% 23.1% 5.6% 9.4% 21.3% 21.6% 18.9% 23.5% 4.3% 5.6% 13.4% 34.2% Sweden 83.3% 13.7% 1.6% 0.9% 0.4% 0.1% 14.2% 16.7% 9.6% 12.1% 18.0% 31.5% 10.8% 18.2% 8.0% 11.4% 17.5% 34.1% UK 53.8% 38.2% 4.2% 2.2% 1.4% 0.3% 7.7% 15.8% 8.1% 10.3% 18.4% 39.7% 6.1% 14.4% 6.9% 9.9% 18.3% 44.4%
Notes: Business services are defined closely following the operational definition of Eurostat and Kox (2012), as far as NACE rev. 2 correspondence and data availability allow; * Data for Spain for management consultancy was interpolated as average. ** Data for Italy are for 2009. Information service activities and activities of head offices are excluded. Data for France, Poland, Sweden, UK, EU27 is for 2009 if data for 2010 was not available. Source: Eurostat SBS.
Productivity performance of the business services sector over time remains a little behind compared to the manufacturing sector. The table 2.4 below shows average productivity growth between 2003 and 2010 in selected business service industries. The sectors in the table formed the focus for sector-specific analysis in this study.3
Table 2.4 Wage adjusted labour productivity: average annual growth rates 2003-2010 (%).
country/sector Manufacturing Advertising
Market research Engineering activities Private security Cleaning services EU 27 0.64 -0.58 -0.24 -0.09 -0.15 0.33 Germany 1.39 -0.88 -0.02 0.23 0.26 0.93 Spain -0.56 -0.93 -1.20 -2.24 -0.28 -0.02 France 0.92 1.92 -0.63 0.08 0.44 -0.21 Italy -2.00 -5.69 0.71 -0.15 -0.18 -0.28 Poland -1.64 8.46 1.83 3.73 0.26 3.14 Sweden 0.95 3.26 3.67 2.48 0.13 -1.07 United Kingdom 2.44 -0.30 5.54 0.06 -0.90 0.17
Note: Average annual growth rate computed as arithmetic average of year-to-year growth rates. Source: Eurostat SBS.
Figure 2.1 Index of wage adjusted labour productivity by sector: EU-27 (2003 = 100)
Note: EU-27 represents the aggregate group of the 27 countries that form the EU as of 2007. For earlier years, some of these countries were not members of the EU. Source: Eurostat SBS.
Figure 2.1 above presents an overview of the development of labour productivity in the selected business service sectors (design services are not included due to lack of data over time) at the EU-27 level, compared to the manufacturing sector. The overall picture of stagnating productivity growth at the EU level is confirmed. Productivity appears to be pro-cyclical over the recent
economic crisis (though with a delay for engineering services). From 2003 onwards, the data do not provide strong evidence for a relative stagnation of the service industries compared to the
manufacturing sector.4 Volatility of labour productivity, at least at the level of individual industries,
3
Design services are also one of the business related (sub)-sectors included in this study. Due to lack of data over time, this sector is not reported in the table on productivity.
4
In the next section of this report, we discuss evidence that productivity growth in business services is lower than for the rest of the economy in the EU, partly explaining the productivity (growth) gap between the EU and the U.S. economy. This evidence is based on trends over a longer time series and a different measure of productivity, total factor productivity. This productivity measure, unlike our measure of labour productivity, is not affected by changes over time in capita-labour ratios and relative wages, which may lead to somewhat different conclusions.
70 75 80 85 90 95 100 105 110 115 120 2003 2004 2005 2006 2007 2008 2009 2010 Advertising Architectural and engineering activities Private security Cleaning services Manufacturing Market research
18 Study on business-related services
exceeds the small difference in trend growth rates reported in Table xx. The advertising sector appears to fall behind over the last three years reported for which data are available, but shows recovery in line with manufacturing in 2010.
Importance of business services in the sector structure of the EU economy
The importance of business services in value chains of manufacturing and service industries has grown rapidly since the last decade of the previous century. Growth of employment in Europe illustrates this. The business service sector accounts for about half of this growth (Kox and Rubalcaba, 2007). The increased demand for specialized knowledge inputs in manufacturing, combined with outsourcing of parts of these services, implies that competitiveness performance of manufacturing and service industries in the EU have become more interdependent.
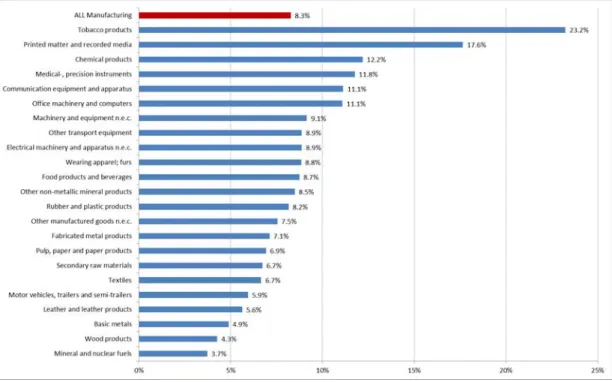
The interdependence is illustrated in figure 2.2 below, showing the percentage share of business services in total expenditure on intermediate inputs by selected manufacturing industries. Business services are defined as before, consisting of NACE Division 72 (Computer and related activities) and Division 74 (Other business activities).
Figure 2.2 Share of business services in intermediate input value for selected manufacturing sectors.
Source: Eurostat; Harmonized EU-27 Input-Output table for 2007. Selection of manufacturing industries based on NACE classification (rev. 1.1): divisions 15-37.
On average, 8.3% of intermediate consumption in manufacturing is accounted for by business services. Some sectors producing equipment and the chemicals sector show higher business service intensity. Printed and recorded media and tobacco products use business services most intensively in their intermediate consumption.
Within business services, the sector “other business services” accounts for the largest share of intermediate consumption by manufacturing (figure 2.3). Other business services mostly refer to professional service activities (NACE revision 1.1 Division 74). As noted before, this sector includes knowledge-intensive services such as management consultancy, professional training, market research, and technical and engineering services. Also included are creative industries such as advertising services and specialized design services, and the operational services industrial cleaning and security services.
Figure 2.3 Two main groups of business services in intermediate input value for selected manufacturing sectors (million euro)
Source: Eurostat; Harmonized EU-27 Input-Output table for 2007. Selection of manufacturing industries based on NACE classification (rev. 1.1): divisions 15-37.
2.2 Productivity in business services
The business services sector has grown over the past few decades in terms of output and employment and provides a larger share of intermediate inputs than before. However, productivity growth in the sector is lower than the economy wide average in the EU, and has stagnated relative to the U.S. over the past two decades. Evidence suggests that the level of productivity in business services is substantially below that of the U.S. (see e.g. Inklaar et al. 2008; Kox 2012). The relative performance of business services appears to be particularly relevant for a number of empirical results on productivity performance in market services and downstream client industries that emerge from recent research:
• Productivity growth in market services in continental Europe lags behind U.S. growth rates that have recently accelerated;
• Lagging productivity performance in EU services seems to reflect the relative absence of catching up and a lack of innovation;
• Lagging productivity performance in services contributes largely to explain the widening productivity gap at the macroeconomic level, among other things by impeding productivity growth in ICT-using sectors that make relatively intense use of intermediate services.
A substantial body of recent academic literature has linked the lagging productivity performance in market services sectors (such as retail, transport, post and telecommunications, financial services and business services) to the macroeconomic productivity gap between the EU and the U.S. and its recent apparent widening.5 This reflects a direct effect on productivity, as business services
5
Many of the recent studies make use of the recently developed EU KLEMS database that allows analysis and decomposition of productivity levels and growth in a variety of service and manufacturing sectors for a set of OECD countries.
20 Study on business-related services
account for a substantial share of value added in the EU, and the indirect effects of business related services on productivity in downstream sectors (see Camacho and Rodriguez 2007). Triplett and Bosworth (2006) report that labour productivity growth rates in most market services have accelerated in the U.S. since the mid-1990s, whereas a similar pattern is not found for continental Europe. Timmer et al. (2011) report that most of the difference in labour productivity growth in services between the EU and the U.S. can be attributed to the performance of distribution services (retail and wholesale, and transport services) and business services.
Labour productivity growth can be related to capital deepening (e.g. using more ICT and non-ICT capital goods or human capital per hour worked) and to technological progress (increasing the productive efficiency of combining production factors to produce output). Technological progress here needs to be interpreted broadly to include all ‘hard’ and ‘soft’ factors that can increase efficiency (innovation induced by technical or scientific R&D, changes in the organizational structure, management and work practices). The impact of technological progress on productivity growth is reflected in the literature by the development of multifactor productivity (MFP). Timmer et al. (2010) find that lagging MFP growth is the main source of the difference in labour productivity growth in business services, financial services and distribution services between the U.S. and the EU. Two mechanisms of MFP growth are potentially relevant. First, technological progress can be absorbed by imitation, leading to catch-up to the frontier of innovation. Second, innovation of products, production process and organization can spur productivity growth. The latter form of technological progress becomes more important once an industry or firm is closer to the technology state of the art.
For some services, such as retail trade, transport and financial intermediation, the EU countries do not lag far behind the U.S. in terms of MFP, or even exceed U.S. MFP. For business services, however, there is a clear gap between the EU and the U.S. leading technology position. While other Anglo-Saxon economies such as the UK, Canada and Australia, show clear catch-up growth in MFP relative to the U.S., the (continental) EU countries do not make use of this catch-up potential (see Inklaar et al. 2007). As growth in other services sectors also lags behind, the EU appears to experience problems to realize productivity growth both via catching-up and innovation in services sectors.
Recent literature points at the likely importance of anticompetitive (i.e. restrictive) regulation and the advent of ICT in a context of deepening globalization to explain the variation in growth performance. Restrictive regulation refers to mostly national regulation that restricts domestic competition and market selection processes and hampers the operation of the Internal Market for services. This varies from direct government involvement in business operation, administrative burdens on start-ups and bankruptcy, legal barriers, antitrust exemptions, labour contract regulations (see Kox, 2012), to required professional qualification of personnel, regulation on legal form and capital ownership of the service provider (European Commission 2011, 2012)6.
Direct impacts of capital deepening (in recent years particularly related to ICT capital goods such as software, computers and communication equipment) and education of the workforce do not suffice to explain the difference in MFP growth (e.g. see Inklaar et al. 2008). Yet, the successful
incorporation of ICT in production processes via a combination of organizational change and “hard” technological change is an important source for productivity growth. The importance of ICT uptake holds for both catch-up growth (see Conway et al. 2006) and for innovation processes (e.g. Arnold
6
European Commission (2011), Towards a better functioning Single Market for services – building on the results of the mutual evaluation process of the Services Directive, COM(2011)20 27 January 2011, Brussels; and, European
Commission (2012) The economic impact of the Services Directive: A first assessment following implementation, Note for the Economic Policy Committee, DG ECFIN (section Product Market Reforms), Ares(2012)504112, Brussels, as referred to in Kox (2012).
et al. 2008, 2011), and most for relatively intensive ICT-using industries and services. Restrictive regulation, particularly in intermediate services sectors, raises the cost of doing business and hampers productivity performance both in the services sectors and – e.g. via the input-output linkages discussed in the previous sub-section – in downstream (manufacturing) sectors. Conway et al. (2006) show that weak competition and regulatory burdens reduce productivity growth particularly for countries and sectors that start with relatively low productivity levels and mostly so for sectors that are ICT-using. Barone and Cingano (2011) show that the impact of services regulation on productivity performance is mostly related to regulation in the energy and business services sectors.
Arnold et al. (2008) provide evidence that, at the level of individual firms within a sector, restrictive regulation affects primarily the most efficient firms in ICT-using sectors, thus obstructing the diffusion of technology. They reveal that more restrictive regulation of services distorts the
allocation of resources towards firms with the highest growth potential and that would be most likely to increase domestic technological standards. Bourlès et al. (2010) stress that restrictive regulation of upstream services reduces access to downward markets (particularly when service inputs are needed that are more difficult to obtain on international markets). Moreover, market power of service providers reduces the incentive for efficiency improvement in client sectors because the profits generated will more likely be partly appropriated by higher prices charged by intermediate service providers.
The evidence reported above points at the importance of regulatory conditions and import competition for effective competition and productivity growth in business services, with potentially large implications for economy-wide productivity performance. Recent research by Kox and Van Leeuwen (2012) suggests that the productivity difference between the U.S. and the EU can be traced to the persistence of two types of inefficiencies in the EU business services sector. First, small and very large firms have lower scale efficiency compared to the optimal firm size in the sector. Small firms suffer from high average fixed costs and low specialization due to the scale of output volumes at which they operate. Empirical evidence confirms and shows that scale efficiency increases along with the size of firm, but reaches an optimum; for very large firms, internal
transaction costs increase and compensate the decline in average fixed costs. Second, within size classes large differences in production efficiency exist, implying that many firms operate at lower efficiency than the technology frontier in their size class. This form of inefficiency is known under the heading X-inefficiency.
Kox (2012) argues that the persistence of scale inefficiency and X-inefficiency implies that dynamic market selection does not function properly. During their life cycle, successful small firms would expand and grow to benefit from economies of scale. Firms that are too large, would be forced to rationalize and reduce their size and market share. Firms that operate below the technology frontier would not be able to cope with competition and suffer from low profitability. In the EU, however, the size class with lowest overall efficiency, the very small firms, represent the vast majority (93%, Kox 2012) of firms in business services. Overall efficiency in the EU business service sectors has stagnated since the late 1990s, as well as average efficiency in most EU countries. This suggests that market segmentation, related to search costs, and lack of transparency of services markets obstructs competitive selection. Large and small firms may serve different markets and competition within the market served by smaller firms may be mostly local. Medium sized firms appear to have the highest overall efficiency, but most small firms do not seem to manage to grow to the medium range. Large firms appear to have a stable position, possibly related to market power. The medium size range, though most sustainable on the basis of market selection, is smaller than expected. This mystery of the missing middle may have important implications for competitiveness of EU business services and their client sectors. As noted by Canoy and Smith (2008, p. 324), the way
22 Study on business-related services
that anticompetitive regulation combines with the specific characteristics of individual service markets “determines to a large extent the economic performance of services”. While, the spectrum between goods and services is gradual and some of their characteristics are becoming more shared, (business) services tend to be more intensely related to issues like asymmetric information and co-production. It is to these characteristics of services and the interaction with client sectors that we turn next.
2.3 Interaction with downstream sectors
Service and manufacturing industries have become more and more interlinked. This party reflects changes in economic structure due to (technology enabled) outsourcing of business services and partly an increased demand for specialized knowledge inputs. Competitiveness of downstream sectors (manufacturing and services) depends on access to a wide variety of well performing business related services (see, e.g., Camacho and Rodriguez, 2007).
Performance and effectiveness of these services relies on organization structure (decision to provide in-house or outsource the services), client and service provider capacities to interact in co-production of business related services, and the implications for knowledge creation and spill-overs in service-client interaction. The relevance and implications of these three forms of interrelations in the value chain are briefly discussed below in more detail. Outsourcing partly explains the high growth of employment and value added in business services over the recent past. Co-production emphasizes the important role of business services as inputs that are closely related to core business processes of clients, such as product development and innovation. Knowledge transfer and spill-overs are important channels for creating value added in the supply chain.
Outsourcing
The main driver of outsourcing activities is cost reduction. Companies with a high-skilled workforce are more likely to outsource low-skilled, labour-intensive services like cleaning. Other factors that are positively related to outsourcing include:
• Size of the company: the larger the company and thus the more complex the internal organisation, the more the company will choose to externalise activities;
• High significance of geographical proximity: in sectors where geographical proximity is important (e.g. courier, security), the presence of good local service providers in the region increases outsourcing;
• Preferences of manufacturing companies for flexibility.
Access to a labour force at a global scale favours outsourcing and offshoring activities to countries with low labour cost (for example low-skilled operational services, call centres) for both high-skilled and low-skilled service sectors. Furthermore, globalization of activities through e.g. outsourcing of activities leads to increased diversity of services, like provision of services at 7/7 and 24/24 basis (Ecorys et al. 2008).
It is important to distinguish between two very different types of outsourcing: outsourcing of low-skilled activities versus outsourcing of high-low-skilled activities. Outsourcing of the first type of activities is driven almost exclusively by cost considerations, whereas outsourcing of high-skilled activities often is influenced by skills considerations as well.
In knowledge intensive sectors companies tend to outsource those specialized (and often complex in nature) services for which they lack the required expertise in-house. Kox and Rubalcaba (2007) found that in the mid-1990s business service sectors that produce very specialized services have
gained most from outsourcing activities. This has happened because the very specific activities and the high quality of knowledge needed for the production are the main reasons why client sectors have chosen to outsource these activities. Although relative wages seem to be a less important driver for outsourcing of this type of activities, Merino and Rodriguez (2007) point out that the high wage costs of skilled workers imply that outsourcing the activities instead of in-house production might be more profitable from a cost perspective.
As a countervailing force, manufacturing firms have become more service oriented as well due to increased demand for customization by their clients. Before and after sale services are increasingly important for competitiveness. This implies that service activities that are close to the core
production process are more likely to remain largely in-house, apart from those services that require highly specialized knowledge (as mentioned before).
Co-production
Many services, in order to be produced, require interaction between client and provider. Consumption and production processes may coincide (e.g., health or transport services). Production of other services such as cleaning services requires access to the premises of the client. Also for business related services, customer-provider interaction is often a vital element for the productivity of the service provision and for the service to have the intended impact on client performance (see Ecorys et al. 2008). The various forms of interaction needed for services to be effectively provided are grouped under the heading ”co-production of services”.
Following studies by Bitner et al. (1997), Bettencourt et al. (2002), and Kuusisto (2008), a typology of co-production is presented in the 2008 study by the Ecorys led consortium. Services that deal with more peripheral business processes and that require little client participation, tend to be more standardized products and can be provided independent of the consumer (such as uniform cleaning services). These services still need the client to give property access to the service provider. Services for which customer input (information, materials) is necessary for effective provision but that are still provided mainly by the service firm usually require moderate interaction. Here, the customer could be seen as co-performing the service as it is involved in some supporting tasks. Examples are freight transport, engineering services and advertising campaigns. These services can be highly specialized (engineering) or more standardized (transport). When
interactions between client and service staff are more prominent in the creation of the service, high participation is needed. These services tend to be the most customized and are provided via co-creation or involve co-designing the division of labour (where the client performs some of the supporting and essential service tasks. Examples include marketing campaigns, design services and management consulting. Highly knowledge-intensive or creative services tend to be more customized and more interaction intensive.
The importance of co-production has potentially large implications for the structure of business service markets, service procurement and the process of innovation in services and client products. Both service providers and clients derive competitive advantage from selecting partners that match well. Hence, management of co-production is important for both client and provider. Service providers need clients with sufficient “absorptive capacity” (knowledge, capacity and dedicated resources and effort) to be productive and provide effective services. Clients need to find service providers that will be willing and able to engage in effective co-production. Both sides in the service transaction need to deal with information asymmetries and transaction costs. Client and service providers need to be competent and have specific knowledge, and the lack of transparency of this search-and-match process tend to increase market segmentation in business related services (see, e.g., Kox, 2012).
24 Study on business-related services
Solutions to select and manage co-production do not always match (see for example Bettencourt et al. 2002 and Geis 2007); clients may favour competition among providers via framework contract procurement; providers may favour partnership-building to ensure commitment. Yet, reputation signalling and reputation building mechanisms are important for both sides.
Knowledge spill-overs
Co-production linkages between business related services and client industries are important channels for knowledge transfer. Knowledge intensive and creative business related services contribute to the innovation process of their clients. Nesta (2008), for example, finds that stronger business-to-business linkages with creative industries complement stronger innovation
performance of client firms7. Nesta (2010) shows that highly innovative sectors and activities such as R&D services generate spill-overs to other sectors in the economy. Spill-overs result in economic benefits for other firms while the innovative firm is not able to capture the reward for these benefits.
Particularly for knowledge intensive and creative services, co-production of service solutions by service provider and client involves knowledge transfers. This can lead to innovation in client sectors. Moreover, spill-overs can occur from scale advantages realized by outsourcing and specialization in business related services. Camacho and Rodriguez (2007) show that intermediate use of business related services is an important source of knowledge diffusion and productivity for their client sectors across the economy.
The impact of business services on innovation processes of purchasing firms can be direct. For example, design services and engineering services are used in the process of innovation and advertising agencies offer specialized services in the development of a marketing campaign for new products. The knowledge created in these processes of co-production directly benefits the client in its innovation process. However, not all aspects of this knowledge can be codified and protected. Part of the knowledge, co-produced in innovation, adds to the pool of experience of client and service provider that can be used in subsequent service transactions, potentially with a different client or provider. Knowledge spill-overs outside the service transaction and innovation processes that generated the knowledge are generally not compensated for. This provides a rationale for policy intervention.
2.4 Information asymmetry and the role of standards
Information asymmetry refers to the situation when one party has more or better information than the other. The quality of business services depends on many factors that are difficult to observe or assess before a transaction takes place. Information asymmetry is the reality concerning the capabilities of service providers for a specific assignment and the capacity of clients to absorb the service. Markets for business services, particularly for more specialized and customized knowledge intensive and creative services, are not transparent (see Kox and Rubalcaba 2007).
As intangible products that require some degree of client participation in co-production, services are “experience products” and a successful match requires a search for investments from both client and provider. Signals that can indicate quality are important in order to reduce uncertainty in service transactions. Standardization of services – resulting in certification (professional qualifications or association membership), and reputation building (conveyed in project references and long-term network relations) can provide signals to help clients to assess the expected match with service providers (Ecorys et al. 2008). Services that need less intense client participation (e.g. cleaning) are
7
more likely candidates for process standardization. However, more knowledge intensive services also offer a perspective for standardization, when essential parts of the process can be codified into norms of conduct and procedures (e.g., market research). However, even if standardization of (parts of the) production process or service is possible, reputation is an important asset for signalling the quality of the service. The two approaches can be pursued separately, depending on the context, but may also reinforce each other. Certificates of compliance, and industry self-regulation and conformity assessment may reinforce reputation and can be sought after for this purpose.
Traditionally, services were believed to be only domestically consumed involving face-to-face interaction between consumer and producer (restaurant or haircut services, see Baumol, 1967). Technological changes altered also the service world. As a result, services acquired the characteristics of goods and have become increasingly tradable (Bhagwati, 1984). Growing importance of services in GDP and their increased tradability have triggered research on various aspects of services. More recently, this includes the service standardization process.
Service standardization occurs at national, European and international levels. Standardization bodies such as the Netherlands Standardization Institute (NEN) and the German Institute for Standardization (DIN) are the institutions responsible at the national level. At the European level, organizations like the European Committee for Standardisation (CEN) have been established. Correspondingly, the international standards organisations such as the International Organization for Standardization (ISO), and International Electrotechnical Commission (IEC) serve at the international level.
Standardization of services guarantees that they adhere to the same set of design standards. It facilitates the functioning of the single market in the EU by protecting consumers and environment, fostering competitiveness and the innovation process, according to the Annual European
standardisation work programme 2012. Moreover, standardization opens the market to small and medium sized enterprises (SME) which account for almost 99% of all enterprises in Europe. Still, the evidence suggests that large companies are more likely to be involved in the process of standardisation due to high costs of implementation (Blind and Hipp, 2003).
Current status of standards development
Service standards have developed more slowly than standards for goods. In the year 2000, services accounted for around 5% of all European standards (Blind, 2006), while the services sector generates about 70% of total value added in the European Union. Lissaur (2008) indicates that service standards are focused more on the process than on the product. Moreover, service standards are dispersed. The most common areas for existing service sector standards are: quality assurance, environmental and safety management, working conditions, education, ethical
standards, contractual standards, complaints handling and price regulations.
The Services Directive (2006/123) was adopted in 2006 to simplify procedures and formalities for service providers when establishing a local presence in another EU country or supplying services across borders within the EU. In this context, accompanying measures at the level of Member States, in co-operation with the Commission, were envisaged to ensure high quality of services throughout the EU. One such important measure was the development of voluntary European standards for services.
A number of sectors are not covered by the Services Directive including financial services, electronic communications services, most transport services, health care, temporary work
26 Study on business-related services
agencies, private security services, audio-visual services, gambling, certain social services provided by the state, and services provided by notaries and bailiffs.
The role of service standards
Standardization benefits the service providers and their customers on macro and micro level (Blind and Jungmittag, 2008; Jungmittag et al., 1999, Swann, 2010). In particular, minimum quality and safety standards reduce transaction costs especially on markets for complex, innovative services. Standards also foster the development of new markets and high quality segments of existing markets, enhancing economic growth. They restrict negative externalities that influence health and environment. Though standards might reduce the variety of services provided, this allows the exploitation of economies of scale (Dixit, Stiglitz, 1977). Ritzer (1993) indicates that standardization results not only in economies of scale but also higher productivity. Taking McDonalds as an example, customers gain from lower prices due to standardisation though suffer from limited choice. On the downside, standardisation might strengthen the position of incumbents, restricting competition by raising rivals’ costs. Standardization is usually an outcome of consensus of all interested parties representing mostly multinational enterprises. Thus, the standards of dominant players may prevent newcomers from obtaining access to the market and also restrict the innovation process.
In addition, standardization offers knowledge diffusion and promotes trade. In order to innovate successfully a firm should be actively involved in R&D activities or in the transfer of technology as a substitute to R&D activities (e.g. Love and Roper, 1999). Therefore, innovative companies use standardization more often. Blind (2002) found confirmation that innovative firms (R&D sectors) use standardization more often. However, when the share of R&D activities within the company reaches a certain point, he finds that it is less willing to participate in standardization (Blind, 2006).
Information and communication technologies are important for innovation in many business related service industries (see Barcet, 2010). Therefore, standardization of ICT tools will enhance
innovative activities in these services.
Blind (2002) determined that export-oriented companies are more likely to join standardization processes. In addition, the company’s size also determines the involvement in the standardization process since absorptive capacity is required to participate in the process (Blind, 2006; Blind and Hipp, 2003). Export-intensive companies generate higher output of standards since they use standardization to avoid heterogeneity and information asymmetries (Blind, 2002). A number of studies proposed that market concentration can also be an explanatory factor for the
standardization process. The results of the study by Blind (2002) suggests that there is an inverse U-shaped pattern that describes the relationship between market concentration and
standardization. It is easier for fewer companies to agree upon a common standard up to the moment where just a few or even one company dominates the market.
There are a number of barriers to the development of service standardisation:
• Low awareness of the advantages of the standardization and its role leads to the fact that companies are less willing to participate in the development of service standards.
• Negative perceptions of the impact of standards (see Blind, 2009) reduces the willingness to commit to a standardization process. Service standardization may reduce choice and the incentives to innovate; it may eliminate differentiation and result in a situation with a uniform service allowing only price competition.
• The high costs of development and implementation of standards also reduces the incentive to engage in standardization. High development costs of standards will induce prices of services to rise, but it is unclear whether customers will be willing to pay more for such a service.
• If service standards are developed at the national level, the differences in standards and regulation can negatively influence standardisation at the international level.
Standardization versus customization in services
Even though the benefits of standardization are explored in the literature, companies still do not fully standardize their services. Many services are differentiated by nature. Co-production and customization often go hand-in-hand. However, based on a survey among service firms in Denmark, Sundo (2002) concludes that many services combine elements of two opposite types of services, customization and standardisation, into another type, modularity. The standard modules are produced by the service provider but the customer can combine different modules which allow a full adaptation to the needs of customers. Bettio et al. (2011) conducted an empirical study of knowledge intensive business services (KIBS) in Italy that specialised in design and
communication. The findings suggest that a large amount of services is fully customised but multiple types of services are provided, including modular services.
Hipp et al. (2000) examine the pattern of innovation that relates to standardization and
customization of services. Based on a survey on innovation in German services companies Hipp et al. (2000) derived the distribution of the firm’s income among standardised, partially customized and bespoke (fully customized) services. Wholesale and retail trade provide the most standardised services, whereas knowledge intensive business services (KIBS) provide the largest amount of partially or fully customised services. The level of service customization offered by KIBS is higher on average than in other service sectors, however, the services provided by them are not fully customized (Corrocher et al., 2009). KIBS industries have been among the most rapidly growing service sectors in the EU countries since the mid-1980s. KIBS contribute to their clients’ innovation processes, whether these are knowledge-producing or knowledge-using. Strambach (2008) suggests that standardisation and modularisation processes in knowledge intensive activities foster tradability of knowledge products and geographical dispersion in some subsectors of KIBS (e.g. the software industry).
Engineering services are essential to the productivity and sustainability of various other economic activities (Cattaneo, 2010). Quality standards in engineering, such as professional, process, and product standards determine trade opportunities. Engineering organizations invest in the development of standards influencing the competitive position of their engineering professionals. This in turn results in the mutual recognition of qualification requirements. When education for the engineering service providers is standardized, engineers can work on projects both domestically and abroad.
The studies related to the marketing services (e.g. Prahalad and Doz,1986; Kanso and Nelson, 2002; Samiee et al.; 2003; Vrontis, 2003) suggest that both customization and standardization are (simultaneously) relevant in this industry. Companies should adapt to change in a socio-economic and cultural context, but standardization of some of the service dimensions generates lower costs and improves market access.
2.5 Selection of sectors for detailed analysis
More detailed analysis of a selection of business related services sectors is a key part of this study. The Terms of Reference of this study listed five business related service sectors. During the
28 Study on business-related services
inception phase, the final choice8 was made to consider the following business related services sectors in the detailed analysis:
• Private security;
• Industrial cleaning;
• Design;
• Technical consulting;
• Advertising and market research.
These sectors are in line with various demarcations used in the literature describing business services, such as the definition we introduced in section 2.1. The list includes knowledge intensive sectors such as technical consulting and market research; creative industries such as advertising and design; and operational support services such as private security and industrial cleaning. These sectors also cover the range of client-provider participation in co-production and the relation to innovation and performance in the value chain discussed above. Moreover, the selection aligns with the evidence on value chain relations that we presented in this chapter. All five sectors are part of other business services, the professional and support services that account for the bulk of intermediate use of business services in value chains across the manufacturing sector.
Table 2.5 presents some basic statistical information on each of these business related services sectors for the EU-27. Several observations on the basis of the comparative overview in the table are listed below:
• The technical consulting sector has by far the largest turnover value, while cleaning activities is the largest sector in terms of employed persons;
• Average firm size in number of persons employed is largest in the two support service sectors, security and cleaning. Even average firm size in advertising and market research is
substantially smaller. In all selected business related service sectors, the average firm is small or even micro-level firm;
• Labour productivity, controlling for average wage levels, is highest in the advertising and market research and design sectors. This measure of productivity would have been higher in design if a smaller proportion of employed persons was self-employed and/or owner-worker;
• Profit shares in value added are highest in the design sector, but this is partly a reflection of the fact that income of self-employed designers is counted as profit rather than personnel costs. Measured using the share of personnel costs in value added, cleaning and security appear most labour intensive in production. The figure for design in particular underestimates the importance of labour as production factor for the same reason as before;
• Advertising and market research make most intensive use of intermediate goods and services in production, reflected in the relatively low share of value added in production value.
The next chapters provide more information and insight into the main findings from the detailed sector studies for each of these five selected business related services.
8
The sectors listed in the Terms of Reference were: logistics, marketing and advertising, facility management, technical and engineering services, and design. The final choice resulted in splitting facility management in two distinct sectors. Logistics was not selected for detailed analysis.
Table 2.5 EU-27 – Key statistical indicators for five selected business related service sectors for 2010 Technical consulting Advertising and market research Design services Security and investigation activities Cleaning activities Number of enterprises 594,189 274,345 132,422 56,830 208,000
Turnover or gross premiums written (million euro)
217,763 157,860 17,177 43,700 81,039
Production value (million euro) 201,436 132,648 15,275 41,921 80,600 Value added at factor cost
(million euro)
103,319 46,697 7,855 30,076 55,300
Gross operating surplus (million euro)
37,460 16,891 4,490 4,159 9,650
Personnel costs (million euro) 65,859 29,807 3,365 25,916 45,700 Number of persons employed
(in hundred persons)
19,484 11,430 2,000 13,920 33,900
Number of persons employed per enterprise
3 4 2 24 16
Turnover per person employed (thousand euro per person)
112 138 86 31 24
Wage adjusted labour productivity (%)
117 129 123 112 114
Share of employees in persons employed (%) 75 82 53 97 94 Gross operating surplus/turnover (gross operating rate) (%) 17 11 26 10 12
Share of gross operating surplus in value added (%)
36 36 57 14 17
Share of personnel costs in value added (%)
64 64 43 86 83
Share of personnel costs in production (%)
33 22 22 62 57
Value added at factor cost in production value (%)
51 35 51 72 69
Total purchases of goods and services (million euro)
119,805 111,674 9,303 13,777 27,000
Share of personnel costs in total purchases of goods and services
55 27 36 188 169
Notes: Source: Eurostat SBS for 2010 based on NACE industry classification, revision 2. For design services, data for 2009 were used if 2010 data were not reported. Turnover per employee in design services is derived based on the estimates provided for turnover and persons employed; the figure is missing in the source data due to confidentiality reasons.