:
National Comments regarding
the Norwegian data for 2000
Langtidsovervåking av miljøkvaliteten langs Norges kyst
Rapport: 842/02
TA-nummer: 1854/2002
ISBN-nummer: 82-577-4115-9
Oppdragsgiver: Statens forurensningstilsyn
Utførende institusjon: Norsk institutt for vannforskning
NIVA rapport nr. 4468-2002
Rapport
842/02
JAMP National Comments 2000 - Norway
Norwegian Institute for Water Research
REPORT
Main Office Regional Office, Sørlandet Regional Office, Østlandet Regional Office, Vestlandet Akvaplan-NIVA A/S
P.O. Box 173, Kjelsås Televeien 1 Sandvikaveien 41 Nordnesboder 5 Søndre Tollbugate 3 N-0411 Oslo N-4890 Grimstad N-2312 Ottestad N-5008 Bergen N-9000 Tromsø
Norway Norway Norway Norway Norway
Phone (47) 22 18 51 00 Phone (47) 37 29 50 55 Phone (47) 62 57 64 00 Phone (47) 55 30 22 50 Phone (47) 77 68 52 80 Telefax (47) 22 18 52 00 Telefax (47) 37 04 45 13 Telefax (47) 62 57 66 53 Telefax (47) 55 30 22 51 Telefax (47) 77 68 05 09 Title
Joint Assessment and Monitoring Programme (JAMP). National Comments regarding the Norwegian Data for 2000 (Norwegian State Pollution Monitoring Programme Report no. 842/02. TA-no. 1854/2002)
Serial No.
4468-2002
Report No. Sub-No.
O-80106 Date 10.01.2002 Pages Price 197 Author(s) Norman W. Green Ketil Hylland Anders Ruus Mats Walday Topic group Marine ecology Geographical area Oslofjord to Varangerfjord Distribution Printed NIVA Client(s)
Norwegian Pollution Control Authority (SFT)
Client ref.
Abstract
This report is part of the Norwegian contribution to the SIME 2002 meeting administrated by OSPAR. JAMP 2000 included the monitoring of micropollutants in blue mussels (42 stations) and fish (16 stations) along the coast of Norway from Oslo to Bergen, Lofoten and Varangerfjord. The results indicated elevated levels of contaminants (i.e. over provisional “high background”) in: Oslofjord proper (PCBs, mercury and lead in cod; PCBs in mussels), Langesundsfjord (HCB in mussels) and Sørfjord and Hardangerfjord (cadmium, lead, mercury and ppDDE in mussels and cod; and PCBs in cod). Significant upward trends were found for mercury in cod from the inner Oslofjord and mussels from the outer Sørfjord and a downward trend was found for cadmium in mussels from the Hardangerfjord. The results from the remaining stations showed low or moderately levels of contamination. The “pollution” index classification improved from "bad" to just within class "poor" in 2000, whereas the "reference" index remained in classification "fair". Studies were also conducted in two areas on the southern/south-western coast using biological effects methods in cod (8 stations), flatfish (7 stations) and imposex/intersex in dogwhelks (13 stations).
Contamination of organotin in mussels and imposex in dogwhelks were still apparent, especially in the Haugesund area.
4 keywords, Norwegian 4 keywords, English
1. Miljøgifter 1. Contaminants
2. Organismer 2. Organisms
3. Marin 3. Marine
JAMP National Comments 2000 - Norway
NIVA report no.4468-2002
OSPAR CONVENTION FOR THE PROTECTION OF THE MARINE ENVIRONMENT OF THE NORTHEAST ATLANTIC
WORKING GROUP ON CONCENTRATIONS, TRENDS AND EFFECTS OF SUBSTANCES IN THE MARINE ENVIRONMENT (SIME)
OUDENBURG 29-31 JANUARY 2002
_________________________________________________________________________ ____
O-80106
JOINT ASSESSMENT AND MONITORING PROGRAMME (JAMP)
NATIONAL COMMENTS REGARDING
THE NORWEGIAN DATA FOR 2000
Oslo, 3. January 2002
Submitted by: NORWAY
Norman W. Green
Norwegian Institute for Water Research (NIVA) PB 173 Kjelsås
N-0411 Oslo
Submitted to: Oslo and Paris Commissions (OSPAR)
att. Dornford Rugg New Court
48 Carey Street London WC2A 2JQ
Copy to: Norwegian Pollution Control Authority (SFT)
att. Per Erik Iversen PB 8100 Dep. N-0032 Oslo
International Council for the Exploration of the Seas (ICES) att. Janet Pawlak
Palægade 2-4
Foreword
This report presents the Norwegian national comments on the 2000 investigations for the Joint Assessment and Monitoring Programme (JAMP). JAMP is administered by the Oslo and Paris Commissions (OSPAR) and their Environmental Assessment and Monitoring Committee (ASMO). JAMP receives guidance from the International Council for the Exploration of the Sea (ICES). ASMO has delegated implementation of part of the programme to the Working Group on Concentrations, Trends and Effects of Substances in the Marine Environment (SIME). The Norwegian 2000 investigations are directed to particular JAMP issues relating to contaminants and implemented by SIME. Some JAMP issues to be addressed lack adequate guidelines, in such cases guidelines used by the Joint Monitoring Programme (JMP) were applied.
The Norwegian JAMP for 2000 was carried out by the Norwegian Institute for Water Research (NIVA) by contract from the Norwegian Pollution Control Authority (SFT), (NIVA contract
O-80106).
The Norwegian contribution to the JMP/JAMP was initiated by SFT in 1981 as part of the national monitoring programme. It now comprises three areas: the Oslofjord and adjacent areas (Hvaler-Singlefjord area and Langesundsfjord, 1981-), Sørfjord/Hardangerfjord (1983-84, 1987-) and Orkdalsfjord area (1984-89, 1991-93, 1995-96).
Since the North Sea Task Force Monitoring Master Plan was implemented in 1990 additional areas have also been monitored. These include: Arendal, Lista and Bømlo-Sotra areas. On the initiative of SFT and NIVA "reference" or merely diffusely contaminated areas from Bergen to Lofoten have been monitored since 1992 and from Lofoten to the Norwegian-Russian border from 1994.
The comments are presented in accordance with the agreed standardised format (ASMO 1997, Annex 12).
Thanks are due to many colleagues at NIVA, especially: Unni Efraimsen, Åse Kristine Rogne, Sigurd Øxnevad, Tom Tellefsen for field work, sample preparations, data entry; Torgunn Sætre, Alfhild Kringstad, Einar Brevik and colleagues for organic analyses; Norunn Følsvik for organotin analyses; Bente Hiort Lauritzen and her colleagues for metal analyses; Randi Romstad and her collegues for biological effects measurements, Gunnar Severinsen for data programme management and operation; and to the authors Ketil Hylland (biological effects methods), and Mats Walday (organotin). Thanks go also to the numerous fishermen and their boat crews we have had the pleasure of working with.
Oslo,3 January 2002. Norman W. Green Project co-ordinator
Contents
1. General Details 1 1.1 Executive Summary 1 1.2 Introduction 2 1.3 Information on measurements 3 1.3.1 Oslofjord area 31.3.2 Sørfjord and Hardangerfjord 8
1.3.3 Lista area 16
1.3.4 Bømlo-Sotra area 16
1.3.5 Orkdalsfjord area 16
1.3.6 Open coast areas from Bergen to Lofoten 16
1.3.7 Exposed area of Varangerfjord near the Russian border 16
1.3.8 Norwegian Pollution and Reference Indices (The Index
Programme) 17
1.4 Biological effects methods for cod and flatfish 18
1.4.1 OH-pyrene metabolites in bile 19
1.4.2 ALA-D in blood cells 21
1.4.3 EROD in liver 23
1.4.4 Metallothionein in liver 25
1.4.5 Concluding remarks 25
1.5 Effects and concentrations of organotin 27
1.5.1 Dogwhelks 27
1.5.2 Mussels 30
1.5.3 Concluding remark 30
1.6 Overall conclusions 31
2. Technical Details 36
2.1 Compliance with guidelines/procedures 36
2.1.1 JAMP programme 36
2.1.2 Overconcentrations and classification of environmental quality 36
2.1.3 Comparison with previous data 39
2.1.4 The effect of depuration and freezing on mussels 40
2.2 Information on Quality Assurance 40
JAMP National Comments 2000 - Norway
NIVA report no.4468-2002
3. References 42
Appendix A Quality assurance programme 45
Appendix B Abbreviations 49
Appendix C Participation in intercalibration exercises 59
Appendix D Analytical overview 63
Appendix E Overview of localities and samples 1981-2000 79
Appendix F Map of stations 91
Appendix G Overview of materials and analyses 2000 109 Appendix H Temporal trend analyses of contaminants in biota
1981-2000 115
Appendix I Geographical distribution of contaminants in biota
1999-2000 145
Appendix J Results from INDEX determinations 1995-2000 161
Appendix K Biological effects methods summary results
1997-2000 193
1. General Details
1.1
Executive Summary
The Norwegian JAMP 2000 included the monitoring of micropollutants (contaminants) in blue mussels (42 stations including supplementary stations for the Norwegian Index programme and for and TBT analyses), dog whelks (13 stations) and fish (16 cod/flatfish stations) from the border of Sweden in the south along the coast of Norway to the Bergen area, Lofoten and the Varangerfjord bordering Russia. The results indicated elevated levels of contaminants (i.e. over provisional “high background”) in:
• JAMP area 26: Oslofjord proper (PCBs (sum of seven congeners), and to a lesser extent
mercury, and lead) and Langesundsfjord (HCB). The median concentrations of PCB found in cod liver and cod fillet from the inner Oslofjord were the lowest since 1990 and 1996, respectively. A significant upward trend was detected for mercury in cod fillet from "large" and "small" individuals from the inner Oslofjord 1984-2000.
• JAMP areas 63 and 62: Sørfjord and Hardangerfjord (cadmium, lead, mercury and ppDDE and to
a lesser extent PCB). A significant downward trend was found for cadmium in mussels at one station in the Hardangerfjord and an upward trend for mercury in mussels at one station in outer Sørfjord 1987-2000.
Two environmental indices have been applied annually since 1995 to assess the levels of
contamination in mussels from “polluted” and “reference” areas. The results were just within the class “poor” (i.e., in the Norwegian Pollution Control Authority classification system) when applying the “pollution” index, an improvement from class "bad" in 1999, whereas a "fair" condition when applying the “reference” index.
The biological effects methods OH-pyrene (pyrene metabolite), δ-aminolevulinic acid dehydrase
(ALA-D), cytochrome P4501A activity (EROD) and metallothionein (MT) were determined in cod and flatfish, from six and five stations, respectively, from the southern and south-western coast from 1997 to 2000. In 2000 two stations from northern Norway were added (both for cod and flatfish). Six of the seven flatfish stations observed were in close proximity to the cod stations. With respect to OH-pyrene metabolites in 2000, there were somewhat elevated levels at sites where fish are
moderately exposed to PAH (inner Sørfjord, inner Oslofjord; Lista samples not analysed). Results for ALA-D and EROD in the moderately polluted stations compared to the diffusely polluted stations were inconsistent for the four years. EROD analyses in cod and flatfish from Varangerfjord indicated that the fish were exposed to contaminants even though this area is considered to be only diffusely affected and OH-pyrene was low. For cod, different MT-analysis methods were used in 2000 (DPP) compared to 1997-1999 (ELISA).
The presence of organotin (e.g. TBT) in Norwegian waters was still a problem in 2000, more severe close to harbours and major ship-routes. Two reference sites in northern Norway appeared to be unaffected, and the Haugesund area is still the most heavily contaminated. Levels of TBT in blue mussels have decreased since last year. However, the ban on the use of TBT in antifouling on boats <25m of length has not lead to a clear improvement in the investigated areas.
JAMP National Comments 2000 - Norway
2 NIVA report no. 4468-2002
1.2
Introduction
The Norwegian contribution to the “Joint Assessment and Monitoring Programme (JAMP) was initiated by the Norwegian Pollution Control Authority (SFT) and is integrated with SFT’s State Pollution Monitoring Programme. The procedures and practice of JAMP has also provided a basis for other investigations of interest to SFT but not necessarily requested by JAMP (e.g. SFT’s Index Programme (Pollution and Reference Indices), Chapter 1.3.8).
Data are submitted to ICES under three categories: for Purpose A (health assessment) on a voluntary basis, Purpose C (spatial distribution) on a voluntary basis and Purpose D (temporal trend assessment) on a mandatory basis. Where practical, data collection was in accordance to agreed procedures (OSPAR 1990, 1997). Data were screened and submitted to ICES in accordance with procedures outlined by ICES (1996).
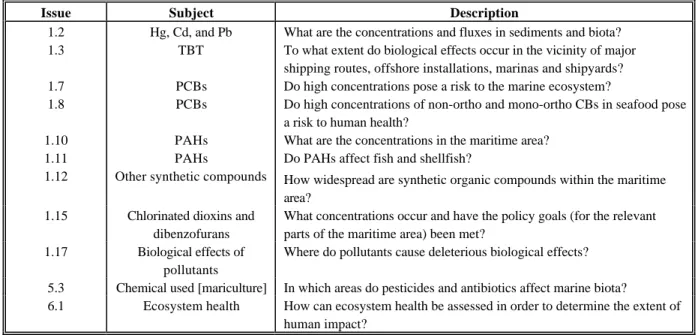
This report focuses on issues and situations in Norway concerning contaminants and considered of interest to the implementation of JAMP (Table 1). It should be noted that these issues are being revised (cf., MON 2001).
Table 1.Extract from list of JAMP issues, subjects and descriptions to which the Norwegian investigations for 2000 can be addressed (cf. ASMO 1997, Annex 30).
Issue Subject Description
1.2 Hg, Cd, and Pb What are the concentrations and fluxes in sediments and biota? 1.3 TBT To what extent do biological effects occur in the vicinity of major
shipping routes, offshore installations, marinas and shipyards? 1.7 PCBs Do high concentrations pose a risk to the marine ecosystem?
1.8 PCBs Do high concentrations of non-ortho and mono-ortho CBs in seafood pose a risk to human health?
1.10 PAHs What are the concentrations in the maritime area? 1.11 PAHs Do PAHs affect fish and shellfish?
1.12 Other synthetic compounds How widespread are synthetic organic compounds within the maritime area?
1.15 Chlorinated dioxins and dibenzofurans
What concentrations occur and have the policy goals (for the relevant parts of the maritime area) been met?
1.17 Biological effects of pollutants
Where do pollutants cause deleterious biological effects? 5.3 Chemical used [mariculture] In which areas do pesticides and antibiotics affect marine biota?
6.1 Ecosystem health How can ecosystem health be assessed in order to determine the extent of human impact?
This report is structured at the first and second level according to agreed format (ASMO 1997, Annex
1.3
Information on measurements
An overview of JAMP stations in Norway is shown in the tables in Appendix E. and maps in Appendix F. . The stations and sample counts relevant to the 2000 investigations are noted in the tables in Appendix E. .
Blue mussels were sampled at 43 stations (including supplementary stations for Index and TBT) and fish from 16 cod/flatfish stations from the border to Sweden in the south to the border to Russia in the north. Generally, mussels are not abundant on the exposed coastline from Lista (south Norway) to the North of Norway. A number of samples were collected from dock areas, buoys or anchor lines.
1.3.1
Oslofjord area
Moderate overconcentrations of ΣPCB-7 (sum of congeners: 28, 52, 101, 118, 138, 153, and 180) in
mussels were found in the inner Oslofjord (st.30A, up to nearly 3 times provisional "high background" -see Chapter 2.1.2) (Figure 1, Appendix I. , and temporal trend analyses in Appendix H. ). Marked overconcentrations were also found in cod liver from the inner Oslofjord (st.30B, 4 times “high background”; Figure 2). However the median concentration was 2080 ppb w.w. and the lowest since 1990. Similarly, the median concentration in cod fillet for 2000 was 6.1 ppb and lowest since 1996 (Appendix H. ). No overconcentrations were found in cod liver from the outer Oslofjord (st.36B). In 1994 the Norwegian Food Control Authority (SNT) advised not to consume liver of cod from the inner Oslofjord (north of st.31A) due to concerns about PCB contamination (Table 3, page 32). The reason for higher concentrations of PCB in 1999 may have been partly due to analytical aspects
(Green et al. 2001a). Control analyses of certified reference material were on the average about 30%
higher for CB-153, one of the more persistent PCB congeners, in 1999 (cf., Green et al. 2001a) but
the control analyses for 2000 were within the given confidence interval (Table 7, Appendix A. ). No significant linear trend was detected (see method description in Chapter 2.1.3) for PCB in mussels from four stations (30A, 31A, 35A and 36A) from 1988 to 2000 or for cod (30B and 36B) from 1990 to 2000.
Power analyses (see Chapter 2.1.3) indicated that a hypothetical trend of 10% change per year in
ΣPCB-7 concentration in the blue mussel or cod liver from the inner Oslofjord would take 10 or 12
years, respectively, to be detected with 90% significance (Appendix H. ).
Moderate overconcentrations of mercury were found in the fillet of both “large” and "small" cod
(st.30B) from the inner Oslofjord (Figure 3), about 2 times "high background". A significant upward
trend was detected for the period 1984-2000 for both size groups. No overconcentration was found for cod from the outer Oslofjord (st.36B). The power, indicated as number of years to detect a hypothetical 10% change per year, for mercury in cod fillet from either station was slightly better for “small” fish (10-11 years) than “large” fish (13-14 years) (cf. Appendix H. ). Concentrations of mercury when considering the entire period were significantly higher in "large" cod compared to "small" cod. No overconcentrations were found in fillet of flounder from mid Oslofjord (st.33B). Median concentration of lead in cod liver from the inner Oslofjord (30B) was 0.24 ppm w.w. and over 2 times "high background".
JAMP National Comments 2000 - Norway
4 NIVA report no. 4468-2002
A
CB_S7, Mytilus edulis, Soft body, 30A , All
0.00 0.05 0.10 0.15 1981 1983 1985 1987 1989 1991 1993 1995 1997 1999 2001 Year B
CB_S7, Mytilus edulis, Soft body, 31A , All
0.00 0.05 0.10 0.15 1981 1983 1985 1987 1989 1991 1993 1995 1997 1999 2001 Year C
CB_S7, Mytilus edulis, Soft body, 35A , All
0.00 0.05 0.10 0.15 1981 1983 1985 1987 1989 1991 1993 1995 1997 1999 2001 Year D
CB_S7, Mytilus edulis, Soft body, 36A , All
0.00 0.05 0.10 0.15 1981 1983 1985 1987 1989 1991 1993 1995 1997 1999 2001 Year
Figure 1. Median CB_S7 (=ΣPCB-7, sum of PCB 28, 52, 101, 118, 138, 153 and 180) concentration in blue mussel (Mytilus edulis) from inner (st.30A) to outer (st.36A) Oslofjord. (cf. Appendix F. and key in Figure 18, page 39).
A
CB_S7, Gadus morhua, Liver, 30B
0 1 2 3 4 5 1981 1983 1985 1987 1989 1991 1993 1995 1997 1999 2001 Year B
CB_S7, Gadus morhua, Liver, 36B
0 1 2 3 4 5 1981 1983 1985 1987 1989 1991 1993 1995 1997 1999 2001 Year C
CB_S7, Gadus morhua, Fillet, 30B
0.00 0.01 0.02 0.03 0.04 0.05 1981 1983 1985 1987 1989 1991 1993 1995 1997 1999 2001 Year D
CB_S7, Gadus morhua, Fillet, 36B
0.00 0.01 0.02 0.03 0.04 0.05 1981 1983 1985 1987 1989 1991 1993 1995 1997 1999 2001 Year
Figure 2. Median CB_S7 (=ΣPCB-7, sum of PCB 28, 52, 101, 118, 138, 153 and 180) concentration in liver and fillet of cod (Gadus morhua) from the inner (st.30B) to outer (st.36B) Oslofjord. (cf. Appendix F. and key in
JAMP National Comments 2000 - Norway
6 NIVA report no. 4468-2002
A
HG, Gadus morhua, Fillet, 30B , Small
0.0 0.1 0.2 0.3 0.4 0.5 1981 1983 1985 1987 1989 1991 1993 1995 1997 1999 2001 Year B
HG, Gadus morhua, Fillet, 30B , Large
0.0 0.1 0.2 0.3 0.4 0.5 1981 1983 1985 1987 1989 1991 1993 1995 1997 1999 2001 Year C
HG, Gadus morhua, Fillet, 36B , Small
0.0 0.1 0.2 0.3 0.4 0.5 1981 1983 1985 1987 1989 1991 1993 1995 1997 1999 2001 Year D
HG, Gadus morhua, Fillet, 36B , Large
0.0 0.1 0.2 0.3 0.4 0.5 1981 1983 1985 1987 1989 1991 1993 1995 1997 1999 2001 Year
Figure 3. Median mercury (Hg) concentration in fillet of cod (Gadus morhua): for the inner Oslofjord (st.30B) “small” (A) and “large” (B) fish, and for the outer Oslofjord (st.36B) “small” (C) and “large” (D) fish. (cf. Appendix F. and key in Figure 18).
Mussels from Langesundsfjord (st.71A) had in 2000 marked overconcentrations of HCB (over 3 times “high background”, Appendix H. ). Concentrations have varied greatly during the investigation period (since 1983) but median value have decreased distinctly since 1989 (Figure 4) due to about a 99% reduction in discharge of HCB and other organochlorines from a magnesium factory after 1990
(cf. Knutzen et al. 2001).
The variability in the data is much less after 1989. The relatively large variability found in this series prior to 1990 accounts for the poor power. The power of the monitoring program for the period 1990-2000 is 14 years and better than the power for the entire period which is over 25 years (cf. Appendix H. for entire period). Separate analysis for the 1983-2000 data also indicated no significant trend. The
1990-2000 period had a significant downward trend.
HCB, Mytilus edulis, Soft body, 71A
0.0001 0.0010 0.0100 0.1000 1.0000 1981 1983 1985 1987 1989 1991 1993 1995 1997 1999 2001 Year very bad (Cl. V) poor (Cl. III) fair (Cl. II) bad (Cl. IV) good (Cl. I)
Figure 4. Median HCB concentration in blue mussel (Mytilus edulis) from Langesundsfjord (west of
Oslofjord). (cf. Appendix F. and key in Figure 18). Vertical line indicates when a magnesium factory reduced it's discharge by 99%. Horizontal lines indicate classes as defined in Table 6. NB: log-scale.
JAMP National Comments 2000 - Norway
8 NIVA report no. 4468-2002
1.3.2
Sørfjord and Hardangerfjord
The development of the contaminant conditions in these connected fjords and the main remedial actions that have been taken, have been outlined in the national comments for 1989 (Green 1991) and in a recent report concerning Sørfjord in particular (Skei 2000, Skei & Knutzen 2000). The results from JAMP 2000 are coupled to other studies in this area (cf.. Knutzen & Green 2001a) and confirm that the fjords continue to be contaminated especially with cadmium (e.g. Figure 5 and Figure 6), lead, mercury, ppDDE (e.g. Figure 7 and Figure 8) and to a lesser extent PCB.
Results for mussels collected from the Sørfjord (st. 51A, 52A, 56A and 57A) indicated up to severe overconcentrations of cadmium (3-13 times provisional “high background”, Appendix H. ), lead (1-30 times) and mercury (1-19 times). Overconcentrations of cadmium, lead and mercury could be traced to Ranaskjær (st.63A) in the Hardangerfjord, about 60 km from the head of Sørfjord. A significant
downward trend was found for cadmium at st. 63A, 1990-2000, and a significant upward trend was found for mercury at st.57A, 1987-2000 (Appendix H. ). In 2001 the Norwegian Food Control
Authority (SNT) extended their advice against the consumption of mussels to include all seafood in the Sørfjord (Table 3) due to concerns about metal and PCB contamination.
Marked overconcentrations were found for cadmium in cod liver and flounder liver from inner Sørfjord (8 and 6 times "high background", respectively). Moderate to marked overconcentrations were found for mercury in fillet in cod and flounder, and slight overcentrations of lead in liver for these fish species.
The median mercury concentrations for mussels collected near Odda at the head of the Sørfjord (st.51A) in 2000 was 3.9 ppm d.w. and the highest found for this investigation. (Samples from this station were not depurated but evidence indicates that there is not significant difference compared to
samples that have been depurated (Green 1989, Green et al. 2001a)). Higher median concentrations
for 2000 compared to 1999 were found in mussels from st.56A, 63A and 65A, cod and flounder from station 53. These results may in part be due to an accidental discharge of mercury during the
winter/spring of 1999-2000 (Skei & Knutzen 2001). The average of monthly surface water samples from November 1999 to June 2000 from seven stations within 11km of Odda was 109 ng/l (n=64, range: 1-2090), compared to an average of 6 ng/l (n=120, range: 1-57) for the 10 months prior and the 5 months after this period (cf. Skei 2000, 2001).
The power of the sampling strategies for mussels was relatively poor for samples collected from Odda; the innermost part of Sørfjord (st.51A or 52A). For example for lead in mussels, it is estimated that it would take 22-25 years to detect a hypothetical trend of 10% per year with 90% significance (Appendix H. ). This reflects the large variability found in the data series from this area. The variability is mostly due to the irregular/accidental input of contaminated discharges. The power improved with distance from Odda, and at Ranaskjær (st.63A, ca.50km from Odda) it was only 10 years.
Overconcentrations of ppDDE were found in mussels from the head of the Sørfjord to about 60 km towards the open coast (Figure 7 and Figure 8). The highest median concentration in mussels was 27 ppb d.w. (overconcentrations of about 3 times). Moderate overconcentrations of ppDDE were found in cod liver from the inner Sørfjord (st.53B), close to 3 times "high background" (Figure 9, Appendix H. ).
The source of ppDDE is uncertain. Analyses of supplementary stations (51A, 56A-1, 56A-2 and
57A-1) between 56A and 57A indicated for 1999 that there may be several sources (cf., Green et al.
2001a, c). The Sørfjord and Hardangerfjord area has a considerable number of fruit orchards. Earlier use and persistence of DDT and leaching from contaminated soil is probably the main reason for the
elevated levels found. DDT products have been prohibited in Norway since 1970 (excepting the dipping of spruce seedling until 1987).
JAMP National Comments 2000 - Norway
10 NIVA report no. 4468-2002
Median concentrations of ΣPCB-7 (sum of congeners: 28, -52, 101, -118, -138, -153 and -180)
(Appendix H. and Appendix I. ) in cod liver from Sørfjord was 3 times "high background". During the period 1990-2000, the concentrations have ranged from 100 to 700 ppb w.w., except for the years 1993, 1998 and 2000 where the median values varied between 1500 and 2400 ppb w.w. This indicates that cod is subject to a variable exposure from PCB, but the cause of this variation is not clear. So far (2000) mussel data have merely indicated one minor local source to surfaces waters (Knutzen & Green, 2001a). In 2001 the Norwegian Food Control Authority (SNT) has advised against
consumption of cod liver from the inner Sørfjord (Table 3) due to concerns about PCB contamination. No trends were evident in these organisms for ppDDE and CB153 during the period 1990-2000.
A
CD, Mytilus edulis, Soft body, 51A , All
0 20 40 60 80 100 1986 1988 1990 1992 1994 1996 1998 2000 Year B
CD, Mytilus edulis, Soft body, 52A , All
0 20 40 60 80 100 1986 1988 1990 1992 1994 1996 1998 2000 Year C
CD, Mytilus edulis, Soft body, 56A , All
0 20 40 60 80 100 1986 1988 1990 1992 1994 1996 1998 2000 Year D
CD, Mytilus edulis, Soft body, 57A , All
0 20 40 60 80 100 1986 1988 1990 1992 1994 1996 1998 2000 Year
Figure 5. Median cadmium (Cd) concentration in blue mussel (Mytilus edulis) from inner (st.51A) to outer (st.57A) Sørfjord. NB: (cf. Appendix F. and key in Figure 18). Note: for some years the upper confidence interval line is off-scale in figures A and B. Note: horizontal line for Class I near x-axis.
JAMP National Comments 2000 - Norway
12 NIVA report no. 4468-2002
A
CD, Mytilus edulis, Soft body, 63A , All
0 20 40 60 80 100 1986 1988 1990 1992 1994 1996 1998 2000 Year B
CD, Mytilus edulis, Soft body, 65A , All
0 20 40 60 80 100 1986 1988 1990 1992 1994 1996 1998 2000 Year C
CD, Mytilus edulis, Soft body, 69A , All
0 20 40 60 80 100 1986 1988 1990 1992 1994 1996 1998 2000 Year
Figure 6. Median cadmium (Cd) concentration in blue mussel (Mytilus edulis) from Hardangerfjord (st. 63A, 65A and 69A). (cf. Appendix F. and key in Figure 18). Note: horizontal line for Class I near x-axis.
A
DDEPP, Mytilus edulis, Soft body, 51A
0.00 0.02 0.04 0.06 0.08 0.10 1986 1988 1990 1992 1994 1996 1998 2000 Year B
DDEPP, Mytilus edulis, Soft body, 52A
0.00 0.02 0.04 0.06 0.08 0.10 1986 1988 1990 1992 1994 1996 1998 2000 Year C
DDEPP, Mytilus edulis, Soft body, 56A
0.00 0.02 0.04 0.06 0.08 0.10 1986 1988 1990 1992 1994 1996 1998 2000 Year D
DDEPP, Mytilus edulis, Soft body, 57A
0.00 0.02 0.04 0.06 0.08 0.10 1986 1988 1990 1992 1994 1996 1998 2000 Year
Figure 7. Median ppDDE (DDEPP) concentration in blue mussel (Mytilus edulis) from inner (st.51A) to outer (st.57A) Sørfjord. (cf. Appendix F. and key in Figure 18). Note: for some years the upper confidence interval line is off-scale in figures A and C. Note: horizontal line for Class I near x-axis.
JAMP National Comments 2000 - Norway
14 NIVA report no. 4468-2002
A
DDEPP, Mytilus edulis, Soft body, 63A
0.00 0.02 0.04 0.06 0.08 0.10 1986 1988 1990 1992 1994 1996 1998 2000 Year B
DDEPP, Mytilus edulis, Soft body, 65A
0.00 0.02 0.04 0.06 0.08 0.10 1986 1988 1990 1992 1994 1996 1998 2000 Year C
DDEPP, Mytilus edulis, Soft body, 69A
0.00 0.02 0.04 0.06 0.08 0.10 1986 1988 1990 1992 1994 1996 1998 2000 Year
Figure 8.Median ppDDE (DDEPP) concentrations in blue mussel (Mytilus edulis) from Hardangerfjord (st. 63A, 65A and 69A). (cf. Appendix F. and key in Figure 18). Note: horizontal line for Class I near x-axis.
A
DDEPP, Gadus morhua, Liver, 53B
0.0 1.0 2.0 3.0 1986 1988 1990 1992 1994 1996 1998 2000 Year c B
DDEPP, Gadus morhua, Liver, 67B
0.0 1.0 2.0 3.0 1986 1988 1990 1992 1994 1996 1998 2000 Year C
CB_S7, Gadus morhua, Liver, 53B
0 1 2 3 4 5 1986 1988 1990 1992 1994 1996 1998 2000 Year D
CB_S7, Gadus morhua, Liver, 67B
0 1 2 3 4 5 1986 1988 1990 1992 1994 1996 1998 2000 Year
Figure 9. Median ppDDE (DDEPP) and CB_S7 (=ΣPCB-7) concentrations in cod (Gadus morhua) from Sørfjord (st.53B) and Hardangerfjord (st.67B) (cf. Appendix F. and key in Figure 18). Note that for some years the upper confidence interval line is off-scale in Figure A.
JAMP National Comments 2000 - Norway
16 NIVA report no. 4468-2002
1.3.3
Lista area
No overconcentrations of metals or chlorinated hydrocarbons were found in mussels, cod or dab (st.15A/B/F, Appendix H. and Appendix I. ).
1.3.4
Bømlo-Sotra area
It was impractical to continue sampling for flatfish at st.22F Borøyfjorden. Thus, a new station in Åkrafjorden, 21F Kyrping, was initiated. This station is about 82km south-east of 22F, but like 22F, is considered in a reference area.
Slight overconcentrations of cadmium (less than 2 times "high background") were found in mussels from this area (22A, Appendix H. and Appendix I. ).
1.3.5
Orkdalsfjord area
Investigations in the area have been discontinued. Data for mussels is available for the period 1984-1996.
1.3.6
Open coast areas from Bergen to Lofoten
This stretch of coastline covers 7° of latitude to 68°N (Appendix F. ). Only one mussel station
(st.98A) was investigated. Mussels were collected from 98A in 1992-1993. However, during the period 1994-1996 mussels were not found at this station but were collected from nearby Skrova harbour (98X). Since 1997 a "new" 98A location was found roughly 18 km north in a small fjord remote from apparent point source of contamination.
In 2000, moderate overconcentrations (4 times "high background") of cadmium and slight
overconcentrations (less than 2 times) of mercury in fillet and ppDDE in liver of plaice. Otherwise no other overconcentrations were found in this species or in cod and mussels (st.98A/B/F, Appendix H. and Appendix I. ).
1.3.7
Exposed area of Varangerfjord near the Russian border
The remaining and northern area of JAMP in Norway stretches north of 68°N and a longitude from
17 to 29°E (Appendix F. ). In 2000 only two mussel stations, one cod and one plaice station were
investigated in the Varangerfjord that borders with Russia (at approximately 70°N).
Slight overconcentrations (less than 2 times “high background”) of cadmium in liver of cod and plaice (st.10B/F) (Appendix H. and Appendix I. ). Overconcentrations of ppDDE (about 3 times) and HCB (less than 2 times) were found in plaice liver.
1.3.8
Norwegian Pollution and Reference Indices (The Index Programme)
The Norwegian Pollution Control Authority (SFT) has requested a select and small group of indices to assess the quality of the environment with respect to contaminants. One index is based on the levels and trends of contaminant concentrations in the blue mussel collected annually from a selection of the more contaminated fjords in Norway (Appendix J. ). SFT has also requested the testing of this index against “reference” stations from selected areas and fjords.
The Index scale varies from 1, in which no overconcentrations were found at any station, to 5, in which at least one sample from each area or fjord could be classified as “very bad” in SFT's system. Nine fjord areas were used to calculate the Pollution Index. The Index for 2000 is 2.9, down from 3.2
in 1999. A value between 2 and 3 is "Poor" in SFT's Environmental Classification System (Molvær et
al. 1997).
Only four fjord/areas were included in Reference Index for 1998-2000 compared to seven to eight used in previous years. The Index for 2000 is 1.4. A value between 1 and 2 would be classified as “Fair”.
The use of the indices to assess the general level of pollution in contaminated or reference areas of coastal water for the period 1995 to 1999 has been reviewed (Green & Knutzen, 2001). The conclusions were mainly that the sample and analytical strategies lacked adequate coverage of the relevant contaminants and geographical areas. Hence, the results can be misleading. Furthermore, the report suggested supplementing the assessment of this type with relevant analyses of sediment. It is not the intent of the application of the indices to give a station by station account, however, after 6 years of use (1995-2000) analyses showed some significant trends (cf. Appendix H. ). Two cases were of particular interest and should be monitored closely:
• St.I201, Ekkjegrunn in the Saudafjorden on the West Coast where an upward trend was detected
for lead in mussels; these had moderate overconcentrations in 2000 (2.1 times "high background").
• St.I132, Fiskåtangen in the Kristiansand harbour where severe overconcentrations of HCB were
JAMP National Comments 2000 - Norway
18 NIVA report no. 4468-2002
1.4
Biological effects methods for cod and flatfish
The JAMP-programme for 2000 included five biological effects methods (BEM): FAC, ALA-D,
EROD, MT and TBT (Table 2). The first four are discussed in this chapter (Figure 10 to Figure 13,
Appendix K. ) and TBT is discussed separately (cf., Chapter 1.5).
FAC, ALA-D, EROD and MT were measured in Atlantic cod collected at seven locations (23B, 30B, 36B, 53B, 67B, 98B, 10B). The same parameters were also measured in flounder at three locations (21F, 53F, 67F), dab at one location (36F) and plaice at two locations (98F, 10F). No data from station 15B/F was obtained in 2000. The locations can be divided into two groups: one group of stations can be considered to be moderately to markedly polluted (30B, 53B/F, 67B/F), whereas the other locations were from areas with little or no known pollution input.
Table 2. Summary of biological methods employed by the JAMP-2000.
Code Name tissue
sampled
Specificity
FAC Pyrene metabolites fish bile PAH
ALA-D δ-amino levulinic acid dehydrase inhibition fish red blood
cells
Pb
EROD Cytochrome P4501A-activity
(CYP1A/P4501A1, EROD)
fish liver planar
PCB/PCNs, PAHs, dioxins
MT Metallothionein fish liver Cd Cu Zn (Hg)
TBT Imposex/Intersex snail soft
tissue
organotin
The reason to use biological effects methods within monitoring programmes is to evaluate whether marine organisms are affected by contaminant inputs. Such knowledge can not be derived from tissue levels of contaminants only. In addition to enable conclusions on the health of marine organisms, some biomarkers assist in the interpretation of contaminant bioaccumulation. The biological effects
component of the Norwegian JAMP is possibly the most extensive of its type in Europe and includes imposex in gastropods as well as biomarkers in fish. The four chosen methods for fish were selected for specificity, for robustness and because they are among a limited set of methods proposed by international organisations, including OSPAR and ICES.
The measures derived from FAC, EROD and MT (cf. Table 2) increase with increased exposure to their respective inducing contaminants. The activity of ALA-D on the other hand is inhibited by contamination (i.e., lead), thus lower activity means higher exposure.
As in previous years, 25 individual cod were sampled for biological effects measurements at the stations 23B, 30B, 36B, 53B and 67B. In addition, 15 cod were sampled at each of the new locations (10B and 98B). Similarly, 9 dab were collected at 36F and 11 to 24 flounder at 21F, 53F and 67F. At 10F and 98F, 15 and 18 plaice were collected, respectively. All fish were collected by local fishermen and kept alive until arrival of NIVA staff within 5 days. Obviously, only live fish is sampled. There is an ongoing process to train and inform the fishermen that collect fish for JAMP to ensure the quality of the material.
1.4.1
OH-pyrene metabolites in bile
The concentrations of OH-pyrene metabolites in bile were significantly higher in cod from station 15B
in 1997-1999 than the other stations (p<0.0001, ANOVA on loge transformed data (MINITAB release
12.21); no data from 2000 at this station) (Figure 10). Furthermore, concentrations in 1997 were
significantly higher at stations 53B and 67B than the other stations besides 15B (but see below). Higher concentrations of pyrene metabolites in cod were found from stations 30B and 53B in 1998 -2000 compared to other locations. The concentrations of pyrene metabolites in bile of fish from station 10B/F and 98B/F 2000 were low. The consistently high levels in cod from station 15B merits further study. This is an area with a large discharge to water from an aluminium-smelter, the main source of PAH. The fish are collected on the open coast and the discharge from the smelter is a small bay about 2-3 km away.
Bile metabolites of PAH can be detected within a short period (hours) after exposure, and holding conditions prior to sampling may affect results. However, measures were taken in 1998 and 1999 to minimise or remove this exposure. Given the precautions taken, it is unlikely that the observed levels have been caused by storage prior to sampling. The increased level of pyrene metabolites in cod from station 67B in 1997 were presumably due to holding conditions as the fish were moved to a more contaminated location before sampling could be effected (see comment under ALA-D). The increased levels of pyrene metabolites at stations 53B and 30B (1998 and 1999) presumably reflect the general contamination of the two areas (inner Sørfjord and inner Oslofjord).
A similarly increased level of OH-pyrene metabolites in bile was found in dab collected in the same
area, 15F (Figure 10). Somewhat surprisingly, flatfish (flounder) from the polluted area 53F did not
have higher levels of metabolites in bile than flatfish from other locations. An improved method for the analysis of PAH-metabolites has now been implemented (using HPLC separation and synchronous scan fluorimetry detection). In 1999, both the former and the new method were used in parallel. The results indicate good agreement between the two methods.
JAMP National Comments 2000 - Norway
20 NIVA report no. 4468-2002
A
OH-pyrene in bile of cod
0 1 10 100 1000 10000 100000 30B-97 30B-98 30B-99 30B-00 36B-97 36B-98 36B-99 36B-00 15B-97 15B-98 15B-99 23B-97 23B-98 23B-99 23B-00 53B-97 53B-98 53B-99 53B-00 67B-97 67B-98 67B-99 67B-00 98B-00 10B-00 station-year B
OH-pyrene in bile of dab, flounder and plaice
0 1 10 100 1000 10000 LL_36F-99 LL_36F-00 LL_15F-99 PF_21F-99 PF_21F-00 PF_53F-99 PF_53F-00 PF_67F-99 PF_67F-00 PP_98F-00 PP_10F-00 species-station-year
Figure 10.Concentration of OH-pyrene (ng/mL/AU380) in bile from Atlantic cod (A) and flatfish (B - LL, st.15F,
36F), flounder (PF, st.21F, 53F, 67F) and plaice (PP, st.98F, 10F)) collected at the indicated stations from 1997 to 2000. Medians and quartiles (25%, 75%). Note logarithmic axis and that values were standardised to absorbance at 380 nm. No values are available for 30B in 1997 and 15B/F in 2000. Generally, stations 36B/F, 23B/21 67B/F, 98B/F and 10B/F are considered less perturbed than stations 15B, 30B and 53B/F with regard to PAH
1.4.2
ALA-D in blood cells
The activity of ALA-D in cod was generally significantly inhibited (indicating the influence of lead contamination) at the two most contaminated stations, i.e. 30B and 53B, compared to cleaner stations
(i.e. 36B, 23B, 98B, and 10B) for 1997, 1998 and 2000 (Figure 11). For 1998, 1999 and 2000 the
activity of the enzyme at st.53B in the Sørfjorden was significantly lower than the less contaminated station 67B in the Hardangerfjord, about 65 km away. In 1997, ALA-D was inhibited in cod from station 67B, presumably due to post-capture exposure (see above), and not significantly different from 53B.
In the Oslofjord, cod from the inner part (st.30B) had significantly lower enzyme activity than fish from the outer Oslofjord (st.36B) every year except 1999, cod from st.53B had significantly lower activity of the enzyme than cod collected at 23B and 67B. In 2000, cod from st.53B had significantly lower activity of the enzyme than cod collected at all the other stations but 30B. At the two new locations (98B and 10B) ALA-D activities were similar to those at 23B and 36B.
The pattern seen for cod in 1999-2000 was also found in flounder – ALA-D was significantly lower in
fish from the more contaminated station 53F compared to 67F (Figure 11). In 2000, flounder was
also significantly lower than the assumed "reference" station 21F. Activity in dab from the outer Oslofjord (1999, 2000) and Lista area (1999) or in plaice from Lofoten (98F) and Varangerfjord (10F) were similar.
The activity of ALA-D is known to be inhibited by exposure to lead. The results indicated that fish from the Sørfjord (st.53B/F) and inner Oslofjord (st.30B) are affected by the exposure to lead. During the period 1998-2000 slight overconcentrations of lead in cod have been found in the Sørfjord (1-1.3 times provisional "high background" concentrations) and for the period 1997-2000 in cod from the inner Oslofjord (1-8.4 times, cf. Appendix H. ). During the period 1997-2000, no overcentrations were found for cod from Hardangerfjord (67B) or outer Oslofjord (36B). For flounder from the Sørfjord (53F), overconcentrations of 1-1.7 were found during this period but none for flounder from the Hardangerfjord (67F). This indicates that ALA-D might be better indicator of lead-exposure than concentration measurements in fish liver.
Although ALA-D inhibition is lead-specific, it is not possible to rule out interference by other metals or organic contaminants. Also, there is likely that different species will respond differently to the same exposure, and this needs to be taken into account when comparing different areas with different indicator organisms (e.g. flounder, dab and plaice).
JAMP National Comments 2000 - Norway
22 NIVA report no. 4468-2002
A
ALA-D in blood of cod
0 1 2 3 4 5 6 7 30B-97 30B-98 30B-99 30B-00 36B-97 36B-98 36B-99 36B-00 15B-97 15B-98 15B-99 23B-97 23B-98 23B-99 23B-00 53B-97 53B-98 53B-99 53B-00 67B-97 67B-98 67B-99 67B-00 98B-00 10B-00 station-year B
ALA-D in blood of dab, flounder and plaice
0 1 2 3 4 5 LL_36F-99 LL_36F-00 LL_15F-99 PF_21F-99 PF_21F-00 PF_53F-99 PF_53F-00 PF_67F-99 PF_67F-00 PP_98F-00 PP_10F-00 species-station-year
Figure 11.Activity of δ-aminolevulinic acid dehydrase (ALA-D, µg PBG/min/mg protein) in red blood cells from Atlantic cod (A) and flatfish (B - LL, st.15F, 36F), flounder (PF, st.21F, 53F, 67F) and plaice (PP, st.98F, 10F)) collected at the indicated stations from 1997 to 2000. Medians and quartiles (25%, 75%). Generally, stations 36B/F, 15B/F, 23B, 21F, 98B/F and 10B/F are considered less perturbed than stations 30B, 67B/F, 53B/F with regard to lead.
1.4.3
EROD in liver
High activity of hepatic cytochrome P4501A (EROD) indicates a response to contaminant exposure. It was expected that higher activity would be found at the stations that were presumed to be most perturbed by planar PCBs, PCNs, PAHs or dioxins, which were st.30B (inner Oslofjord) and 53B/F (inner Sørfjord). However, these stations were not consistently higher than other stations. Comparison could be made for cod from 1997 to 2000 and for founder in the Sørfjord/Hardangerfjord for 1999 and 2000. However, significantly higher activity in cod (xxB) or flounder (xxF) liver at these stations was
only found at (cf. Figure 12):
• St.53B in 1997 compared to all stations,
• St.53B in 1998 compared to st. 23B (Karihav, West Coast) 36B (outer Oslofjord) and 15B (Lista
area),
• St.53B in 2000 compared to st.36B and 98B (Lofoten),
• St.30B in 1998 compared to st. 23B, 36B and 15B,
• St.30B in 2000 compared to all stations,
Activity in cod from 15B was the lowest in 1997 and the highest in 1999. As mentioned above, an exposure to PAHs is indicated for this cod population (15B), and may, periodically, affect the activity in this species. Unfortunately, no data were obtained from station 15B/F in 2000 to see if the elevated EROD activities were sustained.
The 1999-2000 results for dab (st. 36F and 15F) and plaice (st. 98F and 10F) were similar to each
other but higher than flounder (st. 53F, 67F and 21F, Figure 12). No significant difference was found
in flounder from the more polluted st.53F in the Sørfjord compared to st.67F in the Hardangerfjord about 65 km away.
Data from 2000 also indicate an induction of EROD in both cod and plaice from the diffusely
contaminated area Varangerfjord (10B/F) although OH-pyrene was low (see above). PCB-data from 1995 have shown great variations in liver concentrations in cod, indicating variable exposure for cod in the area, or a point source. Plaice from Lofoten (98F) also showed elevated EROD activities as compared to flounder from the moderately contaminated 53F station, indicating interspecies
differences in “background” activities. EROD activities in cod from Lofoten (98B) were the lowest recorded in this investigation and may indicate "background" activity, compared to all other stations. No adjustment for water temperature, season, size or sex has been made. Fish is sampled at a time of year (September-November) when differences between the sexes should be at a minimum. Generally, higher activity was found at more contaminated stations though the response was inconsistent. This inconsistency might indicate that populations with variable exposure history are sampled. Besides, there is evidence from other fish species that continuous exposure to e.g. PCBs may cause adaptation, i.e. decreased EROD response.
JAMP National Comments 2000 - Norway
24 NIVA report no. 4468-2002
A
EROD in liver of cod
1 10 100 1000 30B-97 30B-98 30B-99 30B-00 36B-97 36B-98 36B-99 36B-00 15B-97 15B-98 15B-99 23B-97 23B-98 23B-99 23B-00 53B-97 53B-98 53B-99 53B-00 67B-97 67B-98 67B-99 67B-00 98B-00 10B-00 station-year B
EROD in liver of dab, flounder and plaice
1 10 100 1000 10000 LL_36F-99 LL_36F-00 LL_15F-99 PF_21F-99 PF_21F-00 PF_53F-99 PF_53F-00 PF_67F-99 PF_67F-00 PP_98F-00 PP_10F-00 species-station-year
Figure 12.Activity of cytochrome P4501A (EROD, pmol/min/mg protein) in liver from Atlantic cod (A) and flatfish (B - LL, st.15F, 36F), flounder (PF, st.21F, 53F, 67F) and plaice (PP, st.98F, 10F)) collected at the indicated stations from 1997 to 2000. Medians and quartiles (25%, 75%). Note logarithmic axis. Values for individual years (for cod) were standardised to median value at station 23B (in reality very close to real values expressed in pmol/min/mg protein). No values are available for 15B/F in 2000. Generally, stations 23B, 21F, 98B/F and 10B/F are considered less perturbed than stations 30B, 67B/F, 53B/F, with regard to planar organic contaminants.
1.4.4
Metallothionein in liver
For cod, different MT-analysis methods were used in 2000 (DPP) compared to 1997-1999 (ELISA).
Data from 1997, 1998 and 2000 are presented (Figure 13), however the samples from 1997-1999 are
being reanalysed. In 2000 higher MT concentrations were found (indicating metal exposure) in fish from all stations, compared to 1997 and 1998 due to the methodological differences, thus comparisons between 2000 and other years cannot be done.
There were no clear trends in the hepatic concentrations of the metal-binding protein metallothionein (MT) in cod from the six stations (xxB) in 1997, 1998 and 2000 and in flounder from two stations
(xxF) in 1999 and 2000 (Figure 13), and a number of unexpected relations between MT-levels at
different stations were recorded:
• For all years higher levels at st.67B/F than at the more contaminated 53B/F,
• In 1998 higher in outer Oslofjord (36B) than in the inner part (30B),
• In 1998 also highest MT at a reference station (23B) and lowest in the Oslofjord (36B, 30B),
• In 2000 next to lowest MT in cod from the generally contaminated inner Oslofjord
For flounder, MT-concentrations in 1999 and 2000 were significantly higher at st.67F in
Hardangerfjord, than st.53F in the Sørfjord (Figure 13).
MT-levels in plaice from 10F and 98F were low in 2000 compared to the other species.
This protein is induced by and binds the metals cadmium, zinc, copper and mercury, and differences in median metal concentration should indicate differences in exposure. However, for some metals the median concentrations was higher in cod liver from 67B than at 53B, in 1997 (copper, copper, cadmium and zinc) and 2000 (copper), likewise in flounder liver in 1999 and 2000 (copper and zinc). Furthermore; cod liver concentrated more metals at 36B than 30B in 1997 (cadmium, copper and zinc), and in 1998/2000 (copper and zinc) (Appendix H. ).
As for EROD, no adjustment has been made for sex, size or metal levels in tissues. Furthermore, differences between species have to be considered when comparing different areas.
1.4.5
Concluding remarks
The application of BEM methods within JAMP in previous years (1997 - 1999) has indicated that the location 15B, previously regarded as only diffusely polluted, has an input of PAH which is sufficient to markedly affect fish in the area. Chronic exposure to PAHs may lead to liver lesions and reproductive disorders in fish, as shown through National Ocean and Atmospheric Administration's (NOAA (USA)) studies in Puget Sound. The highest levels of PAH metabolites observed in the bile of cod from station 15B are high compared to other studies, but it is not at present possible to infer population effects on cod in the area. It would be relevant to include DNA adduct analyses at some stage to clarify whether the cellular repair system of cod is sufficient to protect against damage from PAH radicals.
Results for the period 1997-2000 clearly indicated that there are lead effects, shown by decreased activity of the enzyme ALA-D in the two most strongly polluted areas, i.e. cod from the inner Oslofjord (30B) and cod and flounder from the inner Sørfjord (53B/F).
New EROD-data (2000) indicate that Lofoten (98B) is the least contaminated station for cod. EROD analyses also indicated that cod from Varangerfjord (10B), presumed to be only diffusely
JAMP National Comments 2000 - Norway
26 NIVA report no. 4468-2002
A
Metallothionein in liver of cod
0 5 10 15 20 25 30B-97 30B-98 30B-99 30B-00 36B-97 36B-98 36B-99 36B-00 15B-97 15B-98 15B-99 23B-97 23B-98 23B-99 23B-00 53B-97 53B-98 53B-99 53B-00 67B-97 67B-98 67B-99 67B-00 98B-00 10B-00 station-year B
Metallothionein in liver of dab, flounder and plaice
0 10 20 30 40 50 LL_36F-99 LL_36F-00 LL_15F-99 PF_21F-99 PF_21F-00 PF_53F-99 PF_53F-00 PF_67F-99 PF_67F-00 PP_98F-00 PP_10F-00 species-station-year
Figure 13.Hepatic concentrations of metallothionein (MT, µg/mg cytosol protein) in liver from Atlantic cod (A) and flatfish (B - LL, st.15F, 36F), flounder (PF, st.21F, 53F, 67F) and plaice (PP, st.98F, 10F)) collected at the indicated stations from 1997 to 2000. Medians and quartiles (25%, 75%). Different analysis methods were used in 2000 compared to earlier years. The 1997-1999 material will be reanalysed. No values are available for 15F in 2000. Generally, stations 36B/F, 15B/F, 23B/21 98B/F and 10B/F are considered less perturbed than stations 30B, 67B/F, 53B/F with regard to cadmium, copper, mercury and zinc.
1.5
Effects and concentrations of organotin
Effects from organotin in dogwhelks (Nucella lapillus) and concentrations in dogwhelks and blue
mussels (Mytilus edulis) were investigated in two areas on the coast of southern Norway and along
the coast of northern Norway 2000.
Dogwhelks were sampled at four stations in the Haugesund area and one in outer Oslofjord (st.36G) in October 2000 (Appendix F. , Map 5), and from eight stations in the area Harstad - Mehamn in northern Norway during 2000 (Maps 17-22). As in 1999, there was a low abundance of dogwhelks at st. 226G and 226X in the Haugesund area. Station 226X is sampled close to, but on the opposite side of the sound to st. 226G. The snails were also scarce in Mehamn (st.48G) in northern Norway. Blue mussels were sampled from three stations in the Haugesund area, one in outer Oslofjord and one in inner Oslofjord area. TBT-induced development of male sex-characters in females, known as imposex (VDSI and RPSI), was analysed according to OSPAR-JAMP guidelines. Detailed information about
the chemical analyses of the animals is given in Følsvik et al. (1999).
1.5.1
Dogwhelks
Evident effects from organotin was in 2000 observed at all stations except outer Saughamneset (45G)
and Kifjordneset (47G) in northern Norway (Figure 14). Concentrations of organotin were also very
low (<7 µg Sn/kg d.w.) in snails from the two latter stations. Most heavily affected were snails from the Haugesund area (VDSI>4), and the highest organotin levels were also found in this area (>150 µg Sn/kg d.w., cf. Appendix L. ) 0 1 2 3 4 5 station 0 50 100 150 200
Figure 14. Concentrations of TBT (µg Sn/kg d.w.; circles) and imposex (VDSI; columns) in dogwhelks from 13 stations of the coast of Norway 2000. Station 226X is a new station sampled close to, but on the opposite side of the sound to st. 226G.
JAMP National Comments 2000 - Norway
28 NIVA report no. 4468-2002
Generally, there was an evident improvement in VDSI from 1991/1993 to 1997, but there has been
little change since then, and the conditions in the Haugesund area got slightly worse last year (Figure
15). The northern stations have not changed much either (Figure 15). Stations at Alta (44G) and
Honningsvåg (46G) had to be moved, and the apparent improvement at 44G might be a result from this station now being closer to the open sea. The two "reference" stations at outer Saughamneset (45G) and Kifjordneset (47G) are still very little affected by organotin.
A
B
Figure 15. Imposex (VDSI) in dogwhelks (Nucella lapillus) at 6 stations in southern Norway (A) and 8 stations in northern Norway (B), 1991-2000. Other investigations for data from 1991 (Harding et al. (1992) and 1993 and 1994 (Walday et al. 1997). (cf. Maps 2, 5, 17-22).
The development of the ‘relative penis size index’ (RPSI) is not consistent with the VDSI over the years and the variation from year to year is generally higher. Except for some of the northern stations, the Færder area (st. 36G) is the clearly least affected area considering the RPSI-index and 226G and 227G in the Haugesund area are the most heavily affected ones (cf.
Figure 16).
A
B
Figure 16. Imposex (RPSI) in dogwhelks (Nucella lapillus) at 6 stations in southern Norway (A)
and 8 stations in northern Norway (B). Other investigations for data from 1991 (Harding et al. (1992)
JAMP National Comments 2000 - Norway
30 NIVA report no. 4468-2002
1.5.2
Mussels
Three parallels were analysed for station 30A and 221A. Two parallels were analysed for 36A while one was analysed for 226A and 227A. Concentrations of organotin in mussels were high in most areas, except for the Outer Oslofjord (st. 36A), and highest in the harbour of Kopervik (221A) in the
Haugesund area, as it has been during the investigation period (Figure 17). Levels ranged between
34 and 747 µg Sn/kg d.w. (Figure 17 and Table 14 in Appendix L. ). According to the Norwegian
classification of environmental quality (Molvær et al. 1997) the inner Oslofjord- and two of the
Haugesund stations were markedly polluted with TBT, while outer Oslofjord and station 227A were moderately polluted. Generally, levels were lower at all stations compared to previous years.
0 300 600 900 1200 1500 1800 2100
30A 36A 221A 226X 227A
TBT as µg Sn/kg dw
Figure 17. Levels of TBT (µg Sn/kg d.w.) in blue mussels (Mytilus edulis) from parallels at five stations in Southern Norway in 1998 (?),1999 (?) and 2000 (x). Station 226X is a new station sampled close to, but on the opposite side of the sound to st. 226A (cf. Appendix F. , Map 2 and 5).
1.5.3
Concluding remark
The presence of organotin (as TBT) in Norwegian waters was still a problem in 2000. Concentrations of organotin in mussels and dogwhelks were elevated, and biological effects from TBT were found in dogwhelks from most of the investigated areas. Only exception were two reference stations in northern Norway. There is no clear improvement through the years according to imposex, but concentrations of TBT in mussels were lower than previous years. It is a cause for concern that the ban on the use of TBT in antifouling on boats <25 m of length has not lead to a clear improvement in the investigated areas.
1.6
Overall conclusions
In regards to JMP/JAMP Purpose A (health assessment), attention should be called to the list from Norwegian Food Control Authority (SNT) which names the restrictions and recommendations concerning the sale and consumption of seafood in Norway (Table 3).
In regards to JMP/JAMP Purpose C (spatial distribution assessment), the concentrations found in 2000 are indicated in the bar graphs shown in Appendix I. . Provisional “high background" levels were used to identify elevated concentrations. This initial assessment revealed no new areas of concern that are not currently under surveillance.
In regards to JMP/JAMP Purpose D (temporal trend assessment) there is evidence that the median concentrations of:
• Mercury in fish fillet from the inner Oslofjord has increased since 1984,
• Mercury in mussel from the outer Sørfjord has increased since 1987,
JAMP National Comments 2000 - Norway
32 NIVA report no. 4468-2002
Table 3. Summary of action taken by the Norwegian Food Control Authority (SNT, http://www.snt.no/nytt/tema/kosthold/kyst.html) concerning the consumption and sale of fish products along the Norwegian Coast. (Area designations from SFT, pers. comm. 2000).
Area of concern (km2) Last year of issue/ evaluat ion Main parameters of concern Main fish/shellfish product of concerned Recommendations or restrictions of concern:
Inner Oslofjord (190) 2000 PCB fish liver Consumption
Inner Drammensfjord (45) 1992 Dioxins/PCB fish liver Consumption and
Sale
Inner Sandefjordfjord (3) 1993 PCB round fish liver Consumption and
Sale Grenlandsfjords, Langesundsfjord
(84) 2000 Dioxins fish, shellfish Consumption and
Sale
Tvedestrand (2) 2000 PCB fish liver Consumption
Arendal (9) 2000 PCB fish liver Consumption
Inner Kristiansandsfjord (29) 2000 Dioxins/PCB fish, shellfish Consumption
Farsund (42) 2000 PCB PAH fish, mussels Consumption
Fedafjord (13) 1995 PAH mussels Consumption
Flekkefjord (3) 2000 PCB fish liver Consumption
Stavanger 2001 PCB PAH fish liver,
mussels
Consumption
Sandnes 2001 PAH mussels Consumption
Karmsund-Eidsbotn 2001 PCB 1) , PAH
fish liver, shellfish Consumption
Saudafjord (21) 1992 PAH fish liver,
mussels
Consumption
Sørfjord (80) 2001 Cd Pb Hg
PCB
fish, shellfish Consumption
Bergen area including Herdlefjord, Byfjord, Hjeltefjord, Grimstadfjord
and Raunefjord (180) 1998 PCB fish, shellfish Consumption and
Sale
Inner Årdalsfjord (8) 1995 PAH mussels Consumption
Inner Sunndalsfjord (15) 1993 PAH fish liver,
mussels
Consumption Hommelvik
(Trondheimsfjord) (5) 1985 PAH mussels Consumption
Inner Ranfjord (15) 1997 PAH Pb Hg mussels Consumption
Vefsnfjord (50) 1992 PAH mussels Consumption
Ramsund 2000 PCB fish, shellfish Consumption
Harstad (1) 2000 PCB heavy
metals
fish liver, mussels
Consumption
Tromsø (17) 2000 PAH mussels Consumption
Hammerfest (2) 2000 PAH mussels Consumption
Honningsvåg (2) 2000 PAH mussels Consumption
1) Concerns only Eidsbotn
Study of the power of temporal trend monitoring was useful in assessing existing sampling strategies,
however, modifications might be needed to account for local conditions (see Appendix O in Green et
al. 2000).
The 2000 investigation also includes results on Norwegian Pollution Control Authority Pollution Indices (Appendix J. ), and discussion of the results of biological effects methods including imposex and intersex (Chapter 1.4 and Chapter 1.5).
JAMP National Comments 2000 - Norway
34 NIVA report no. 4468-2002
The JAMP issues to which these investigations are relevant are shown in Table 4.
Table 4. JAMP issues relating to the Norwegian JAMP (cf., SIME 1997, Annex 11).
Subject JAMP issue Question Recent Norwegian
contribution Hg, Cd and Pb JAMP issue 1.2. What are the concentrations
and fluxes in sediments and biota?
1996-1997: Levels in sediment (cf.,
Green et al. 2000)
2000: Levels and trends in biota (annual investigations since 1981, Chapter 1.3)
2000: INDEX for blue mussels from selected stations (annual investigations since 1995, cf. Chapter 1.3.8)
TBT JAMP issue 1.3. To what extent do biological
effects occur in the vicinity of major shipping routes offshore installations, marinas and shipyards
2000: Levels and trends in mussels and snails (annual investigations since 1997, cf. Chapter 1.5)
PCBs JAMP issue 1.7. Do high concentrations pose
a risk to the marine ecosystem
[as for JAMP issue 1.2]
PCBs JAMP issue 1.8. Do high concentrations of
non-ortho and mono-ortho CBs in seafood pose a risk to human health?
1995: INDEX for blue mussels from selected stations (cf. Green 1997)
1996: Levels in cod (cf. Green et al.
2000)
PAHs JAMP issue 1.10. What are the concentrations
in the maritime 1) area?
1992: Levels in shellfish (Green et al.
1995)
1992-1993: Levels in fish and mussels for selected stations (Knutzen & Green 1995) 1996-1997: Levels in sediment (cf.,
Green et al. 2000)
2000: INDEX for blue mussels from selected stations (annual investigations since 1995, Chapter 1.3.8)
PAHs JAMP issue 1.11. Do PAHs affect fish and
shellfish?
1998: Biological effects methods in cod (cf. Chapter 1.4)
Other synthetic organic compounds
JAMP issue 1.12. How widespread are
synthetic organic compounds
within the maritime 1) area?
2000: Levels and trends in biota (annual investigations since 1983 of selected organochlorines, cf. Chapter 1.3)
1996: Introductory investigation of organochlorines in cod livers (cf.
Green et al. 2000)
Chlorinated dioxins and dibenzofuran s
JAMP issue 1.15. What concentrations occur
and have the policy goals (for the relevant parts of the
maritime 1) area) been met?
1995: INDEX for blue mussels from selected stations (cf. Green 1997) 1996: Introductory investigation of
organochlorines in cod livers (cf.
Green et al. 2000)
Biological effects of pollutants
JAMP issue 1.17. Where do pollutants cause
deleterious biological effects?
2000: Southern Coast, planar PCBs, metals, PAHs in cod (annual investigations since 1997, cf. Chapter 1.4)
Chemicals used
JAMP issue 5.3. In which areas do pesticides
and antibiotics affect marine biota?
2000: Levels and trends in biota (cf. Chapter 1.3)