Keizer, S., Foster, M. E., Wang, Z., and Lemon, O. (2014) Machine learning for
social multiparty human-robot interaction. ACM Transactions on Intelligent
Interactive Systems, 4(3), 14.
There may be differences between this version and the published version. You are
advised to consult the publisher’s version if you wish to cite from it.
© ACM 2014. This is the author's version of the work. It is posted here for your
personal use. Not for redistribution. The definitive Version of Record was
published in ACM Transactions on Intelligent Interactive Systems, 4(3), 14,
http://dx.doi.org/10.1145/2600021
.
http://eprints.gla.ac.uk/135666/
Deposited on: 30 January 2017
Enlighten – Research publications by members of the University of Glasgow
http://eprints.gla.ac.uk
Machine Learning for Social Multi-Party Human-Robot Interaction
SIMON KEIZER, Heriot-Watt UniversityMARY ELLEN FOSTER, Heriot-Watt University ZHUORAN WANG, Heriot-Watt University OLIVER LEMON, Heriot-Watt University
We describe a variety of machine learning techniques that are being applied to social multi-user human-robot interaction, using a robot bartender in our scenario. We first present a data-driven approach to social state recognition based onsupervised learning. We then describe an approach to social skills execution—i.e., action selection for generating socially appropriate robot behaviour—which is based onreinforcement learning, using a data-driven simulation of multiple users to train execution policies for social skills. Next, we describe how these components for social state recognition and skills execution have been integrated into an end-to-end robot bartender system, and we discuss the results of a user evaluation. Finally, we present an alternativeunsupervised learningframework that combines social state recognition and social skills execution, based on hierarchical Dirichlet processes and an infinite POMDP interaction manager. The models make use of data from both human-human interactions collected in a number of German bars and human-robot interactions recorded in the evaluation of an initial version of the system.
Categories and Subject Descriptors: G.3 [Probability and Statistics]: Probabilistic algorithms; H.5.2 [User Interfaces]: Natural language; I.2.6 [Learning]: Parameter learning; I.2.9 [Robotics]: Operator interfaces; I.2.10 [Vision and Scene Understanding]: 3D/stereo scene analysis
General Terms: Algorithms, Design, Performance
Additional Key Words and Phrases: Social robotics, machine learning, multi-user interaction ACM Reference Format:
Simon Keizer, Mary Ellen Foster, Zhuoran Wang, and Oliver Lemon, 2014. Machine Learning for Social Multi-Party Human-Robot Interaction.ACM Trans. Interact. Intell. Syst.V, N, Article A (January YYYY), 30 pages.
DOI:http://dx.doi.org/10.1145/0000000.0000000
1. INTRODUCTION
A robot interacting with humans in the real world must be able to deal with socially appropriate interaction. In many scenarios it is not sufficient to achieve only task-based goals: the robot must also be able to satisfy and manage the social obligations that arise during human-robot interaction. Building a robot to meet these goals presents a particular challenge for input processing and interaction management: the robot must be able to recognise, understand, and respond appropriately to social signals from multiple humans on multimodal channels including body posture, gesture, gaze, facial expressions, and speech. Since these signals tend to be noisy, an additional challenge is for the robot behaviour to be robust to uncertainty.
This work is supported by the EU FP7 project JAMES (Joint Action for Multimodal Embodied Social Systems, see http: //james-project.eu/), under grant no. 270435.
Authors’ address: Interaction Lab, School of Mathematical and Computer Sciences, Heriot-Watt University, Edinburgh EH14 4AS, United Kingdom.
Permission to make digital or hard copies of part or all of this work for personal or classroom use is granted without fee provided that copies are not made or distributed for profit or commercial advantage and that copies show this notice on the first page or initial screen of a display along with the full citation. Copyrights for components of this work owned by others than ACM must be honored. Abstracting with credit is permitted. To copy otherwise, to republish, to post on servers, to redistribute to lists, or to use any component of this work in other works requires prior specific permission and/or a fee. Permissions may be requested from Publications Dept., ACM, Inc., 2 Penn Plaza, Suite 701, New York, NY 10121-0701 USA, fax+1 (212) 869-0481, or [email protected].
c
YYYY ACM 2160-6455/YYYY/01-ARTA $15.00 DOI:http://dx.doi.org/10.1145/0000000.0000000
A customer attracts the bartender’s attention
ROBOT: [Looks at Customer 1] How can I help you? CUSTOMER 1: A pint of cider, please.
Another customer attracts the bartender’s attention
ROBOT: [Looks at Customer 2] One moment, please. ROBOT: [Serves Customer 1]
ROBOT: [Looks at Customer 2]
Thanks for waiting. How can I help you? CUSTOMER 2: I’d like a pint of beer.
ROBOT: [Serves Customer 2]
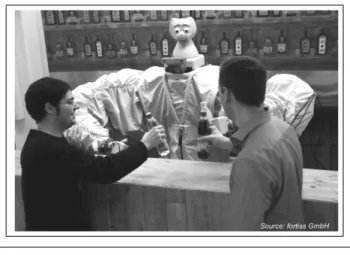
Fig. 1. A socially aware robot bartender
In the JAMES project,1we are investigating these challenges by developing a robot bartender (Figure 1) which supports interactions with multiple customers in a dynamic setting. The robot hardware consists of a pair of manipulator arms with grippers, mounted to resemble human arms, along with an animatronic talking head capable of producing facial expressions, rigid head motion, and lip-synchronised synthesised speech. The input sensors include a vision system which tracks the location, facial expressions, gaze behaviour, and body language of all people in the scene in real time, along with a linguistic processing system combining a speech recogniser with a natural-language parser to create symbolic representations of the speech produced by all users.
The target bartending scenario incorporates a mixture of task-based aspects (e.g., ordering and paying for drinks) and social aspects (e.g., managing simultaneous interactions, queuing, dealing with arriving and departing customers). For the current version of the system, we support interactions such as the one shown in Figure 1, in which two customers approach the bar, attract the robot’s attention, and order a drink. In subsequent versions, we will support extended scenarios involving a larger number of customers arriving and leaving, individually and in groups, and with more complex drink-ordering transactions.
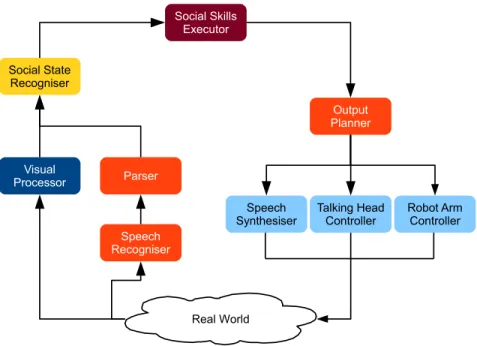
The architecture of the system is given in Figure 2: it includes components for audiovisual input and output generation, along with the two higher-level components that are the focus of this paper: the Social State Recogniser (SSR) and Social Skills Executor (SSE). The SSR processes an input stream of observations from the vision system, as well as speech input events from the speech recogniser and parser, to maintain a model of the social state. In Section 2, we discuss this component
in more detail, and show how it usessupervised learningas part of its processing. Whenever the SSR determines that a relevant change in the social state has occurred—for example, a customer approaches or leaves the bar, a new hypothesis arrives from the speech recogniser, or the robot finishes serving a drink to a customer—it publishes the updated state to the SSE. The SSE then determines how the the robot should respond to the updated state, resulting in specifications of communicative and/or non-communicative actions, which are sent to the Output Planner and finally realised through synthesised speech and/or actions of the robot head and arms (arrows to indicate the feedback signals from the output modules sent back to the SSR have been omitted to keep the diagram readable). In Section 3, we further discuss the Social Skills Executor and present an approach to automatically learning strategies for selecting socially appropriate robot responses based onreinforcement learning. This also includes a description of a data-driven multi-user simulation environment that was used for training such strategies.
Real World Visual Processor Speech Recogniser Parser Social State Recogniser Output Planner Speech
Synthesiser SynthesiserSpeech
Social Skills Executor
Talking Head
Controller Robot ArmController
Fig. 2. Architecture of the robot bartender system
After presenting the data-driven approaches for both social state recognition and social skills execution, we describe how these two components were integrated into the full robot bartender system, and present the results of a real user evaluation of the integrated system, comparing the data-driven version of each component with a hand-coded version (Section 4). In Section 5 we then discuss an alternativeunsupervised learningframework that combines social state recognition and social skills execution, based on hierarchical Dirichlet processes and an infinite POMDP interaction manager, as an alternative to the relatively traditional setup with separate components for state monitoring and action selection. The paper is concluded in Section 6 with a summary of the work, discussion of the results and directions for future work.
2. SOCIAL STATE RECOGNITION2
In the context of the JAMES robot bartender, the role of theSocial State Recogniser(SSR) is to turn the continuous stream of sensor messages produced by the low-level input-processing components into a discrete representation of the world, the robot, and all entities in the scene, integrating social, interaction-based, and task-based properties [Petrick and Foster 2013]. The SSR constantly monitors the state, and publishes a state-update event to the Social Skills Executor (SSE) every time there is a change which might require a response from the system. In addition to storing and discretising all of the low-level sensor information, the SSR also infers additional relations that are not directly reported by the sensors. For example, it fuses information from vision and speech to determine which user should be assigned a recognised spoken contribution, and estimates when customers are in a group. Most importantly in the current scenario—where one of the main tasks is to manage multiple simultaneous customers, as in Figure 1—the SSR must also inform the SSE every time a customer is seeking to engage with the robot bartender.
To classify engagement-seeking behaviour in the context of the JAMES bartender system, the SSR makes use of low-level sensor data published on two input channels. The computer vision system [Baltzakis et al. 2012; Pateraki et al. 2013] tracks the location, facial expressions, gaze behaviour, and body language of all people in the scene in real time, using a set of visual sensors including two calibrated stereo cameras and a Microsoft Kinect depth sensor. The data from the vision system is published as frame-by-frame updates multiple times a second. The other primary input modality in the system is linguistic [Petrick et al. 2012], combining a speech recogniser with a natural-language parser to create symbolic representations of the speech from all users. For speech recognition, we use the Microsoft Speech API together with the directional microphone array of a second Kinect; incremental hypotheses are published constantly, and recognised speech with a confidence above a defined threshold is parsed using a grammar implemented in OpenCCG [White 2006] to extract the syntactic and semantic information. For the current study, the following are the low-level sensor features for each customer that are used for the task of determining whether that customer is currently seeking to engage:
Location. The (x,y,z) coordinates in centimetres of the head, left hand, and right hand of the customer, where (0,0,0) corresponds to the centre of the bar.
TorsoAngle. The angle in degrees of the customer’s body, where 0 degrees indicates that the customer
is facing directly forwards.
Speaking. Whether the customer is currently speaking, as determined by the source angle from the
speech-recognition system together with the location information from the vision system. As in previous work, the SSR uses data-driven techniques to classify intended customer engagement based on these multimodal sensor features. The use of such techniques in this context was pioneered by Bohus and Horvitz [2009a; 2009b], who trained models designed to predict user engagement based on information from face tracking, pose estimation, person tracking, group inference, and recognised speech and touch-screen events. After training, their model was able to predict intended engagement 3–4 seconds in advance, with a false-positive rate of under 3%. A number of more recent systems have also used machine learning to address similar classification tasks. For example, [Li et al. 2012] estimated the attention state of users of a robot in a public space, combining person tracking, facial expression recognition, and speaking recognition; the classifier performed well in informal real-world experiments. [Castellano et al. 2012] trained a range of classifiers on labelled data extracted from the logs of children interacting with a chess-playing robot, where the label indicated either high engagement or low engagement. They found that a combination of game context-based and turn-based features could be used to predict user level engagement with an overall accuracy of approximately 80%. [McColl and Nejat 2012] automatically classified the social accessibility of people interacting with their robot based on their body pose, with four possible levels of accessibility: the levels
estimated by their classifier agreed 86% of the time with those of an expert coder. Finally, [MacHardy et al. 2012] classified the engagement states of audience members for an online lecture based on information from facial feature detectors; the overall performance on this binary classification task was around 72%.
2.1. Classification strategies
In the SSR we have implemented two strategies for estimating intended customer engagement using the sensor data: the first is based on a simple, hand-crafted rule derived from the observation of human-human interactions in a real bar, while the second was developed using supervised learning on an annotated human-robot corpus. In the current section, we give the details of the two classifiers; in the following section, we compare the performance of the two strategies through cross-validation on labelled sensor data gathered in the robot lab.
2.1.1. Hand-coded rule. The initial engagement classifier makes use of guidelines derived from the study of human-human interactions in real bars [Loth et al. 2013]. This analysis found two primary signals used by bar customers to signal that they wanted to engage with the bartender: (1) standing close to the bar, and (2) turning to look at the bartender. In a follow-up classification experiment based on still images and videos drawn from the natural data, these two signals also proved both necessary and sufficient for detecting intended customer engagement [Loth et al. 2013]. We therefore defined the following simple rule, which classifies the engagement-seeking state of a customerC
based on these two features of the vision data. The particular thresholds used were determined through informal empirical investigation in the robot bartender lab.
SeekingEngagement(C) := Location(C).head.z<30cm
∧ abs(TorsoAngle(C))<10◦
In other words, a customer is classified to be seeking to engage with the bartender if (1) their head is less than 30cm from the bar and (2) they are facing approximately forwards. Note that this rule is similar to the baseline heuristic used by [Bohus and Horvitz 2009b] to estimate engagement during online training.
2.1.2. Supervised learning.The engagement classifier described in the preceding section was designed to support the simple scenario in Figure 1, and was based on a simple, deterministic, hand-coded rule derived from the study of human-human interactions in the bartending domain. The rule-based classifier had reasonable performance in a user evaluation of the initial simple scenario [Foster et al. 2012]: no customer that was not seeking to engage with the bartender was incorrectly addressed, and 104 of 109 customers that were seeking to engage eventually received a drink, although some customers did have to wait some time or change position before the system detected them.
However, the robot bartender is currently being enhanced to support more complex scenarios, involving more customers, in groups as well as alone, with more complex needs, engaged in longer and more varied interactions: for the SSR, this will necessarily involve processing more complex messages from the updated input and output components, taking into account the associated confidence scores, and also dealing with the more complex state representations that are required by the updated high-level reasoning system. As the domain becomes more complex, a simple deterministic rule is no longer an appropriate method of mapping from low-level sensor data to high-level state properties. Instead, as in previous work, we will make use of supervised learning techniques, training the classifiers on annotated data gathered from humans interacting with both real and artificial bartenders. In this study, we are primarily interested in evaluating the utility of supervised learning for social state recognition in the robot bartender domain, and also in testing a range of classifier types to see which performs best with the particular input and output data required by the bartender. We therefore measure the off-the-shelf performance of a range of supervised classifiers on the same simple task as that covered by the hand-coded classifier: detecting customers that are seeking to engage with the bartender, based on the three low-level sensor properties listed above: location, torso angle and speaking. The classifiers are all trained on an annotated multimodal corpus based on the the logs and
video recordings resulting from users interacting with the initial robot bartender, which made use of the hand-coded engagement classifier described above.
Multimodal corpus.We based the multimodal corpus on the logs and video recordings of the first
user evaluation of the robot bartender [Foster et al. 2012]. The annotated multimodal corpus was created by processing the video recordings using the ELAN annotation tool [Wittenburg et al. 2006]. For each interaction, we annotated the engagement state of each customer visible in the scene, using the following three levels:
NotSeekingEngagement. The customer is visible, but does not need anything from the bartender.
SeekingEngagement. The customer is actively trying to engage with the bartender but has not been
acknowledged.
Engaged. The customer and the bartender are engaged in a drink-ordering transaction.
Note that after the bartender acknowledged a user’s bid for engagement, that user was labelled asEngageduntil the end of the interaction. For the current classification task—where we aim to determine whether the system should attempt to engage with a customer—theEngagedstate is not relevant, so for the corpus we considered only the time spans annotated as either NotSeekingEn-gagementorSeekingEngagement. The corpus was based on the frames published by the vision system during every such time span. For each frame, we created a separate corpus instance for each customer visible in the scene. An instance consisted of the relevant sensor data for that customer (location, torso angle, speaking status), along with the time-aligned label from the annotation data. This process resulted in a total of 5090 instances: 3972 in the categoryNotSeekingEngagement, and 1118 labelledSeekingEngagement.
Classifiers. Using the Weka data mining toolkit [Hall et al. 2009], we experimented with a number
of different supervised-learning classifiers to see which performed the best on this particular labelling task. Since we had no prior expectation about classifier performance, we chose a set of classifiers designed to provide good coverage of the types supported by Weka (Bayesian, rule-based, tree-based, functional, and instance-based), basing our selection on the classifiers used in the Weka primer.3The following classifiers were included:
CVR. Classifies using regression: the target class is binarised, and one regression model is built for each class value [Frank et al. 1998].
IB1. A nearest-neighbour classifier that uses normalised Euclidean distance to find the closest training instance [Aha et al. 1991].
J48. Classifies instances using a pruned C4.5 decision tree [Quinlan 1993].
JRip. Implements the RIPPER propositional rule learner [Cohen 1995].
LibSVM. Generates a Support Vector Machine using LIBSVM [Chang and Lin 2011].
Logistic. Multinomial logistic regression with a ridge estimator [le Cessie and van Houwelingen
1992].
NaiveBayes. A Na¨ıve Bayes classifier using estimator classes [John and Langley 1995].
ZeroR. Baseline classifier; always predicts the most frequent value.
Since the performance of the default Radial Basis Function kernel used by LIBSVM depends heavily on the value of theγparameter, which controls the width of the kernel [Hsu et al. 2010], we included two versions of this classifier: one using the default value of 0 (LibSVM-0), and one where γwas set to 0.0001 (LibSVM-1). All other classifiers were used in the default configuration provided by Weka version 3.6.8.
2.2. Evaluation
We carried out an offline experiment to compare the performance of the trained classifiers with each other and with that of the rule-based classifier. This study provides an indication of which
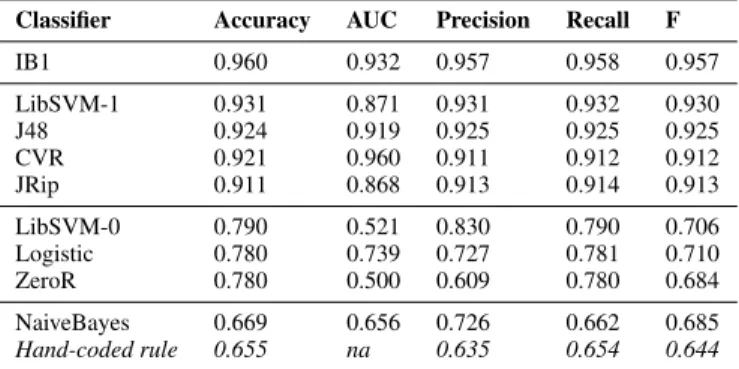
Table I. Cross-validation results, grouped by accuracy
Classifier Accuracy AUC Precision Recall F
IB1 0.960 0.932 0.957 0.958 0.957 LibSVM-1 0.931 0.871 0.931 0.932 0.930 J48 0.924 0.919 0.925 0.925 0.925 CVR 0.921 0.960 0.911 0.912 0.912 JRip 0.911 0.868 0.913 0.914 0.913 LibSVM-0 0.790 0.521 0.830 0.790 0.706 Logistic 0.780 0.739 0.727 0.781 0.710 ZeroR 0.780 0.500 0.609 0.780 0.684 NaiveBayes 0.669 0.656 0.726 0.662 0.685 Hand-coded rule 0.655 na 0.635 0.654 0.644
classification strategies are and are not suitable for the type of data included in the training corpus, and also tests the performance of the rule-based classifier on that same data.
2.2.1. Cross-validation. We compared the performance of all of the classifiers through 10-fold cross-validation on the training corpus. For each classifier, we computed the following measures: the overall classification accuracy, the area under the ROC curve (AUC), along with the weighted precision, recall, and F-measure. Note that the baseline accuracy score for this binary classification task is the size of the larger class (NotSeekingEngagement): 3972/5090 = 0.78. The results of this evaluation are presented in Table I, sorted by accuracy; the overall performance of the hand-coded rule on the full training corpus is also included. The groupings in Table I reflect differences among the accuracy scores that were significant at thep<0.01 level on a paired T-test based on 10 independent cross-validation runs. In other words, the IB1 classifier had the highest performance on this measure; the LibSVM-1, J48, CVR and JRip classifiers were statistically indistinguishable from each other; the LibSVM-0, Logistic, and ZeroR classifiers were again indistinguishable (these classifiers generally labelled all instances asNotSeekingEngagement); while the NaiveBayes classifier and the hand-coded rule had the lowest overall accuracy by a significant margin. Note that the overall ordering of classifiers is also similar when the other metrics are considered. Figure 3 shows the ROC curves for all classifiers based on theSeekingEngagementclass: as expected, the curves for all of the high-performing classifiers are close to optimal, while those for the other classifiers are closer to the chance performance of the baseline ZeroR classifier.
2.2.2. Attribute selection.The above cross-validation results made use of the full set of sensor attributes included in the corpus; however, it is likely that not all of the sensor data is equally informative for the classification task. To get a better assessment of which sensor data was most relevant to the current classification task, we carried out two forms of attribute selection. We first determined the sensor attributes that were the most informative for each of the individual classifiers, using a wrapper method [Kohavi and John 1997] to explore the relationship between the algorithm and the training data. We then analysed the corpus as a whole using Correlation-Based Feature Selection (CBF) [Hall 2000], a general-purpose selection method known to have good overall performance [Hall and Holmes 2003].
The results of this attribute selection process are shown in Table II. The main body of the table indicates with a bullet (•) the attributes that were determined to be most informative for each of the classifiers; for reference, the last row shows the two features that were used by the rule-based classifier (zface location and body orientation). The finalAcccolumn shows the cross-validation accuracy of a classifier making use only of the selected attributes. As can be seen, most of the high-performing classifiers made use of the full 3D location of the customer’s head, along with the location of the hands—particularly the right hand—and the “speaking” flag. The accuracy of most classifiers was very slightly better with the classifier-specific attribute subset when compared to the results from Table I, but in no cases was this improvement statistically significant. The bottom row
0 0.1 0.2 0.3 0.4 0.5 0.6 0.7 0.8 0.9 1 0 0.1 0.2 0.3 0.4 0.5 0.6 0.7 0.8 0.9 1 CVR IB1 J48 LibSVM-1 JRip Logistic NaiveBayes LibSVM-0 ZeroR
False positive rate
T ru e p o si ti ve r a te
Fig. 3. ROC curves forSeekingEngagementclass Table II. Output of attribute selection
Face HandL HandR Ori Spk Acc
x y z x y z x y z IB1 • • • • • • • • 0.963 LibSVM-1 • • • • 0.938 J48 • • • • • • • • • 0.932 CVR • • • • • • • • • 0.926 JRip • • • • • • • • 0.921 LibSVM-0 • • • 0.830 Logistic 0.780 ZeroR 0.780 NaiveBayes • • • • 0.786 Hand-coded rule • • 0.655 CBF • • • • • •
of the table shows the attributes that were found to be most informative by the CBF selector, which were similar to those used by the high-performing classifiers: namely, the full 3D position of the customer’s head, along with some of the hand coordinates.
2.3. Discussion
The cross-validation results indicate that nearly all of the trained classifiers significantly out-performed the hand-coded rule. The best-performing classifier based on accuracy was the instance-based IB1 classifier, which had an overall accuracy of 0.960 in frame-instance-based cross-validation, and also scored at or near the top on all other cross-validation measures. When we carried out feature selection, it was found that the most informative features were the 3D position of the customer’s head, along with some of the coordinates of their hands. It is notable that body orientation—which was one of the two main engagement-seeking signals found in the human-human data, and which was found to be necessary for making offline engagement judgements based on that same data [Loth et al. 2013]—was not determined to be at all informative by the feature selection process. This is most
likely due to technical issues with the initial vision system which was used in the interactions making up the corpus data: the body orientation was often either incorrect or not detected at all, making this attribute unreliable for classification. The unreliability of this signal also likely had a negative impact on the performance of the rule-based classifier on the cross-validation study. Note that most of the classifiers preferred the data from the right hand to that from the left: this preference likely arises from the tendency of right-handed customers to use that hand more often for gesturing, resulting in more informative vision data for that hand than for the left.
3. SOCIAL SKILLS EXECUTION
The task of social skills execution involves deciding what actions should be generated by the robot, given the recognised current social state. Such actions include both communicative actions (i.e., dialogue acts, such as greeting or asking a customer for their order), social actions (such as managing queuing), and non-communicative actions (typically, the physical handing over of a drink); the system must also decide how communicative actions are realised, i.e., which combinations of modalities should be used (speech and/or gestures). This decision-making process should lead to robot behaviour that is both task-effective and socially appropriate. An additional challenge is to make this decision-making robust to the generally incomplete and noisy observations that social state recognition is based on. In this light, automatic learning of such social skills in the face of uncertainty is particularly appealing.
Building on previous work on statistical learning approaches to dialogue management [Young et al. 2010; Rieser and Lemon 2011], we therefore model social skills execution as a Markov Decision Process (MDP) and use reinforcement learning for optimising action selection policies. Action selection in our multi-modal, multi-user scenario is subdivided into a hierarchy of three different stages with three associated policies. The first stage is concerned with high-level multi-user engagement management; the second stage involves deciding on response actions within an interaction with a specific user; and the final stage involves multimodal fission [Foster 2002], i.e., deciding what combination of modalities to use for realising any such response actions. Each of the policies provides a mapping from states to actions, where the state space is defined by features extracted from the recognised social state.
As in several reinforcement learning based approaches to dialogue management, we use simulation techniques for effective and tractable policy optimisation. For this purpose, a modal, multi-user simulated environment has been developed in which the social skills executor can explore the state-action space and learn optimal policies. The simulated users in the environment are initialised with random goals (i.e., a type of drink to order), enter the scene at varying times, and then try to order their drink from the bartender. At the end of a session, each simulated user provides a reward in case they have been served the correct drink, and penalties for each time-step it takes them to get the bartender’s attention, to place their order, and to be served. This reward function is based on the behaviour of customers interacting with the initial prototype of the robot bartender, who responded most strongly to task success and dialogue efficiency [Foster et al. 2012]. Policy optimisation in this setting then involves finding state-action mappings that maximise the expected long-term cumulative reward.
3.1. Social skills learning framework
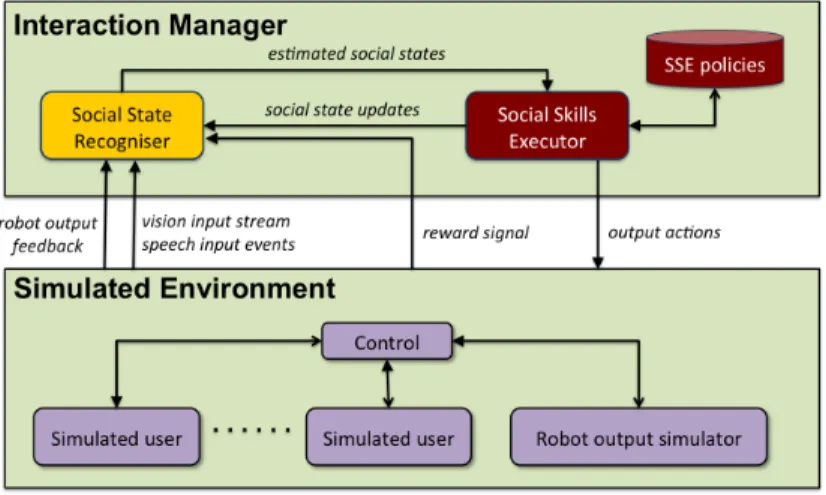
Our learning framework consists of two main parts: 1) anInteraction Manager (IM), which pro-cesses audio-visual input and generates multi-modal output actions for the system to execute, and 2) a
Multi-User Simulated Environment (MUSE). The architecture of the learning framework, shown in Figure 4, is similar to the full system architecture (Figure 2), in which the Social State Recogniser and Social Skills Executor together form the Interaction Manager, and the input and output modules are replaced by the simulated environment.
Before a fully operative version of the robot system became available (featuring the Social State Recogniser as described in Section 2), an initial version of the Interaction Manager was developed to progress our work on automatic learning of strategies for social interaction. This IM consists of a
Fig. 4. Architecture of the learning framework.
rule-based version of the SSR, which processes a stream of simulated vision observations and user dialogue acts, and an SSE that selects response actions, all of this on aframe-by-framebasis. This means that the SSR sends an updated social state to the SSE and the SSE selects a response action based on this state in every time-frame4. In contrast, theevent-basedSSR described in the preceding section only publishes a new state when it has decided that a relevant change has occurred. In this section we will discuss the frame-based IM, including training and evaluation results in simulation. In Section 4 we will present the event-based IM which was integrated into the full robot system, and present results from an evaluation with real users.
3.1.1. SSR for simulation. The rule-based SSR incorporates anengagement modelfor coordinating interactions with the (simulated) users in the scene, and atask modelfor interactions with individual users. The input observations are interpreted in terms of communicative actions, which are taken from a multi-dimensionaldialogue act taxonomyunderlying a recently developed ISO standard for dialogue act annotation [Bunt et al. 2010]. In a multi-party, situated setting, agents need to be able to initiate, maintain, and end engagements with other agents. For both the bartender system and simulated users, we use a finite state engagement model driven by dialogue acts and gaze behaviour (see Figure 5). If a user conveys an intention to engage with the system (i.e., bids for the system’s attention), this is represented by the dialogue actattentionFeedbackElicitation, which changes the engagement state fromn o n-e n g ag e dto Us rSe e k i n gEn g ag e m e n t. Only after the system has accepted the bid for attention (through anattentionAutoPositiveact), are the user and system considered to be e n g ag e d. The system may however choose to continue an interaction with another, engaged, user, and so the engagement state remains Us rSe e k i n gEn g ag e m e n t, unless the user stops seeking engagement and the state transitions back to n o n-e n g ag e d. This makes the model different from Bohus and Horvitz’ engagement model, which only distinguishes between thee n g ag e dandn ot-e n g ag e dstates. Once an interaction is closed, the agents can simply look away if they want to disengage. Note that in Section 2, the classification of engagement states (ignoring that state in which the system is seeking attention) is performed directly on the basis of input signals, without identifying an intermediate level of communicative engagement actions.
The maintained social state contains models for each user in the social scene. Every such user model contains information about the user’s engagement state, their location (e.g., are they standing at the bar?), the user goal (what kind of drink do they want?), and whether they have been served a drink yet.
4The frames here are associated with the frames of the vision output, but can be generated faster than in real time; duration of
Fig. 5. Finite state engagement model.
3.1.2. Social skills executor.The frame-based Social Skills Execution (SSE) component determines the system’s behaviour, based on the current social context. The output actions include both abstract communicative and non-communicative acts, as well as descriptions of their multi-modal realisations. The generated communicative actions have the form of dialogue acts from the taxonomy mentioned above [Bunt et al. 2010], and are associated with combinations of modalities to use for realisation, for example, a greeting can be realised by combinations of speech (“Hello”) and nodding (robot head movement). In the current system, non-communicative actions are limited to physically putting a bottle with a particular type of drink in front of the user (as part of serving a drink). In Section 3.2 and Table VI, the supported actions are listed.
The decision-making process consists of three main stages: 1)social multi-user coordination: managing the system’s engagement with the users present in the scene (e.g., accept a user’s bid for engagement, or proceed with an engaged user), 2)single-user interaction: if deciding to proceed with an engaged user, generating a high-level response to that user, in the form of a communicative act or physical action (e.g., serving a drink) and 3)multi-modal fission: selecting a combination of modalities for realising a chosen response (e.g., speech and/or head gestures). One advantage of such a hierarchical design is that strategies for the different stages can be developed independently. Another is that it makes automatic policy optimisation more scalable. Note that the hierarchy of decision-making is followed in each time-frame, and that the realisation of an action has a certain duration, measured as a number of time-frames. The IM therefore not only processes input signals on a frame-by-frame basis, but also makes a decision about what to do in every frame. This is also the case for the Simulated Environment discussed below.
3.1.3. Multi-user simulated environment.To provide a testing environment for the Interaction Man-ager, we developed a multi-user simulated environment (MUSE). Not only can this environment be used for testing and evaluating the IM; it can also be used for training action selection policies for the Social Skills Execution (SSE) component of the IM. The MUSE allows us to rapidly explore the large space of possible states in which the SSE will have to select actions. A reward function that incorporates individual rewards from all simulated users in the environment is used to encode preferred system behaviour in a principled way. A simulated user assigns a reward if they are served the correct drink, and gives penalties associated with their waiting time and various other forms of undesired system responses (see Section 3.2 for the definition of reward). All of this provides a practical platform for evaluating different strategies for social behaviour and also paves the way for automatic optimisation of policies, for example by using reinforcement learning techniques, as we will discuss in Section 3.2.
The simulation environment replaces the vision and speech processing modules in the actual robot bartender system, which means that it generates 1) vision signals in every time-frame, and 2) speech processing results, corresponding to sequences of time-frames where a user spoke. The vision observations contain information about users that have been detected, where they are in the scene, whether they are speaking, and where their attention is directed to. Speech processing results are represented semantically, in the form of dialogue acts. The SSR fuses the vision and speech input, for example to associate an incoming dialogue act with a particular user.
The simulated signals are the result of combining the output from the simulated users in the environment. Each simulated user is initialised with a goal, enters the scene, and starts bidding for attention. As with the SSE component, the simulated users also maintain a state and based on that state, generate responses at an abstract level as well as lower-level multimodal realisations of these responses; all of this activity takes place on a frame-by-frame basis. The high-level behaviour is consistent with the typical human customer behaviour observed in a corpus of human-human customer-bartender data [Loth et al. 2013]. For the simulation of lower-level multimodal realisations, probabilities for different possible combinations of modalities (speech and/or gestures) for each communicative action have been derived from the corpus.
Additionally, the simulated users start with a givenpatience level, which is reduced in every frame that the user is bidding for attention or being served by the system. If a user’s patience has reduced to zero, s/he gives up and leaves the bar. However, it is increased by a given fixed amount when the system politely asks the user to wait, encoded as apausingdialogue act.
MUSE also provides feedback about the execution of robot actions. Since the execution of actions has a duration in this framework, it is relevant for the IM to know when actions have been completed (or interrupted). This type of information simulates the feedback that is provided in the actual bartender system by a robot controller.
3.2. Policy optimisation in social interaction
To set up automatic optimisation of strategies for social interaction, we designed two Markov Decision Processes (MDPs), corresponding to thesocial multi-user coordinationandsingle-user interaction
stages, discussed in Section 3.1.2. Both MDPs have their own state spacesS1andS2, each defined by a set of state features, extracted from the social state that was estimated by the SSR, see Tables III and V. They also have their own action setsA1andA2, corresponding to the range of decisions that can be made at the two stages, see Tables IV and VI, and two policiesπ1 : S1 → A1 and π2:S2→ A2, mapping states to actions.
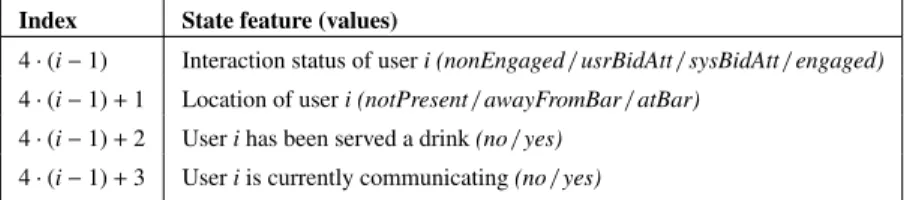
Table III. State features for thesocial multi-user coordinationpolicy. For each user, 4 features are included in the state space, which means that there are4·3·22=48states for 1 user, increasing to2304states for 2 users and110,592states for 3 users.
Index State feature (values)
4·(i−1) Interaction status of useri (nonEngaged/usrBidAtt/sysBidAtt/engaged) 4·(i−1)+1 Location of useri (notPresent/awayFromBar/atBar)
4·(i−1)+2 Userihas been served a drink(no/yes) 4·(i−1)+3 Useriis currently communicating(no/yes)
The two MDPs share the same reward function, which specifies the reward received from the environment in every time-frame, and is the sum of the rewardsRidefined for each individual useri:
Ri = 350·T Ci−2·Wi−T Oi−S Pi (1)
whereT Ci(Task Complete) is a binary variable indicating whether the user was able to order a drink
and the drink was served,Wi(Waiting) is a binary variable indicating whether the useriis ready
to order, but not yet engaged with the system,T Oi(Task Ongoing) is a binary variable indicating
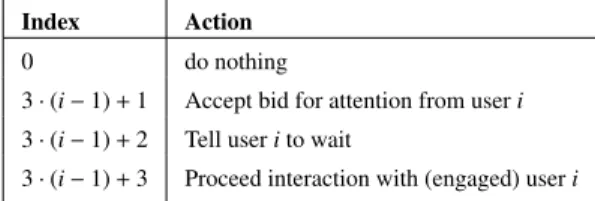
Table IV. Actions for thesocial multi-user coordinationpolicy.
Index Action
0 do nothing
3·(i−1)+1 Accept bid for attention from useri 3·(i−1)+2 Tell userito wait
3·(i−1)+3 Proceed interaction with (engaged) useri
Table V. State features for thesingle-user interactionpolicy. In this case, there are4·7=28states. Index State feature (values)
0 Reactive pressure(thanking/greeting/apology/none)
1 Status of user goal(unknown/drinkServed/usrInf/sysExpConf/sysImpConf/grounded/other)
Table VI. Actions for thesingle-user interaction policy, which correspond to possible dialogue acts, except for disengaging and serving a drink. The specific drink types required for two of the actions are extracted from the fully specified user goal in the social state maintained by the IM.
Index Action Example
0 acceptThanking() “You’re welcome” 1 returnGreeting() “Hello”
2 autoPositive() “Okay”
3 autoNegative() “Sorry?”
4 setQuestion(drink) “What would you like?” 5 propQuestion(drink=x) “Do you want x?” 6 serveDrink(x) (serve drink of type x)
7 disengage() (look away)
(Social Penalties) represents various social penalties, such as when the system turns his attention to another user while useriis still talking to him. The weights on each of these rewards are currently determined manually by the system designer. An alternative, more data-driven, approach would be to use previously recorded evaluation data to derive a reward function that optimally correlates with user satisfaction, measured using a questionnaire [Rieser and Lemon 2011].
The policies are encoded as functions that associate a value to each state-action pair; these so-calledQ-valuesare estimates of the long-term discounted cumulative reward (based on the immediate rewards received in every time-frame). Given the current state, the policy selects the action with the highest Q-value:
π(s)=arg max
a
Q(s,a) (2)
Using a Monte-Carlo Control algorithm [Sutton and Barto 1998], the policies are optimised by running the IM against the MUSE and using the received reward signal to update the Q-values after each interaction sequence.
3.3. Evaluation
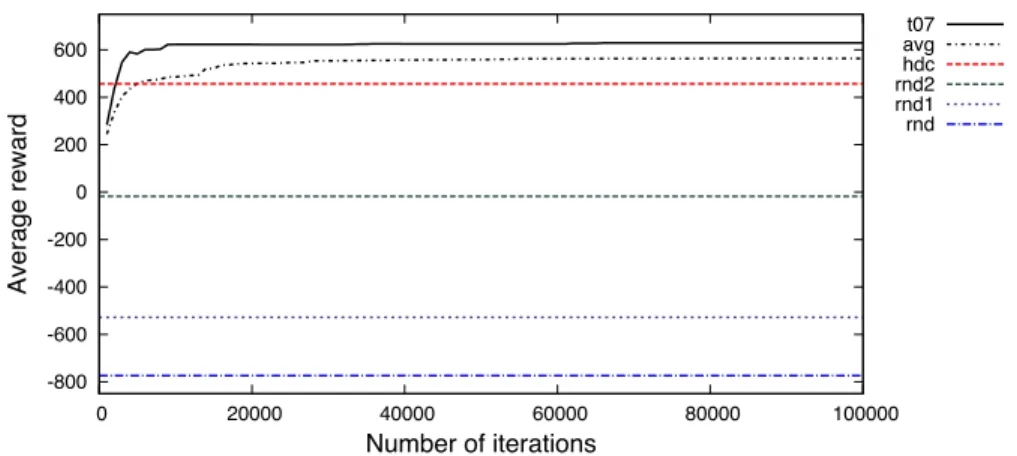
To evaluate this learning methodology, we ran 10 policy optimisations in interaction with the MUSE running two simulated users. Each optimisation was carried out over 250kiterations, starting with an exploration rate of=0.2, discounted after every 1000 iterations with a factor 0.98. Each iteration corresponds to one session, by which we mean a complete scenario in which the two users enter the scene and attempt to order a drink, successfully or not. When updating the Q-function with the total
reward obtained at the end of a session, a discount factor ofγ=0.995 is applied. In traditional turn-based interactions, smaller discount factors (e.g.γ=0.95) are more usual, but for the frame-based interactions considered here, the trajectories are relatively long, and so a relatively high discount factor is more appropriate. After every 1000 iterations, the learned policy was saved and evaluated by running 2000 sessions with the MUSE, using the fully discounted exploration rate of=0.001.
-800 -600 -400 -200 0 200 400 600 0 20000 40000 60000 80000 100000 Average reward Number of iterations t07 avg hdc rnd2 rnd1 rnd
Fig. 6. Results from a 2 user SSE policy optimisation in terms of average reward, showing learning curves for the best policy (t07) as well as the average over 10 optimisations, and the performance levels of the strategies that use random policies for one or both of the decision stages (rnd1,rnd2, andrnd), and of a hand-coded strategy (hdc).
Figure 6 shows the training results in terms of average reward. The learning curve of the best policy found is shown (t07), as well the average performance over the 10 optimisations at different stages of training (avg). In addition to the learned policies, we also evaluated the system when running a random policy for one (rnd1andrnd2) or both (rnd) of the action selection stages, and finally, a fully hand-crafted version of the SSE (hdc).
Table VII. Performance of SSE strategies in terms of Success Rate (SR) and Average Reward (AR) with95%confidence intervals (CI), evaluated over 5000 sessions.
Strategy Description SR AR (CI)
hdc hand-coded using pausing acts 93% 456.72 (±4.24) hdcNP hand-coded without pausing acts 87% 446.01 (±5.08) t07 best trained policy 100% 630.19(±1.47) rnd both policies random 7% −774.44 (±7.06) rnd1 1st stage policy random 28% −527.75 (±9.86) rnd2 2nd stage policy random 46% −17.72 (±13.81)
The results indicate that the optimisation is effective and on average converges after about 60k iterations. After about 5000 iterations, the learned policies on average start to outperform the hand-coded system. In noise-free conditions and high user patience levels (250 frames), the hand-hand-coded system achieves a 100% success rate, which is equalled by the performance level of a policy that is optimised under these conditions. As the patience levels are reduced (to 175 frames), it becomes more difficult to hand-code an effective strategy for managing the users’ patience. The overall results are summarised in Table VII, in which we also listed an alternative hand-coded policy (hdcNP). In contrast tohdc, this policy does not include asking a second user to wait, before continuing to serve a user that it was already interacting with. In this particular setting of the MUSE, thehdcstrategy
is more successful (93% vs 87%). In an alternative setting where the impact of a pausing act by the system on the users’ patience levels is reduced (from 40 to 15 frames to be added to a user’s patience level upon receiving a pausing act), the success rate of thehdcstrategy has dropped to 81% and so the the alternative strategyhdcNP is more successful (87% vs 81%). Using a policy that can be optimised, the best strategy for managing user patience is found automatically and generally outperforms the hand-coded strategies. In terms of success rate, the optimised strategyt07achieves a relative improvement of 15% overhdcNPand 7.5% overhdc.
We also carried out an experiment in which noise was added to the speech input by confusing the speech act types at various rates. Figure 7 shows the performance of three strategies at semantic confusion rates5varying from 0% to 40%: the hand-coded (hdc) and trained (t07) policies from before, and in addition a policytra25that was trained at a confusion rate of 25%. The latter strategy clearly outperforms bothhdcandt07at higher confusion rates, and is only slightly worse thant07at the lowest confusion rates. Note that none of the compared policies use explicit actions for handling uncertainty, such as clarifications; this was a preliminary experiment merely to show that by simply retraining the policy in noise one can automatically find a robust strategy, whereas additional (and potentially rather tedious) handcrafting is required to improve the initial hand-coded strategy. This advantage is expected to be even stronger if the system would include dedicated actions for handling uncertainty. The trained policy would then have an optimised strategy for when to clarify something and when to trust its most likely input hypotheses.
100 200 300 400 500 600 700 0 5 10 15 20 25 30 35 40 Average reward Confusion rate tra25 t07 hdc
Fig. 7. Sensitivity of SSE strategies to noise (speech only).
3.4. Discussion
The experiments on policy optimisation described here have demonstrated the feasibility of this approach in an MDP setup, i.e., under the assumption that the recognised social states are correct. The trained strategies perform at least as well as a hand-coded strategy, which achieves a 100% success rate in noise-free conditions when using simulated users which are very patient (i.e., they keep trying to make an order until the session is ended externally by the simulated environment). The trained system starts to outperform the hand-coded system when the simulated users are set to be less patient (i.e., they give up after a maximum number of time-steps) and/or when noise is added to the input.
An important current goal is to make more use of collected human-human and human-machine data to make the user simulation as realistic as possible, and therefore to ensure that the trained social skills executor is more likely to perform well in interaction with real users. In Section 4 we give an initial analysis of the coverage of the simulation, based on data from a real user evaluation of the
5The confusion rate in our case refers to the probability of changing the type of the true speech act to simulate noisy speech
trained system. A further goal is to explicitly represent the uncertainty underlying the social state recognition process, and to exploit this uncertainty in a POMDP framework for more robust social skills execution.
The approach described in this section is the first approach to human robot interaction that supports automatic learning of strategies for multi-user social interactions using an MDP framework. There has been some prior research on using machine learning techniques in human-robot interaction, though not for multi-user interactions. One such approach involved modelling the interaction as a Semi-Markov Decision Process (SMDP) and using Hierarchical Reinforcement Learning (HRL) for optimising decision-making [Cuay´ahuitl and Dethlefs 2011; Cuay´ahuitl et al. 2010]. An alternative approach to using multiple policies within a dialogue manager has also incorporated POMDP models, but still focused on single-user interactions [Lison 2011]. A non-statistical, rule-based approach to multi-user human robot interaction has been developed and demonstrated with a Nao robot [Klotz et al. 2011].
4. USER EVALUATION
In the previous section we described a framework for training and evaluating strategies for social multi-user interaction in simulation. In this version, the communication of social state updates from the Social State Recogniser (SSR) to the Social Skills Executor (SSE) happened on a frame-by-frame basis. For the full robot bartender system, however, the event-based SSR as described in Section 2 was used, which only publishes new social states if a relevant change occurred. The learning framework was therefore been adapted to incorporate this new SSR, and the SSE is hence triggered by state updateevents, and—as described in more detail in [Keizer et al. 2013a]—new policies for this setup were trained using MUSE.
Once the components were integrated into the overall system, we carried out a user evaluation designed to compare the trained versions of the SSR and the SSE to their hand-coded counterparts. Full details of the user study are presented in [Foster et al. 2013; Keizer et al. 2013a]; in summary, each of the sessions carried out involved two customers approaching the bartender and trying to order a drink. After each interaction, the subjects filled out the short questionnaire shown in Figure 8. Q1: Did you successfully order a drink from the bartender? [Y/N]
Please state your opinion on the following statements:
[ 1:strongly disagree; 2:disagree; 3:slightly disagree; 4:slightly agree; 5:agree; 6:strongly agree ] Q2: It was easy to attract the bartender’s attention [1–6]
Q3: The bartender understood me well [1–6]
Q4: The interaction with the bartender felt natural [1–6] Q5: Overall, I was happy about the interaction [1–6]
Fig. 8. Questionnaire from the user study.
37 subjects took part in this study, resulting in a total of 58 recorded drink-ordering interactions: 29 that used the hand-coded SSE strategy, and 29 that used the trained strategy. The SSR policy was also manipulated, so that 26 interactions used the rule-based classifier, while 32 used the trained IB1 classifier (which had the highest performance on the cross-validation study in Section 2). There was no significant interaction between these two manipulations, so in the remainder of this section, we present the results for the two comparisons separately. At the end, we also discuss how the distribution of states in the user study compares to the distribution found in the simulated environment. 4.1. Comparison of SSR classifiers
To compare the SSR classifiers, we computed several objective measures specifically addressing the interactive performance of the engagement classifiers, in addition to the overall subjective questionnaire. We collected the following objective measures:
Detection rate. How many of the customers detected in the scene were classified as seeking to engage.
Initial detection time. The average delay between a customer’s initial appearance in the visual scene
and the time that they were considered to be seeking engagement.
System response time. The average delay between a customer’s initial appearance in the visual scene
and the time that the system generated a response to that customer.
Drink serving time. The average delay between a customer’s initial appearance in the visual scene
and the time that the system successfully served them a drink.
Number of engagement changes. The average number of times that the classifier changed its estimate
of a user’s engagement-seeking state over the course of an entire experiment run.
Table VIII summarises the objective results, divided by the classifier type. We analysed the data using a linear mixed model, treating the participant identifier as a random factor, with the classification strategy and all demographic features included as fixed factors. This analysis found that the effect of the classification strategy on the number of changes in estimated engagement was significant at thep<0.05 level; however, while the numbers in Table VIII suggest that the trained classifier was somewhat more responsive, none of those differences were found to be significant. These results are difficult to interpret, for two main reasons: (1) all of the customers were explicitly instructed to seek the attention of the bartender, so the classifiers were not tested with any true negative examples, and (2) the ground-truth data about the customers’ actual engagement behaviour was not available, so it is impossible to know which of the classifiers actually a better job of estimating engagement in practice.
Table VIII. Objective results for the SSR comparison (significant difference highlighted)
Measure Rule-based SSR (sd) Trained SSR (sd)
Detection rate 0.98 (0.10) 0.98 (0.09)
Time to first detection 5.4 (7.9) 4.0 (9.7) Time to system response 7.0 (7.9) 6.4 (10.4) Time to drink served 62.2 (22.2) 53.7 (14.0) * Num. engagement changes 12.0 (10.2) 17.6 (7.6)
4.2. Comparison of SSE policies
Table IX. Overview of system performance results from the experiment. In the leftmost column SSE-TRA and SSE-HDC refer to the trained and hand-coded SSE versions; the column NS indicates the number of sessions; the columns PSucc (perceived success), PAtt (perceived attention recognition), PUnd (perceived understanding), PNat (perceived naturalness), and POv (perceived overall performance) give average scores resulting from the 5 respective questionnaire questions; NDSrvd indicates the average number of drinks served per session (out of 2 maximum – the percentage is given in brackets); NST indicates the average number of system turns per session; while NBAsr indicates the average number of cases where the user speech was ignored because the ASR confidence was below a predefined threshold. The marked column indicates that the difference between the two SSE versions was significant at thep<0.05level.
System NS PSucc* PAtt PUnd PNat POv NDSrvd NST NBAsr
SSE-TRA 29 97% 4.10 4.21 3.00 3.83 1.97 (98.5%) 7.38 3.14 SSE-HDC 29 79% 4.14 3.83 2.93 3.83 1.76 (88.0%) 6.86 3.82
TOTAL 58 88% 4.12 4.02 2.97 3.83 1.86 (93.0%) 7.12 3.48
The results from the SSE comparison are summarised in Table IX. Again, we analysed the results using a linear mixed model, treating the SSE policy as a fixed factor and the subject ID as a random
factor. The subjective scores suggest a slight preference for the trained SSE, though this is only statistically significant in terms of perceived success (p<0.05). The interactions with the trained SSE took slightly longer than the ones with the hand-coded SSE in terms of the number of times the SSE was triggered during an interaction and selected a response action. This is probably due to the fact that with the trained strategy the system always explicitly asked the user for their order, whereas the hand-coded strategy would randomly decide between letting the user take the initiative to order, and directly asking for the user’s order.
4.3. Validation of simulated environment
As an initial analysis of the validity of the simulated environment, we compared the distribution over states generated by the simulation with that of the observed human user evaluation data. In terms of coverage, we found that only 46% of all states encountered in the real data were also encountered during training. However, many of these states occurred very rarely, and many of them do not require any action by the robot; we can deal with such cases by setting a default policy decision of taking no action. If we only include states that have been encountered at least 20 times, the coverage increases to over 70%, and full coverage is obtained when only considering states that were encountered at least 58 times, though admittedly this covers only the 10 most frequently encountered states. The similarity of the two distributions can be quantified by computing the KL-divergence, but since such a number is hard to interpret in itself, this will only be useful if there were a state distribution from an alternative simulator or an improved version of MUSE for comparison.
5. AN UNSUPERVISED LEARNING FRAMEWORK
As an alternative to the supervised approaches to social state recognition and social skills execution, which both require labelled data for training, we have also developed a non-parametric Bayesian framework for automatically inferring social states in an unsupervised manner [Wang and Lemon 2012], which can be viewed as a natural fusion of multimodal observations. Furthermore, existing POMDP-style interactive systems are usually turn-based, where belief state updates are only consid-ered following explicit system actions, and without taking into account implicit user state transitions. This simplification underestimates the complexity of multimodal communication, where humans can autonomously generate important state transitions without intervening system actions.
Head Gesture Hand Gesture Speech Attention nod one hand speaking inform(drink)
to bartender to object (task relevant)
00:00:19.3 00:00:22.1
Fig. 9. Example of a multi-channel observation stream from a corpus of human-human interactions.
Figure 9 shows an example of multiple input streams observed in a corpus of human-human multimodal interactions in our robot bartender domain [Loth et al. 2013]. A human agent could start from a miscellaneous state without attempting to be involved in an interaction with the robot bartender. Then at some point, they may decide to request the bartender’s attention to start an interaction (e.g. to order a drink). In this case, there must be a mechanism in the system to allow (belief) state updates even though no explicit system action is performed. Traditional approaches could rely on predefined trigger events to handle this situation. However, as discussed in Section 2, in Human-Robot Interaction (HRI) the observations are multimodal: i.e. as well as speech inputs, a user’s intention could also be realised by various nonverbal behaviours, such as hand gestures, body postures, facial expressions, and/or gaze, which the robot controller would receive from a vision
system frame-by-frame as an event stream. Unlike in traditional turn-based spoken dialogue systems, where the boundary of a user state can be identified by observing silence durations above a certain length in the speech input (i.e. the“end of speech” signal), the trigger events to segment user states in such multimodal observations are more difficult to recognise. For example, the user state “request for engagement” can be realised by “looking at the bartender” until a system response is received, which means that the state duration varies and there may not be an obvious boundary for such a state to trigger the system’s action planner. Hence, the timing of system actions is also a non-trivial issue in such a real-world HRI task. Although incremental methods with belief tracking [Selfridge et al. 2012] could address the above issues, in the multimodal interaction case there is a further question of how many states would be adequate to yield good planning performance. It is not generally possible to establish the optimal number of states a priori.
Therefore, in this work, we adopted the infinite POMDP (iPOMDP) model [Doshi-Velez 2009] that does not require prior knowledge of the size of the state space, but rather lets the model grow to accommodate the data, and developed an extended version of it, in order to better address state persistence, implicit state transitions, and timing issues. The resulting“sticky” iPOMDPis biased towards self-transitions for implicitnullsystem actions. The proposed approach works on frame-based observations and offers a unified framework to jointly solve the state persistence, implicit transition, and time-dependent action selection problems.
5.1. Hierarchical Dirichlet Process, HDP-HMM and Infinite POMDP
The Dirichlet Process (DP) is a measure on measures, used in Bayesian nonparametric mixture models for clustering data. Denoted by DP(α0,G0), it has two parameters, a scaling parameterα0>0 and a base probability measureG0. A draw from a DPG∼DP(α0,G0) is a discrete distribution and has the formG=P∞
k=1βkδφk, whereφkare independent random variables distributed according toG0,
δφk is an atom atφk, andβkare random weights drawn from a stick-breaking process parameterised
byα0[Sethuraman 1994]. The Hierarchical Dirichlet Process (HDP) [Teh et al. 2006] extends the DP to address the problem of sharing clusters among multiple related data groups. If one assumes that the data are subdivided into a number of groups, and within each groupi, it can be modelled by a distributionGidrawn from a group-specific DP, then a HDP links those group-specific DPs by
letting them share a common base measureG0asGi∼DP(α0,G0), whereG0itself is drawn from a DP (i.e.G0∼DP(γ,H), whereγ >0 is a scalar parameter andHis the global base measure).
Due to the recursive definition, HDPs can be further extended to multiple hierarchical levels, for which a useful example application is the infinite Hidden Markov Model (iHMM, also known as HDP-HMM) [Beal et al. 2002; Teh et al. 2006]. Letting the observations given a state be drawn from a mixture model, HDP-HMM is a nonparametric Hidden Markov Model (HMM) defined by simply replacing the set of conditional finite mixture models underlying the classical HMM with an HDP mixture model. The HDP-HMM has been proven to be a powerful tool for inferring generative models from sequential data. It is a natural adaptation to apply techniques developed for HMMs to infer the hidden states and model parameters of POMDPs [Chrisman 1992]. Doshi-Velez [2009] directly extends the iHMM to model the transition and observation probabilities in a POMDP, yielding the infinite POMDP.
5.2. The Multimodal “Sticky” Infinite POMDP
To adapt the iPOMDP to the multimodal case, one essential challenge is to construct a joint distribution function for the multiple channels of observations. Such observations are usually presented using different representations. For example, a common representation for speech inputs is an n-best list of parsed dialogue acts, each with a normalised confidence score [Williams and Young 2007; Thomson and Young 2010]. However, gesture and facial expression recognisers tend to provide continuous (frame-based in practice) streams of events with discrete values. On the other hand, the gaze, face orientation and position (3D coordinates) information of a human agent can be in the form of streams with continuous values. Therefore, we have to define a distribution for every observation channel and let the joint observation distribution be their tensor products. This setting essentially assumes that the
observation channels are independent of each other, hence the conditional observation probability for each channel (conditioned on every state) can be modelled separately, and the joint observation probabilities are computed simply as the product of the observation probabilities of each channel.
Distributions of different forms can be utilised to capture different representations of observations. For example, the Bernoulli distribution that has a conjugate Beta prior is a natural choice to model binary discrete events, such as gesture occurrences. When generalised to the multivariate case, it also models the occurrences of events in n-best lists, where respective Beta distributions can be used conjunctively to draw the associated (normalised) confidence scores. (Although Beta likelihood does not have a conjugate prior, one can either employ Metropolis-Hastings algorithms [Metropolis et al. 1953; Hastings 1970] to seek a target posterior [Hamada et al. 2008], or perform a Bernoulli trial to choose one of its two parameters to be 1 and apply a conjugate Gamma prior for the other one [Masada et al. 2010].) Finally, to model streams of events, multinomial or multivariate Gaussians can be used to draw the respective discrete or continuous observation in each frame, for which conjugate priors are the well-known Dirichlet distribution and Normal-Inverse-Wishart distribution, respectively.
As mentioned above, handling state persistence and implicit state transitions is an inevitable issue in real-world multimodal interactions. A common way of modelling such phenomena is to assume that hidden state sequence exhibits semi-Markov chain dynamics. Johnson and Willsky [2010] proposed an HDP-based Hidden Semi-Markov Model (HDP-HSMM), of which the adaptation to learn POMDP parameters is also straightforward. The essential work is to draw a duration parameter for each state, and assume the observations to be generated frame-by-frame independently within each state duration. In addition, since in the POMDP case observed system actions partially bounded the state segmentations, one can force the known state boundaries to be fixed, and only allow the model to infer those implicit transitions between every two system actions.
However, such a semi-Markov extension of the iPOMDP still relies on trigger rules to enable the action selection process. A more natural strategy to model a “timing-sensitive” POMDP would be explicitly defining a “null” action (or a “wait” action in other words) and allowing the system to select an action (including the “null” action) at every unit timestamp. This requires the iPOMDP to infer the hidden user states frame-by-frame. However, as an HDP, the iPOMDP tends to cluster observations into states, which suggests that changes among the observations over time might result in them being clustered to many different states. Especially in the multimodal interaction case, this issue can become more serious due to the joint effect of multiple observation channels. Therefore, if directly applied here, the standard iPOMDP may experience unexpected fast state switches (see the experimental results in Section 5.5). Therefore, to better model the state persistence, we give a bias to self state transitions when the system performs a “null” action, with the assumption that the user tends to stay in the same state if no system action is explicitly performed, but the probabilities for implicit state transitions are still preserved. This idea directly follows the sticky HDP-HMM [Fox et al. 2011], but in the iPOMDP context, self-transitions are only biased for “null” actions and should be eliminated for explicit system actions. In the remainder of the paper, we will refer to this approach as the “sticky” iPOMDP. A concrete definition of the sticky iPOMDP can be found in Appendix A. Note here, although the semi-Markov setting has the advantage of avoiding the restriction to geometric state durations [Johnson and Willsky 2010] in comparison to the self-transition bias, the latter enables time-dependent action selection, which is a more appealing feature in the POMDP planning domain. Furthermore, according to our preliminary experiments, slightly higher uncertainty in the state inference procedure of an iPOMDP will not significantly affect the overall system performance, since the final system decisions are not deterministically generated according to the states but are tuned based on the belief states.
5.3. Sampling Inference
Similar to [Fox et al. 2011], the inference procedure of the proposed sticky iPOMDP can be carried out based on either a modified direct assignment Rao-Blackwellized Gibbs sampler [Teh et al. 2006] or a blocked Gibbs sampler [Ishwaran and James 2001] that takes the advantage of the
forward-0 100 200 300 400 500 600 700 800 900 1000 1 2 3 4 Observations True States Sticky iPOMDP Standard iPOMDP
Fig. 10. State inference on synthetic data: Black solid lines are generated randomly from underlying multinomials to represent stream events with discrete values; Green solid lines are generated from Gaussians representing a stream of continuous observations; Magenta circles are generated from multivariate Bernoulli distributions and simulate n-best lists of recognised events (e.g. dialogue acts from parsed speech recogniser hypotheses) with their radii generated from corresponding Beta distributions representing confidence scores.
backward algorithm for HMM to jointly sample the hidden state sequence, transition probabilities, and observation parameters. Fox et al. [2011] suggested that the blocked Gibbs sampler with truncations can offer faster mixing rates and less posterior uncertainty in sampling such Markov chain problems with “sticky” transitions. Hence, in this work we follow their approaches and adapt the weak limit approximation method [Ishwaran and Zarepour 2002] to infer our model parameters.
Firstly, we approximate the HDP transition prior by a finiteL-dimensional Dirichlet distribution. (Although such a degreeLweak limit approximation reduces a nonparametric Dirichlet process to a parametric Dirichlet mixture model, Ishwaran and James [2001] proved that it converges almost surely to a true Dirichlet process.) Then the HMM forward-backward procedure can be employed to jointly sample the state sequence given the observation sequence and action sequence. After this, we can sample the auxiliary variables to update the global transition distribution, and re-sample new transition distributions for each state. Finally, conditioning on those sampled states, the posterior parameters for observations and rewards can be sampled. Note that since self-transitions are ruled out for explicit system actions in the sticky iPOMDP, geometric auxiliary variables need to be sampled for transitions conditioned on explicit actions to complete the data to allow conjugate inference, as suggested in [Johnson and Willsky 2010], whereas binomial override auxiliary variables similar to [Fox et al. 2011] are required for transition parameters depending on “null” actions. A detailed inference algorithm for the proposed sticky iPOMDP can be found in Appendix B.
5.4. Planning
Due to the possibly infinitely large (continuous) observation space as well as the model uncertainty raised by HDP, seeking a model-based solution to our sticky iPOMDP via value iteration techniques is intractable. Nevertheless, since the proposed method only differs from the standard iPOMDP in model parameterisations, the forward search method proposed in [Doshi-Velez 2009] for iPOMDPs directly applies here, where we sample a set of models to compute a weighted-averagedQ-value, and only maintain a finite set of observations generated by Monte-Carlo sampling at each node of the search tree.
5.5. Evaluation
We evaluated the performance of state inference of the proposed sticky iPOMDP as well as its actual planning effects in comparison with the standard iPOMDP based on a synthetic data sequence as