sciences
ArticleDesigning a Fruit Identification Algorithm in Orchard
Conditions to Develop Robots Using Video
Processing and Majority Voting Based on Hybrid
Artificial Neural Network
Sajad Sabzi1, Razieh Pourdarbani1,*, Davood Kalantari2and Thomas Panagopoulos3,* 1 Department of Biosystems Engineering, College of Agriculture, University of Mohaghegh Ardabili,
Ardabil 56199-11367, Iran; [email protected]
2 Department of Mechanics of Biosystems Engineering, Faculty of Agricultural Engineering,
Sari Agricultural Sciences and Natural Resources University, Sari 48181-68984, Iran; [email protected]
3 Research Center for Spatial and Organizational Dynamics, University of Algarve, Campus de Gambelas,
8005 Faro, Portugal
* Correspondence: [email protected] (R.P.); [email protected] (T.P.); Tel.:+98-9143162785 (R.P.) Received: 18 November 2019; Accepted: 2 January 2020; Published: 4 January 2020
Abstract:The first step in identifying fruits on trees is to develop garden robots for different purposes such as fruit harvesting and spatial specific spraying. Due to the natural conditions of the fruit orchards and the unevenness of the various objects throughout it, usage of the controlled conditions
is very difficult. As a result, these operations should be performed in natural conditions, both
in light and in the background. Due to the dependency of other garden robot operations on the fruit identification stage, this step must be performed precisely. Therefore, the purpose of this paper was to design an identification algorithm in orchard conditions using a combination of video
processing and majority voting based on different hybrid artificial neural networks. The different
steps of designing this algorithm were: (1) Recording video of different plum orchards at different
light intensities; (2) converting the videos produced into its frames; (3) extracting different color
properties from pixels; (4) selecting effective properties from color extraction properties using
hybrid artificial neural network-harmony search (ANN-HS); and (5) classification using majority voting based on three classifiers of artificial neural network-bees algorithm (ANN-BA), artificial neural network-biogeography-based optimization (ANN-BBO), and artificial neural network-firefly
algorithm (ANN-FA). Most effective features selected by the hybrid ANN-HS consisted of the third
channel in hue saturation lightness (HSL) color space, the second channel in lightness chroma hue (LCH) color space, the first channel in L*a*b* color space, and the first channel in hue saturation intensity (HSI). The results showed that the accuracy of the majority voting method in the best execution
and in 500 executions was 98.01% and 97.20%, respectively. Based on different performance evaluation
criteria of the classifiers, it was found that the majority voting method had a higher performance. Keywords: artificial intelligence; precision agriculture; agricultural robot; optimization algorithm; online operation; segmentation
1. Introduction
Nowadays, agricultural automation is inevitable to reduce costs, minimize labor difficulty, decrease
environmental impact, increase timely farming and crop quality, and brink transparency in the supply
chain [1,2]. One of the challenges of robots is to identify and harvest the ripe fruits. In this regard,
cameras and sensors in the robot’s arms have also been used to evaluate the information [3]. Such
robots that capture real-time images and touch-based information enable the data to be collected in a variety of ways, helping to expand and improve this approach.
One of the most well-known techniques is image processing, which provides useful, simple, fast, and accurate information over manual techniques. Previous studies have used this technique to extract
color, morphological, and texture feature of foods such as fish, fruits, and vegetables. The different
pattern recognitions used to classify, analyze, sort, and evaluate foods depend on these features. Thus,
image processing [4–8] and pattern recognition [9,10] are the best way to determine the quality of crops.
Since harvesting robots have to work in unstructured environments with natural light conditions, the image segmentation algorithm is extremely important because direct sunlight causes shadows
in the image that lead to incorrect diagnosis of the system [11,12]. Cui et al. [13] studied the fruit
detection and extraction of color and shape features of kiwifruit under natural light. Until recently, two
methods have been used to reduce the effects of natural light on image processing: (a) improvement
of imaging conditions before image acquisition and (b) enhancing image contrast such as the use of
optical filters on camera lenses or artificial auxiliary sources to improve imaging [14]. Such methods
can be effective but require the installation of large structures and high energy consumption that lead
to the poor performance of agricultural robots in the orchard [15]. Wang et al. [16] developed a new
method for fruit segmentation under different lighting conditions that involved the use of advanced
wavelet transforms to normalize object surface lighting.
The Retinex algorithm was used to highlight the fruit object. The image was then analyzed using K-means clustering. Imaging was performed on sunny and cloudy days, and the results showed
that the proposed algorithm was able to operate successfully under different lighting conditions.
Sabzi et al. [17] proposed a method for segmenting apples under orchard conditions. The goal was to
find the color space with the least number of colors to apply the threshold. They examined 17 color spaces, and according to their reports, the best results were obtained by applying segmentation using color, texture, and intensity conversion, and the overall correct classification rate was 98.92%.
Miao et al. [18] categorized farm images under natural light conditions. Based on the color space,
eight color features of the images were extracted that included three components of HSL, the second and third components of HSV, and three components of HIS. Then, five specific vectors selected by principal component analysis (PCA) were selected to reduce the dimensionality of the images. The performance of using multiple color spaces in combination with PCA and RBF showed that the correct classification
rates of sunny and cloudy days in the same scenes and different scenes were 100%, 87.36%, and 84.58%,
68.11%, respectively. However, this classification accuracy is not enough for practical use in machine
vision systems as it results in many errors. Hernández et al. [19] proposed an approach to color
processing that could provide optimal color space for plant/soil segmentation. It evaluated all possible
options and developed color models in optimal spaces and channels. This prevented dependence on plant type, camera, and illumination conditions. The basis of their proposal was to use non-parametric
models for the probability density functions of the plant/soil. They implemented and validated their
algorithm with a new software tool called ACPS (Automatic Plant and Soil Classification) and claimed that the algorithm could be used in mobile applications and portable controllers that are currently being developed.
Aquino et al. [20] proposed an algorithm based on mathematical morphology and pixel
classification for grape berry counting. Features were extracted using a supervised approach. Eighteen images of seven individual varieties were obtained using a low-cost cell phone camera. The results implied that the ANN method performed better than the support vector machine (SVM) with recall
and precision values of 0.9572 and 0.8705, respectively. Kang and Chen [21] presented a deep-learning
based fruit detector for harvesting. The developed framework includes an auto label generation module and a deep learning-based fruit detector named “LedNet”. LedNet used multi-scale pyramid and clustering classifier to improve model recognition performance. LedNet achieved recall and precision of 0.821 and 0.853 in apple detection and the inference time was 28 ms.
Lin et al. [22] identified guava fruit in outdoor conditions. It is very important to pick the fruit without colliding with its mother branch. Thus, they evaluated the estimation of fruit using the low-cost red–green–blue-depth method. Based on the fruit binary image and RGB-D depth, Euclidean clustering was applied to group the point cloud into a set of individuals. Next, a 3D linear multi-segment detection method was developed to reconstruct the branches. Finally, the 3D position of the fruit was estimated using its center position and nearest branch information. Results showed that the accuracy of guava detection was 0.983. The run time of algorithm was 0.565 s.
Estimating nitrogen content in wheat plant is a very crucial task in the application of precision
farming. For this reason, Refs. [23–25] presented a method for predicting nitrogen content in wheat
plant. Their methods were based on a segmentation algorithm that was trained in three light intensities for separating wheat plants from the background. Since light intensity changes during the day, training the segmentation algorithm based on only three light intensities can be a weakness for the segmentation algorithm.
As observed, different researchers have focused on segmentation as an important step in designing
a different machine vision. In fact, the performance of each machine vision system has a direct relation
with the segmentation accuracy. Most segmentation algorithms work based on high quality images. This is the first problem for machine vision systems that work in natural garden conditions, since these methods are not applicable for operations where the camera must be moved in the field such as spraying in proportion to the density of products because when the camera is moving, the quality of the received frames is much less than when images are captured in static mode. The second problem is that most studies focus on images that do not have complicated backgrounds. However, in fruit
gardens, there are different backgrounds including the trunks of trees, leaves, different branches with
different colors, plants on the surface of the ground, sky in cloudy conditions, sky in clear state, and
other objects. The third problem is imaging at one time of day. In fact, little research has been done on images taken throughout the day, so the segmentation algorithm cannot work correctly during the day.
Therefore, a new segmentation algorithm that resolves these problems is necessary. For this
reason, the aim of this study was to offer a pixel-by-pixel segmentation algorithm based on an ensemble
with a majority voting rule for segmentation of plum fruits in orchards at different ripeness stages
under natural conditions. The segmentation methods that are used for voting were the artificial neural network-bees algorithm (ANN-BA), artificial neural network-biogeography-based optimization (ANN-BBO), and artificial neural network-firefly algorithm (ANN-FA).
2. Materials and Methods
The different steps to designing a plum identification algorithm in field conditions are as follows:
(1) Video recording in different natural light conditions of plum orchards; (2) Converting the videos to
their constituent frames; (3) Extracting different color features from each pixel; (4) Selecting the most
effective color features among the total extracted features; (5) Classification using different hybrid
artificial neural networks; and (6) Final classification of pixels in two classes of background and plum fruits using the majority voting method.
2.1. Video Recording to Train the Algorithm of Plum Fruit Identification
Since light intensity changes during day and the main aim of the proposed segmentation algorithm
is working in natural conditions related to light and background, segmentation algorithms should offer
high accuracy in all conditions, so they should be trained under all possible light intensities. For this
reason, the videos of the Kermanshah orchards were recorded at 16 different light intensities including
287, 342, 467, 593, 639, 738, 826, 1052, 1296, 1420, 1563, 1689, 1769, 1848, 1963, and 2078 lux and during
different stages of plum fruit growth. The camera used in the present study was a color GigE camera
DFK 23GM021 (Imaging Source Europe GmbH, Bremen, Germany), with a 1/3-inch Aptina CMOS
MT9M021 sensor (ON Semiconductor, Aurora, CO, USA) and a spatial resolution of 1280×960 pixels.
F1.4. From each video, 10 frames were selected randomly and then different objects were detected by a
human operator. Finally, 48,000 pixels from different frames were manually extracted by a human
operator and classified in the plum or background class (an average of 300 pixels were selected from each frame). Of these, 70% of the data, namely 33,600 pixels, were used to train; 15% of the data, namely 7200 pixels, were used for validation, and the remaining 7200 pixels, namely 15% of the data, were used to test the proposed algorithm. After extracting all pixels from the frames, these divisions
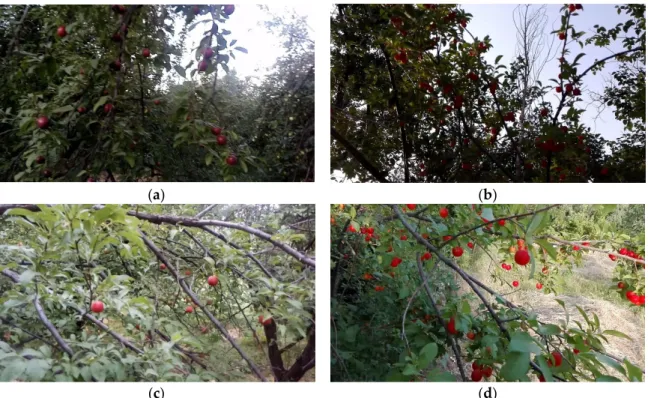
were done randomly. Figure1shows several frames of the videos produced.
Appl. Sci. 2019, 9, x FOR PEER REVIEW 4 of 14 of 300 pixels were selected from each frame). Of these, 70% of the data, namely 33,600 pixels, were used to train; 15% of the data, namely 7200 pixels, were used for validation, and the remaining 7200 pixels, namely 15% of the data, were used to test the proposed algorithm. After extracting all pixels from the frames, these divisions were done randomly. Figure 1 shows several frames of the videos
produced.
(a) (b)
(c) (d)
Figure 1. Four sample frames at different light intensities: (a) 467 lux, (b) 639 lux, (c) 826 lux, (d) 1848
lux.
2.2. Extraction of Different Color Features from Each Frame
After recording the videos and converting them to frames, different color features were extracted from different pixels of the background and fruits. These features include the first, second, and third channel in the L*C*h*, YCbCr, HSI, CMY, XYZ, HSV, YUV, HLS, L* u*v*, L*a *b*, and YIQ color spaces. Since there are three features and 11 color spaces, thus the total features of each pixel were 33 = 11 × 3.
2.3. Selection of the Most Effective Features Using Hybrid Artificial Neural Network‐Harmony Search Since the purpose of this algorithm is to detect fruit on trees by garden robots in a real‐time state, the process time should be as short as possible. Therefore, it is not possible to use all of the features in the algorithm because it is time consuming. Thus, the most effective color features must be selected among the extracted features. In this paper, a hybrid artificial neural network‐harmony search (ANN‐ HS) was used for this purpose. The harmony search (HS) algorithm is a meta‐heuristic algorithm that imitates the natural process of music optimization. In making a song, the beauty of the song determines the gamut of each musical instrument, in other words, each instrument must be optimized. Therefore, the value of the objective function is determined by the values of the variables [26]. The task of the harmonic search algorithm is to first consider all the extracted features as a vector and then send the vectors of different sizes to the artificial neural network. For example, it sends a vector with five extracted features to the ANN as the input, and the output of the ANN is the two classes of background and fruit. The mean squared error (MSE) of ANN is recorded for each vector of the features. Finally, the vector whose MSE is less will be selected as the optimal vector and the intra‐vector features as the most effective features. Table 1 gives the neural network structure used to select the most effective features.
Figure 1. Four sample frames at different light intensities: (a) 467 lux, (b) 639 lux, (c) 826 lux, (d) 1848 lux.
2.2. Extraction of Different Color Features from Each Frame
After recording the videos and converting them to frames, different color features were extracted
from different pixels of the background and fruits. These features include the first, second, and third
channel in the L*C*h*, YCbCr, HSI, CMY, XYZ, HSV, YUV, HLS, L* u*v*, L*a *b*, and YIQ color spaces.
Since there are three features and 11 color spaces, thus the total features of each pixel were 33=11×3.
2.3. Selection of the Most Effective Features Using Hybrid Artificial Neural Network-Harmony Search Since the purpose of this algorithm is to detect fruit on trees by garden robots in a real-time state, the process time should be as short as possible. Therefore, it is not possible to use all of the
features in the algorithm because it is time consuming. Thus, the most effective color features must be
selected among the extracted features. In this paper, a hybrid artificial neural network-harmony search (ANN-HS) was used for this purpose. The harmony search (HS) algorithm is a meta-heuristic algorithm that imitates the natural process of music optimization. In making a song, the beauty of the song determines the gamut of each musical instrument, in other words, each instrument must be optimized.
Therefore, the value of the objective function is determined by the values of the variables [26]. The task
of the harmonic search algorithm is to first consider all the extracted features as a vector and then send
the vectors of different sizes to the artificial neural network. For example, it sends a vector with five
extracted features to the ANN as the input, and the output of the ANN is the two classes of background and fruit. The mean squared error (MSE) of ANN is recorded for each vector of the features. Finally, the
vector whose MSE is less will be selected as the optimal vector and the intra-vector features as the most
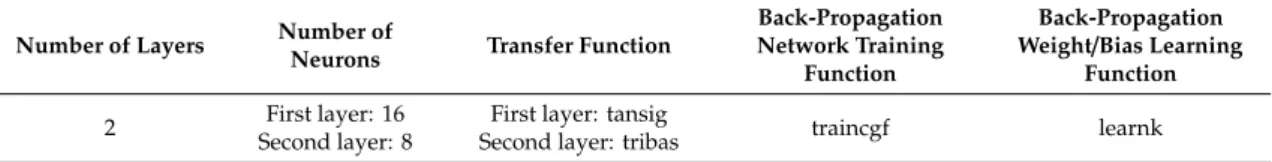
effective features. Table1gives the neural network structure used to select the most effective features.
Table 1. The structure used in hybrid artificial neural network-harmony search for selecting
effective features.
Number of Layers Number of
Neurons Transfer Function
Back-Propagation Network Training
Function
Back-Propagation Weight/Bias Learning
Function
2 First layer: 16
Second layer: 8
First layer: tansig
Second layer: tribas traincgf learnk
2.4. Classification of the Pixels Using different Classifiers
In this paper, the classification was performed using four different classifiers. The main
classification was based on the majority voting method based on different hybrid artificial
neural networks.
2.4.1. Hybrid Artificial Neural Network-Bees Algorithm (ANN-BA) Classifier
The multilayer perceptron artificial neural network has various adjustable parameters and the performance of an ANN depends on the optimal adjustment of these parameters. These adjustable parameters include the number of layers, the number of neurons per layer, transfer function, the
back-propagation network training function, and the back-propagation weight/bias learning function.
The bees algorithm has the task of optimally adjusting these parameters. The bees algorithm is a
bee swarm optimization algorithm proposed by Pham et al. [27]. This algorithm is inspired by the
behavior of bees in search of food resources [28]. The different stages of the bee algorithm are as
follows: (1) Generating initial responses and evaluating them; (2) Selecting the best sites (replies) and sending the worker bees to those sites; (3) Returning the bees to the hive by bee dancing (neighboring response); (4) Comparing all the bees in a site and choosing the best one; (5) Non-selected bees are replaced with random answers; (6) Save best position; and (7) Return to step 2, if termination is not fulfilled. The minimum and maximum number of layers that the bees algorithm could select was 1 and 3, respectively. The acceptable number of neurons per layer was between 1 and 25 for the first layer and between 0 and 25 for the other layers. The transfer function was selected from 13 transfer functions such as tansig and logsig. The back-propagation network training function was also selected
from 19 functions such as trainrp and traincgb. Finally, back-propagation weight/bias learning function
were selected from 15 different functions such as learnis and learncon. The bees algorithm sends these
parameters to an MLP neural network in the form of a vector. The input of the ANN is the most
effective features and its outputs are the background and fruit classes. Whenever a vector is sent to the
ANN by the BA, the MSE corresponding to that vector is recorded. Finally, the vector corresponding to the lowest MSE is considered as the optimal vector and the values of the parameters within the vector are considered as the optimal parameters.
2.4.2. Hybrid Artificial Neural Network-Biogeography Based Optimization (ANN-BBO) Classifier This classifier is similar to the ANN-BA, except that the values of the adjustable ANN parameters will be selected by the biogeography-based optimization algorithm. The BBO algorithm is inspired
by how different animal and plant species are distributed in different parts of the universe [29].
The different steps of the bio-based algorithm are as follows: (1) Generating the initial population or
so-called initial random habitat and sorting them; (2) Determining migration and immigration rates; (3) Repeating step 4–8 for each habitat such as j; (4) Steps 5 to 8 are repeated for each variable such as k at location j; (5) Changes are made according to steps 6 to 8 with the probability of migrating to a habitation; (6) Determine the origin of the migration using the migration values on random; (7) Migrating from one habitation to another; (8) Random changes (mutations) are applied to the
variable; (9) The set of new responses is evaluated; (10) Combining the original population and the migration-related population and creating a new stage population; and (11) Return to step 3 if termination is not fulfilled.
2.4.3. Hybrid Artificial Neural Network-Firefly Algorithm (ANN-FA) Classifier
The method of this classifier is similar to the two classifiers above-mentioned, except that here, the firefly algorithm has the task of determining the adjustable parameters of the ANN. This algorithm is inspired by the optical communication between the worms. This algorithm can be seen as a manifestation of swarm intelligence, where the cooperation (and possibly competition) of simple and low-intelligence members results in a higher degree of intelligence that is certainly not obtainable by
any component [30].
2.4.4. Configuration of the Best Training Mode Based on Artificial Neural Network (ANN)
After the investigation of 3000 different structures by optimization algorithms in hybrid ANN
classifiers, namely ANN-BA, ANN-BBO, and ANN-FA, the best ANN structure for each classifier
was configured (Table2). In order to evaluate the reliability of the classifiers, 500 repetitions were
performed for each method, that is, 500 independent executions of the training/testing process.
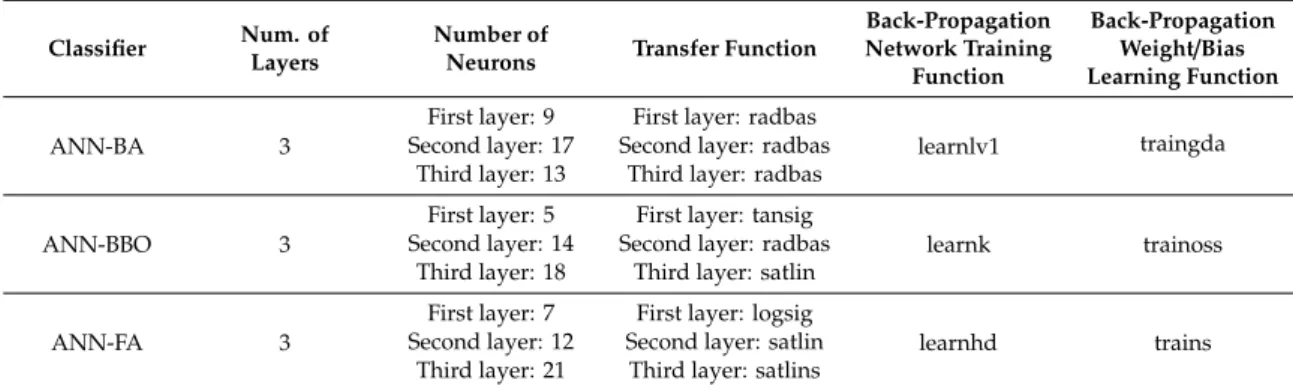
Table 2.The best structure of hidden layers of the artificial neural network (ANN) adjusted by bees algorithm (BA), biogeography-based optimization (BBO) and firefly algorithm (FA).
Classifier Num. of Layers
Number of
Neurons Transfer Function
Back-Propagation Network Training Function Back-Propagation Weight/Bias Learning Function ANN-BA 3
First layer: 9 First layer: radbas
learnlv1 traingda
Second layer: 17 Second layer: radbas Third layer: 13 Third layer: radbas
ANN-BBO 3
First layer: 5 First layer: tansig
learnk trainoss
Second layer: 14 Second layer: radbas Third layer: 18 Third layer: satlin
ANN-FA 3
First layer: 7 First layer: logsig
learnhd trains
Second layer: 12 Second layer: satlin Third layer: 21 Third layer: satlins
2.4.5. The Method of Majority Voting (MV)
After the ANN-BA, ANN-BBO, and ANN-FA perform the classification, the final operation will be carried out using the majority voting method. In fact, using the majority voting method, the opinion of the majority of classifiers determines the class of samples.
2.5. Evaluating the Performance of the Different Classifiers
To evaluate the performance of the classifiers, the receiver operating characteristic (ROC) and the
area under the curve [31] as well as the criteria for the confusion matrix were used (Table3).
Table 3.Description of the classifiers used in performance evaluation.
Description Formula
Percent of the correct samples that have been
correctly identified Recall=
TP
TP+FN×100
Total percentage of the correct system responses Accuracy = TP+TPFN++TNFP+TN×100 Total percentage of the correct Specificity = TPTP+FP×100
system responses Precision= TPTP+FP×100
Here, the positive class is the fruit (the object of interest) and the negative class is the background. Therefore, TP is equal to the number of samples of plum fruit that are correctly classified; TN is the number of samples of the background class that are correctly classified; FN is the number of fruit pixels misclassified as background; and FP is the number of background pixels misclassified as fruit. It has to be noted that some measures should not be analyzed by themselves. For example, a naïve system that always says true would have a recall of 100%, while a system that always says false would have a specificity of 100%.
3. Results
3.1. The Selected Effective Features Using Hybrid ANN-HS
Effective properties selected by the ANN-HS include the third channel of HSL (hue saturation
lightness), the second channel of LCH (lightness chroma hue), the first channel of L*a*b*, and the first channel of HIS (hue saturation intensity) color space.
3.2. Performance of ANN-BA Classifier in the Best State of Training
Table4gives the confusion matrix, incorrect classification rate, and the correct classification rate
(CCR) of the ANN-BA classifier for the best state of training among 500 executions. From the 7200 pixels examined in the fruit and background classes, only 154 samples were incorrectly classified into a
class other than their original class, resulting in a classification error of 2.14%. Table5evaluates the
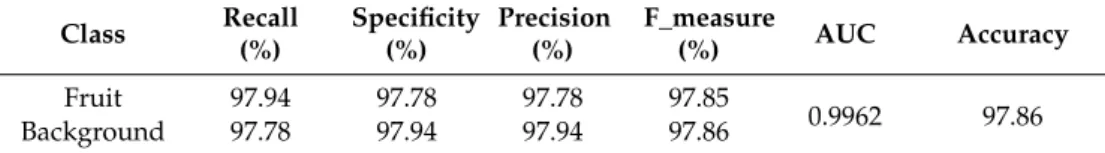
performance of the ANN-BA classifier in the best state of training, according to different criteria. It
shows that in all the criteria, with the exception of the area under the curve (AUC) with a value of
0.9962, the values obtained were above 97%, which is a high value. Therefore, based on Tables4and5,
it can be concluded that this classifier has a high performance.
Table 4.Confusion matrices, classification error per class, and correct classification rate (CCR) in the best state of training of the hybrid ANN-BA classifier for the testing data.
Classification Method
Real/
Obtained Class Fruit Background Total Data
Classification Error per Class (%)
Correct Classification Rate (%)
ANN-BA Background.Fruit 352074 352680 36003600 2.222.05 97.86
Table 5.The performance of the hybrid ANN-BA classifier base on different criteria in the best state of training for the testing data.
Class Recall (%) Specificity (%) Precision (%) F_measure (%) AUC Accuracy Fruit 97.94 97.78 97.78 97.85 0.9962 97.86 Background 97.78 97.94 97.94 97.86
3.3. Performance of ANN-BBO Classifier in the Best State of Training
Table6gives the confusion matrix for the ANN-BBO classifier for the best state of training on the
test data. This table shows that 3% of the samples in the fruit class were incorrectly classified in the background class and 2.8% of the samples in the background class were incorrectly classified in the fruit class. The correct classification rate (CCR) of this classification was 97.59% and this value reflects
its high performance. Table7indicates the performance of the ANN-BBO classifier in the best state
of training. As can be seen, all the criteria had values close to 100 and this proves that the classifier performed well.
Table 6.Confusion matrices, classification error per class, and correct classification rate (CCR) in the best state of training of the hybrid ANN-BBO classifier for the testing data.
Classification Method
Real/
Obtained Class Fruit Background Total Data
Classification Error per Class (%) Correct Classification Rate (%) ANN-BBO Fruit 3492 108 3600 3.00 97.59 Background 65 3535 3600 2.80
Table 7.The performance of the hybrid ANN-BBO classifier based on different criteria in the best state of training for the testing data.
Class Recall (%) Specificity (%) Precision (%) F_measure (%) AUC Accuracy Fruit 98.17 97.03 97.00 97.58 0.9965 97.59 Background 97.03 98.17 98.19 97.61
3.4. Performance of ANN-FA Classifier in the Best State of Training
Tables8and9give the confusion matrix and criteria evaluating the performance of ANN-FA,
respectively. The results for this classifier in the two tables were similar to those for the ANN-BA and ANN-BBO. Correct classification rate (CCR) and the area under curve (AUC) were 97.77% and 0.9778%, respectively, indicating the high performance of the classifier.
Table 8.Confusion matrices, classification error per class, and correct classification rate (CCR) in the best state of training of the hybrid ANN-FA classifier for the testing data.
Classification Method
Real/
Obtained Class Fruit Background Total Data
Classification Error per Class (%)
Correct Classification Rate (%)
ANN-FA BackgroundFruit 349959 3541101 36003600 2.801.64 97.77
Table 9.The performance of the hybrid ANN-FA classifier based on different criteria in the best state of training for the testing data.
Class Recall (%) Specificity (%) Precision (%) F_Measure (%) AUC Accuracy Fruit 98.34 97.23 97.19 97.76 0.9778 97.77 Background 97.23 98.34 98.36 97.79
3.5. Performance of the ANN-FA Classifier in the Best State of Training
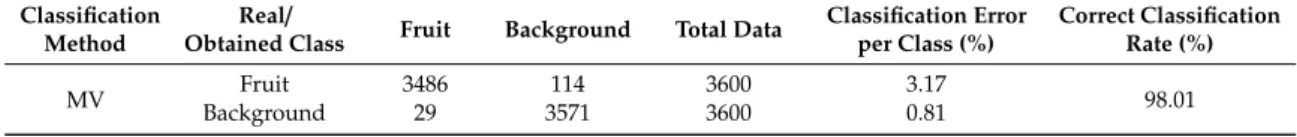
Table10gives the confusion matrices, the classification error per class, and the correct classification
rates for the majority voting method in the best state of training. As obvious, only 29 of the 3600 samples of background were incorrectly classified in the fruit class, resulting in an error of 0.81%. This method has been able to perform classification with a high accuracy of 98%. This is much more accurate
than the three classifications used for voting. Table11evaluates the performance of the majority voting
method based on different criteria. As can be seen, the values corresponding to the performance of
different criteria were close to 100, which prove that the majority voting method performs better than
the other methods.
Table 10.Confusion matrices, classification error per class, and correct classification rate (CCR) in the best state of training of the majority voting (MV) method for the testing data.
Classification Method
Real/
Obtained Class Fruit Background Total Data
Classification Error per Class (%)
Correct Classification Rate (%)
Table 11.The performance of the MV method based on different criteria in the best state of training for the testing data.
Class Recall (%) Specificity (%) Precision (%) F_Measure (%) AUC Accuracy Fruit 99.17 96.91 96.83 97.99 0.9970 98.01 Background 96.91 99.17 99.19 98.04
3.6. Comparison of the Performance of Classifiers Used in 500 Iterations
After evaluating the performance of the various classifiers in the best state of training, the validity of the classifiers should now be evaluated, especially the majority voting method. The validity of the
classifiers is determined by the results of them in different iterations, thus, if the classifier results are
close together in different iterations, then it can be claimed that the classifier is valid. Table12shows
the confusion matrix, the classification error per class, and the correct classification rate of the different
classifiers at 500 iterations. The highest rate of correct classification was related to the majority voting
method, which was 97.20% (Table13).
Table 12. Confusion matrices, classification error per class, and correct classification rate (CCR) of different classifiers for 500 iterations.
Classification Method
Real/
Obtained Class Fruit Background Total Data
Classification Error per Class (%)
Correct Classification Rate (%) ANN-BA Backgr.Fruit 1,742,08569,102 1,730,89857,915 1,800,0001,800,000 3.223.84 96.47
ANN-BBO Fruit 1,741,427 58,573 1,800,000 3.25 96.46
Backgr. 68,847 1,731,153 1,800,000 3.82
ANN-FA Fruit 1,746,422 53,578 1,800,000 2.98 96.91
Backgr. 57,786 1,742,214 1,800,000 3.21
Voting Backgr.Fruit 1,741,92042,643 1,757,35758,080 1,800,0001,800,000 3.232.37 97.20
Table 13.The performance of different classifiers based on different criteria for 500 iterations.
Classifier Class Recall (%) Specificity (%) Precision (%) F_Measure (%) AUC (Mean± Std. dev.) Accuracy (Mean %±Std. dev.) ANN-BA Fruit 96.18 96.76 96.78 96.48 0.9956± 0.0007 96.47±0.5657 Backgr. 96.76 96.18 96.16 96.46 ANN-BBO Fruit 96.19 96.73 96.74 96.47 0.9956± 0.0007 96.46±0.5167 Backgr. 96.73 96.19 96.17 96.45 ANN-FA Fruit 96.79 97.02 97.02 96.91 0.9691± 0.0046 96.91±0.4572 Backgr. 97.02 96.79 96.78 96.90 Voting Fruit 97.61 96.80 96.77 97.19 0.9958± 0.0008 97.20±0.4917 Backgr. 96.80 97.61 97.63 97.21
Figure2illustrates a box diagram of area under the ROC curve obtained by different classifiers at
500 iterations. As can be seen, with the exception of the hybrid ANN-FA classifier, the other classifiers
Appl. Sci.Appl. Sci. 20202019,, 109, , 383x FOR PEER REVIEW 1010 of 14 of 14
Figure 2. Boxplots of area under the curve (AUC) obtained by the classifiers for the 500 iterations on
test data. (a) Hybrid ANN‐BA; (b) Hybrid ANN‐BBO; (c) Hybrid ANN‐FA; (d) Voting method.
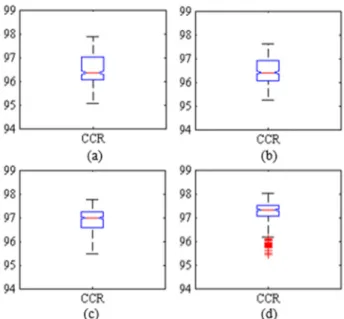
Figure 3 shows a box diagram of the correct classification rate obtained by different classifiers in 500 iterations. The graph shows that the majority voting method, with the exception of a few repeats, was above 97%. This method also had a more compact diagram than others, thus it can be concluded that the MV method is valid. Figure 4 shows the ROC curves obtained by different classifiers for 500 iterations. The closer the ROC curve is to the vertical, the higher the performance of the classifier.
Figure 3. Boxplots of the correct classification rate (CCR) obtained by the classifiers for the 500
iterations on the test data. (a) Hybrid ANN‐BA; (b) Hybrid ANN‐BBO; (c) Hybrid ANN‐FA; (d)
Voting method.
Figure 2.Boxplots of area under the curve (AUC) obtained by the classifiers for the 500 iterations on test data. (a) Hybrid ANN-BA; (b) Hybrid ANN-BBO; (c) Hybrid ANN-FA; (d) Voting method.
Figure3shows a box diagram of the correct classification rate obtained by different classifiers in
500 iterations. The graph shows that the majority voting method, with the exception of a few repeats, was above 97%. This method also had a more compact diagram than others, thus it can be concluded
that the MV method is valid. Figure4shows the ROC curves obtained by different classifiers for
500 iterations. The closer the ROC curve is to the vertical, the higher the performance of the classifier.
Figure 2. Boxplots of area under the curve (AUC) obtained by the classifiers for the 500 iterations on
test data. (a) Hybrid ANN‐BA; (b) Hybrid ANN‐BBO; (c) Hybrid ANN‐FA; (d) Voting method.
Figure 3 shows a box diagram of the correct classification rate obtained by different classifiers in 500 iterations. The graph shows that the majority voting method, with the exception of a few repeats, was above 97%. This method also had a more compact diagram than others, thus it can be concluded that the MV method is valid. Figure 4 shows the ROC curves obtained by different classifiers for 500 iterations. The closer the ROC curve is to the vertical, the higher the performance of the classifier.
Figure 3. Boxplots of the correct classification rate (CCR) obtained by the classifiers for the 500
iterations on the test data. (a) Hybrid ANN‐BA; (b) Hybrid ANN‐BBO; (c) Hybrid ANN‐FA; (d)
Voting method.
Figure 3.Boxplots of the correct classification rate (CCR) obtained by the classifiers for the 500 iterations on the test data. (a) Hybrid ANN-BA; (b) Hybrid ANN-BBO; (c) Hybrid ANN-FA; (d) Voting method.
Appl. Sci. 2019, 9, x FOR PEER REVIEW 11 of 14
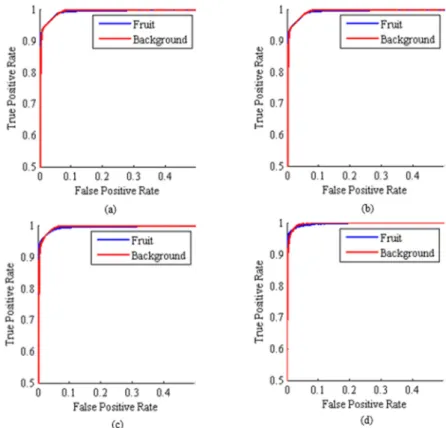
Figure 4. Receiver operating characteristic (ROC) curves obtained by the classifiers for the 500
iterations on the test data. (a) Hybrid ANN‐BA; (b) Hybrid ANN‐BBO; (c) Hybrid ANN‐FA; (d)
Voting method.
According to Figure 4, three classifiers, namely hybrid ANN‐BA, ANN‐BBO, and ANN‐FA, had a similar performance. The ROC curve of the MV method was closer to orthogonal than the other classifiers, indicating the superiority of this method over others. Figure 5 illustrates the various steps of the computer vision system proposed in this paper.
Figure 5. The final flowchart of the different stages of the proposed system in this article.
Finally, Table 14 shows the statistical t‐test for surveying significant differences between MV and the other proposed methods. In this table, the MV method is compared with the hybrid ANN‐ BA, ANN‐BBO, and ANN‐FA. A statistically significant difference was found between the hybrid ANN‐BA and MV method, hybrid ANN‐BBO and MV method, and hybrid ANN‐FA and MV
Figure 4.Receiver operating characteristic (ROC) curves obtained by the classifiers for the 500 iterations on the test data. (a) Hybrid ANN-BA; (b) Hybrid ANN-BBO; (c) Hybrid ANN-FA; (d) Voting method.
According to Figure4, three classifiers, namely hybrid ANN-BA, ANN-BBO, and ANN-FA, had
a similar performance. The ROC curve of the MV method was closer to orthogonal than the other
classifiers, indicating the superiority of this method over others. Figure5illustrates the various steps
of the computer vision system proposed in this paper.
Figure 4. Receiver operating characteristic (ROC) curves obtained by the classifiers for the 500
iterations on the test data. (a) Hybrid ANN‐BA; (b) Hybrid ANN‐BBO; (c) Hybrid ANN‐FA; (d)
Voting method.
According to Figure 4, three classifiers, namely hybrid ANN‐BA, ANN‐BBO, and ANN‐FA, had a similar performance. The ROC curve of the MV method was closer to orthogonal than the other classifiers, indicating the superiority of this method over others. Figure 5 illustrates the various steps of the computer vision system proposed in this paper.
Figure 5. The final flowchart of the different stages of the proposed system in this article.
Finally, Table 14 shows the statistical t‐test for surveying significant differences between MV and the other proposed methods. In this table, the MV method is compared with the hybrid ANN‐ BA, ANN‐BBO, and ANN‐FA. A statistically significant difference was found between the hybrid ANN‐BA and MV method, hybrid ANN‐BBO and MV method, and hybrid ANN‐FA and MV
Figure 5.The final flowchart of the different stages of the proposed system in this article.
Finally, Table14shows the statistical t-test for surveying significant differences between MV and
the other proposed methods. In this table, the MV method is compared with the hybrid ANN-BA,
ANN-BBO, and ANN-FA. A statistically significant difference was found between the hybrid ANN-BA
the accuracy of single classification methods was close to the accuracy of the majority voting method, the combination of these models together can limit the overfitting tendencies.
Table 14. Statistical differences between accuracy of majority voting (MV) and other method in
500 iterations.
t df Sig. Mean Accuracy 95% Confidence Interval
Lower Upper
MV 4420 499 .000 97.20 97.16 97.24
ANN-FA 4739 499 .000 96.91 96.87 96.95
ANN-BBO 4174 499 .000 96.46 96.41 96.51
ANN-BA 3813 499 .000 96.47 96.42 96.52
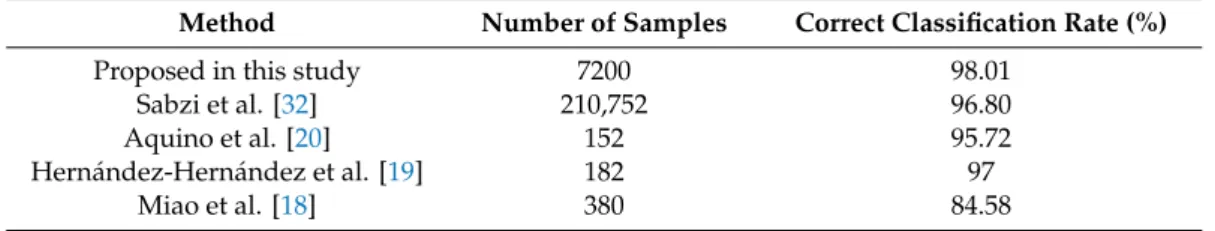
3.7. Comparison of the Proposed Method with Other Methods Used for Segmentation
The comparison of the results of the proposed method with the results of methods used by other
researchers greatly contributes to the importance of the present proposed method. Table15compares
the correct classification rate of the proposed method with other studies. As can be seen, the proposed method had a higher CCR than the other methods.
Table 15.Comparison of different studies in the field of segmentation with the proposed method in this article.
Method Number of Samples Correct Classification Rate (%)
Proposed in this study 7200 98.01
Sabzi et al. [32] 210,752 96.80
Aquino et al. [20] 152 95.72
Hernández-Hernández et al. [19] 182 97
Miao et al. [18] 380 84.58
After the survey of the performance of proposed algorithm, the time consumption of the algorithm
to calculate at different stages of the algorithm was estimated. The implementation hardware was
a laptop computer with an Intel Core i3 processor CFI, 330 M at 2.13 GHz, 4 GB of RAM-4 GB, and MATLAB 2015b. The average time consumed by the Central Processing Unit (CPU) to perform pixel extraction, feature extraction, and classification for each frame were 0.163, 0.312, and 0.236 s, respectively.
4. Conclusions
Due to the high sensitivity of agricultural robots to various operations such as fruit harvesting, spraying, etc., the proper training of its software is crucial. This study focused on a new segmentation algorithm based on a combination of video processing and majority voting rule to provide an identification system for harvester robots of plums in orchard conditions. Three hybrid ANNs were used to provide the voting process. These hybrids were ANN-BA, ANN-BBO, and ANN-FA. Video
processing was based on the extracted color features of each pixel, which led to highly efficient
predictions when compared with object analysis. Since there were different types of objects in the
orchard, the use of different pixels related to different objects in each frame extracted from different
videos captured in different light intensities throughout the day ensures that the identification system
was properly trained to detect the plum fruits on the trees.
Although it was not possible to use all of the extracted features of the identification system due to
the time consumption, however, the greater the number of extracted features, the more the effective
features were selected. Among the 33 extracted features, the hybrid ANN-HS selected four optimal features as inputs of classifiers that included the third channel of HSL, the second channel of LCH, the
first channel of L*a*b*, and the first channel of the HIS color space. The single classification methods, namely hybrid ANN-BA, hybrid ANN-BBO, and hybrid ANN-FA had accuracies of 97.86%, 97.59%, and 97.77%, respectively. The majority voting method performed classification with an accuracy over 98% and was more accurate than the other classification methods.
Author Contributions:Conceptualization, S.S. and R.P.; Methodology, S.S., R.P. and D.K.; Validation, S.S., R.P., and D.K.; Formal analysis, S.S.; Investigation, S.S.; Writing—original draft preparation, S.S., T.P., and R.P.; Writing—review and editing, T.P.; Visualization, T.P.; Supervision, T.P, R.P., and D.K. All authors have read and agreed to the published version of the manuscript.
Funding: This project was also supported by the European Union (EU) under Erasmus+ project entitled
“Fostering Internationalization in Agricultural Engineering in Iran and Russia” [FARmER] with grant number 585596-EPP-1-2017-1-DE-EPPKA2-CBHE-JP.
Acknowledgments: This paper was supported by the Research Center on Electronics, Optoelectronics, and
Telecommunications (CEOT) project NIBAP—Núcleo de Investigação em Biotecnologia e Agricultura de Precisão FEDER ALG-01-0247-FEDER-037303.
Conflicts of Interest:The authors declare no conflicts of interest.
References
1. Bechar, A.; Vigneault, C. Agricultural robots for field operations: Concepts and components.Biosyst. Eng. 2016,149, 94–111. [CrossRef]
2. Cavaco, A.M.; Pires, R.; Antunes, M.D.; Panagopoulos, T.; Brázio, A.; Afonso, A.M.; Silva, L.; Lucas, R.M.; Cadeiras, B.; Cruz, S.P.; et al. Validation of short wave near infrared calibration models for the quality and ripening of ‘Newhall’ orange on tree across years and orchards.Postharvest Biol. Technol.2018,141, 86–97. [CrossRef]
3. Mehta, S.S.; Burks, T.F. Multi-camera fruit localization in robotic harvesting.IFAC-PapersOnLine2016,49, 90–95. [CrossRef]
4. Blasco, J.; Aleixos, N.; Cubero, S.; Gomez-Sanchis, J.; Molto, E. Automatic sorting of Satsuma (Citrus unshiu) segments using computer vision and morphological features. Comput. Electron. Agric. 2009, 66, 1–8. [CrossRef]
5. Garrido-Novell, C.; Perez-Marin, D.; Amigo, J.M.; Fernández-Novales, J.; Guerrero, J.E.; GarridoVaro, A. Grading and color evolution of apples using RGB and hyperspectral imaging vision cameras.J. Food Eng. 2012,113, 281–288. [CrossRef]
6. Mendoza, F.; Dejmek, P.; Aguilera, J.M. Calibrated color measurements of agricultural foods using image analysis.Postharvest Biol. Technol.2006,41, 285–295. [CrossRef]
7. Naderi-Boldaji, M.; Fattahi, R.; Ghasemi-Varnamkhasti, M.; Tabatabaeefar, A.; Jannatizadeh, A. Models for predicting the mass of apricot fruits by geometrical attributes (cv. Shams, Nakhjavan, and Jahangiri). Sci. Hortic.2008,118, 293–298. [CrossRef]
8. Sabzi, S.; Abbaspour-Gilandeh, Y.; Javadikia, H. Machine vision system for the automatic segmentation of plants under different lighting conditions.Biosyst. Eng. 2017,161, 157–173. [CrossRef]
9. Hu, J.; Li, D.; Duan, Q.; Han, Y.; Chen, G.; Si, X. Fish species classification by color, texture and multi-class support vector machine using computer vision.Comput. Electron. Agric.2012,88, 133–140. [CrossRef] 10. Valenzuela, C.; Aguilera, J.M. Aerated apple leathers: Effect of microstructure on drying and mechanical
properties.Dry. Technol.2013,31, 1951–1959. [CrossRef]
11. Lin, S.; Xinchao, M.; Jiucheng, X.; Yun, T. An Image Segmentation method using an active contour model based on improved SPF and LIF.Appl. Sci.2019,8, 2576. [CrossRef]
12. Silwal, A.; Davidson, J.R.; Karkee, M.; Mo, C.; Zhang, Q.; Lewis, K. Design, integration, and field evaluation of a robotic apple harvester.J. Field Robot.2017,34, 1140–1159. [CrossRef]
13. Cui, Y.; Su, S.; Wang, X.; Tian, Y.; Li, P.; Zhang, F. Recognition and feature extraction of kiwifruit in natural environment based on machine vision.Trans. Chin. Soc. Agric. Mach.2013,44, 247–252.
14. Bechar, A.; Vigneault, C. Agricultural robots for field operations. Part 2: Operations and systems.Biosyst. Eng. 2017,153, 110–128. [CrossRef]
15. Vidoni, R.; Bietresato, M.; Gasparetto, A.; Mazzetto, F. Evaluation and stability comparison of different vehicle configurations for robotic agricultural operations on sideslopes. Biosyst. Eng.2015,129, 197–211. [CrossRef]
16. Wang, C.; Yunchao, T.; Xiangjun, Z.; Lufeng, L.; Xiong, C. Recognition and matching of clustered mature litchi fruits using binocular charge-coupled device (CCD) color cameras.Sensors2017,17, 2564.
17. Sabzi, S.; Abbaspour-Gilandeh, Y.; Hernandez, J.; Azadshahraki, F.; Karimzadeh, R. The use of the combination of texture, color and intensity transformation features for segmentation in the outdoors with emphasis on video processing.Agriculture2019,9, 104. [CrossRef]
18. Miao, R.H.; Tang, J.L.; Chen, X.Q. Classification of farmland images based on color features.J. Vis. Commun. Image Represent.2015,29, 138–146. [CrossRef]
19. Hernández-Hernández, J.L.; García-Mateos, G.; González-Esquiva, J.M.; Escarabajal-Henarejos, D.; Ruiz-Canales, A.; Molina-Martínez, J.M. Optimal color space selection method for plant/soil segmentation in agriculture.Comput. Electron. Agric.2016,122, 124–132. [CrossRef]
20. Aquino, A.; Diago, M.P.; Millán, B.; Tardáguila, J. A new methodology for estimating the grapevine-berry number per cluster using image analysis.Biosyst. Eng.2017,156, 80–95. [CrossRef]
21. Kang, H.; Chen, C. Fast implementation of real-time fruit detection in apple orchards using deep learning. Comput. Electron. Agric.2020,168, 105108. [CrossRef]
22. Lin, G.; Tang, Y.; Zou, X.; Xiong, J.; Li, J. Guava detection and pose estimation using a low-cost RGB-D sensor in the field.Sensors2019,19, 428. [CrossRef] [PubMed]
23. Sulistyo, S.B.; Woo, W.L.; Dlay, S.S. Regularized neural networks fusion and genetic algorithm based on-field nitrogen status estimation of wheat plants.IEEE Trans. Ind. Informa.2016,13, 103–114. [CrossRef]
24. Sulistyo, S.B.; Woo, W.L.; Dlay, S.S.; Gao, B. Building a globally optimized computational intelligence image processing algorithm for on-site nitrogen status analysis in plants.IEEE Intell. Syst.2018,33, 15–26. [CrossRef]
25. Sulistyo, B.S.; Wu, D.; Woo, W.L.; Dlay, S.S.; Gao, B. Computational deep intelligence vision sensing for nutrient content estimation in agricultural automation.IEEE Trans. Autom. Sci. Eng.2018,15, 1243–1257. [CrossRef]
26. Lee, K.S.; Geem, Z.W. A new meta-heuristic algorithm for continuous engineering optimization: Harmony search theory and practice.Comput. Methods Appl. Mech. Eng.2005,194, 3902–3933. [CrossRef]
27. Pham, D.; Ghanbarzadeh, A.; Koc, E.; Otri, S.; Rahim, S.; Zaidi, M. The bees algorithm—A novel tool for complex optimisation problems. In Proceedings of the 2nd Virtual International Conference on Intelligent Production Machines and Systems (IPROMS 2006), Cardiff, UK, 3–14 July 2006.
28. Hussein, W.A.; Sahran, S.; Abdullah, S.N.H.S. A fast scheme for multilevel thresholding based on a modified bees algorithm.Knowl. Based Syst.2016,101, 114–134. [CrossRef]
29. Simon, D. Biogeography based optimization.IEEE Trans. Evolut. Comput.2008,12, 702–713. [CrossRef] 30. Yang, X.S. Firefly algorithms for multimodal optimization. InStochastic Algorithms: Foundations and
Applications; Watanabe, O., Zeugmann, T., Eds.; Lecture Notes in Computer Science; Springer: Berlin, Germany, 2009; Volume 5792, pp. 169–178. [CrossRef]
31. Guijarro, M.; Riomoros, I.; Pajares, G.; Zitinski, P. Discrete wavelets transform for improving greenness image segmentation in agricultural images.Comput. Electron. Agric.2015,118, 396–407. [CrossRef] 32. Sabzi, S.; Abbaspour-Gilandeh, Y.; García-Mateos, G.; Ruiz-Canales, A.; Molina-Martínez, J.M. Segmentation
of apples in aerial images under sixteen different lighting conditions using color and texture for optimal irrigation.Water2018,10, 1634. [CrossRef]
©2020 by the authors. Licensee MDPI, Basel, Switzerland. This article is an open access article distributed under the terms and conditions of the Creative Commons Attribution (CC BY) license (http://creativecommons.org/licenses/by/4.0/).