A Data Mining Approach to
Improve the Automated Quality
of Data
Nawaf Abdullah Alkharboush
School of Electrical Engineering and Computer Science
Queensland University of Technology
A thesis submitted for the degree of
Doctor of Philosophy
Abstract
The quality of the data in organisational information systems is a critical issue for organisations. The rapid growth in the volume and complexities of technologies related to databases and data warehouses has enabled executives and decision makers to more readily store, access, analyse and retrieve massive amounts of information to support business needs. For the most part, advantages, such as significantly improved organisational capacity, increased performance efficiency and customer satisfaction, as well as reduced operational times and costs have been the principal result. However, despite these obvious benefits, a major chal-lenge remains, obstructing the proper delivery of these goals; this is the data quality. It is estimated that the immediate cost of a 1-5% error in data is approx-imately 10% of revenue. Poor data quality also has a severe impact on customer satisfaction, operating costs, effective decision making, and strategy execution.
Data quality affects many applications that facilitate data mining, database and business management. Such applications contain many interesting algorithms and techniques with which to approach the multi-dimensional problems that im-pact on data quality. While these methods have contributed somewhat to solving some data quality problems, they have serious limitations particularly for mining outlier data. Mining massive volumes of data to expose infrequent outlier values
based on traditional data mining tasks, such as association rule is computation-ally expensive. The problems that have arisen are that traditional data mining tasks are mainly designed to manage frequent data, and the focus of most data mining research is on post-process tasks; in which improving the accuracy of the data mining algorithms is desirable. Such solutions are inadequate and inappli-cable when it comes to providing continuous automated solutions for detecting outlier data.
This research describes the development of a robust and novel prototype to address the quality problems that relate to the dimension of outlier data. It thor-oughly investigates the associated problems with regards to detecting, assessing and determining the severity of the problem of outlier data. To address these problems, the study proposes new techniques based on granule mining, as an al-ternative to association rule mining, which is based on decision table theory. The proposed method is innovative and significant and has the potential to reduce the time and the costs associated with mining and assessing outlier data. Sub-stantial experiments have demonstrated that the proposed algorithms for outlier data outperform state-of-the-art algorithms. The contribution of the experiments described herein will be to enable organisations to effectively detect outlier data and thereby assess the behaviour of data quality in a continuous automated or (a semi automated) way.
Keywords
Data Mining, Granule Mining, Data Quality, Quality Assessment, Outlier Detec-tion, Noise DetecDetec-tion, Data Cleaning
Acknowledgements
I would like to express my very great appreciation to Professor Yue-feng Li , for his guidance, patience, enthusiastic, and encouragement. His willingness to give his time so generously with warming friend-ship has significantly helped me to deliver this project. I also would like to thank Associate Professor Richi Nayak for her comments and advice. Finally, I wish to thank my colleagues for their support and encouragement throughout my study.
STATEMENT OF ORIGINAL AUTHORSHIP
The work contained in this thesis has not been previously submitted to meet requirements for an award at this or any other higher education institution. To the best of my knowledge and belief, the thesis contains no material previously published or written by another person except where due reference is made.
Signature
QUT Verified Signature
Date 25/11/2013
Contents
Abstract i
Keywords iii
Declaration of Authorship vi
Contents vii
List of Figures xii
List of Tables xiv
xv 1 Introduction 1 1.1 Motivation . . . 1 1.2 Problem Statement . . . 9 1.3 Contributions . . . 13 1.4 Dissertation structure . . . 15 2 Literature Review 18
CONTENTS
2.1 The Concept Map of Literature . . . 18
2.2 Data Quality . . . 20
2.2.1 Data Quality in a Database . . . 24
2.2.2 Data Quality in a Data Warehouse . . . 27
2.3 Knowledge Discovery in Database . . . 31
2.3.1 Knowledge Discovery Processes . . . 31
2.3.2 Data Mining Tasks . . . 33
2.4 Data Mining Techniques . . . 35
2.4.1 Frequent Pattern Mining . . . 35
2.4.2 Association Rule Mining . . . 37
2.4.3 Rough Set Theory . . . 38
2.4.4 Rule Generation . . . 41
2.5 Data Quality in Context of Outlier Dimension . . . 43
2.5.1 Outlier Definition . . . 43
2.5.2 Outlier Detection . . . 45
2.5.3 Quality Assessment . . . 50
2.5.3.1 Quality Assessment Phases . . . 50
2.5.3.2 Quality Assessment Methods . . . 52
2.5.4 Quality Improvement . . . 57
2.5.4.1 Quality Improvements Based on Rules Techniques 58 2.6 Chapter Summary . . . 64
3 A Framework of the Proposed Data Quality Solution 66 3.1 Extracting Useful Patterns . . . 68
CONTENTS
3.1.2 Weighted Decision Table (WDT) . . . 69
3.2 Algorithms for Outlier Detection . . . 69
3.2.1 Granule Based Outlier Detection (GBOD) . . . 70
3.2.2 Ranking Weighted decision Table (RWDT) . . . 70
3.2.3 Centroid Granule (CG) . . . 70
3.3 Quality Assessment . . . 71
3.3.1 Decision Rule Method for Data Quality Assessment . . . . 71
3.3.2 Randomness Degree . . . 71
3.4 Chapter Summary . . . 72
4 Extracting Candidate Patterns 73 4.1 Introduction . . . 73
4.2 Pattern from Decision Table . . . 74
4.2.1 Approximation of Possible Outlier Patterns in DT . . . 75
4.3 Weighted Decision Table . . . 77
4.3.1 Pattern Extraction based on WDT . . . 78
4.3.2 Approximation of Possible Outlier Pattern in WDT . . . . 80
4.4 Chapter Summary . . . 81
5 Algorithms for Outlier Detection 83 5.1 Introduction . . . 83
5.2 Granules Based Outlier Detection . . . 84
5.2.1 Discernibility Matrix Approach . . . 85
5.2.2 Weighted Discernibility Matrix Approach . . . 87
5.3 Ranking Weighted Decision Table for Outlier Detection . . . 90
CONTENTS
5.3.2 RWDT for Attribute Outlier Detection . . . 93
5.4 Centroid Granule for Outlier Detection . . . 95
5.4.1 Finding the Centroid and Outlier data . . . 97
5.5 Chapter Summery . . . 99
6 Quality Assessment 100 6.1 Introduction . . . 100
6.2 Motivation Example . . . 101
6.3 Preliminaries . . . 103
6.4 Decision Rule Method for Data Quality Assessment . . . 104
6.5 Randomness Degree . . . 107
6.5.1 Definition for Randomness Degree . . . 107
6.5.2 Distinguish Between Systematic and Random Patterns . . 110
6.5.3 Pattern Reduction for Random Patterns . . . 114
6.6 Chapter Summary . . . 116
7 Experiments and Results 118 7.1 Experimental Datasets . . . 119 7.1.1 Synthetic Datasets . . . 119 7.1.2 Real Datasets . . . 121 7.2 Performance Measurement . . . 124 7.3 Experimental Setting . . . 125 7.4 Evaluation Process . . . 126
7.5 Experimental Results for Outlier Algorithms . . . 129
7.5.1 GBOD Algorithm for Outlier Detection . . . 129
CONTENTS
7.5.2.1 Results and Discussions . . . 133
7.5.3 CG Algorithm for Outlier Detection . . . 137
7.5.4 Comparison Between GBOD, RWDT and CG Algorithms . 141 7.6 Experiential Results for Quality Assessment . . . 148
7.6.1 Decision Rule for Data Quality Assessment . . . 148
7.6.1.1 Results and Discussions . . . 149
7.6.2 Randomness Degree . . . 152
7.6.2.1 Results and Discussions . . . 152
8 Conclusions and Future Work 156 8.1 Conclusions . . . 156
8.2 Limitations . . . 160
8.3 Future Work . . . 160
List of Figures
2.1 Literature Review for Data Quality in Data Mining . . . 19
2.2 Quality Problems in a Database . . . 25
2.3 Data Warehousing Architecture . . . 29
2.4 Multidimensional Data Cube Messaoud et al. [2006] . . . 30
2.5 Knowledge Discovery ProcessFayyad et al. [1996] . . . 31
2.6 The main phases of the assessment methodologyBatini and Scan-napieco[2006] . . . 51
2.7 CFDs Example Fei and Ren [2008] . . . 63
3.1 Data Quality Framework for Outlier Data . . . 67
5.1 Pattern Distribution . . . 91
5.2 Top 10 Outlier Objects . . . 96
6.1 Error Distributions Fisher et al. [2009] . . . 102
6.2 Distance Distribution . . . 111
7.1 A sample of Synthetic Dataset . . . 120
7.2 A sample of Adult Dataset . . . 122
LIST OF FIGURES
7.4 Evaluation Process . . . 127
7.5 ROC for Breast Cancer Wisconsin Dataset . . . 133
7.6 ROC for Post-operative Dataset . . . 134
7.7 Synthetic dataset-5000 . . . 135
7.8 Synthetic dataset-10000 . . . 135
7.9 Synthetic dataset-100000(A) . . . 136
7.10 Synthetic dataset-100000(B) . . . 137
7.11 ROC for Adult Dataset . . . 138
7.12 ROC for Post-operative Dataset . . . 138
7.13 ROC for Breast Cancer Wisconsin dataset . . . 139
7.14 ROC for Breast Cancer Wisconsin dataset . . . 140
7.15 ROC for Synthetic dataset-5000 . . . 140
7.16 ROC for Synthetic dataset-10000 . . . 141
7.17 The Proposed Algorithms with Different Top N for Synthetic dataset-5000 . . . 143
7.18 ROC for the Proposed Algorithms for Synthetic dataset-5000 . . . 143
7.19 ROC for the Proposed Algorithms for Synthetic dataset-5000 . . . 144
7.20 Distribution of the GBOD for Adult Dataset . . . 145
7.21 Distribution of the RWDT for Adult Dataset . . . 145
7.22 Distribution of the GBOD for Breast Cancer Wisconsin dataset . 146 7.23 Distribution of the RWDT for Breast Cancer Wisconsin dataset . 147 7.24 Compare Decision Rule with P-value . . . 151
7.25 Randomness Degree in Decision Tables . . . 152
List of Tables
2.1 A relational table . . . 40 2.2 A decision table . . . 41 2.3 C-Granules . . . 42 2.4 D-Granules . . . 42 4.1 A relational table . . . 75 4.2 A decision table . . . 764.3 A Weighted decision table (WDT) . . . 79
5.1 Discernibility Matrix (DM) . . . 86
5.2 Top 5 Outlier Result Based on Discernibility Matrix . . . 86
5.3 Weighted Discernibility Matrix (WDM) . . . 88
5.4 Top 5 Outlier Result Based on GBOD algorithm . . . 89
5.5 RWDT for object outlier detection . . . 92
5.6 A Set of outlier attributes in RWDT . . . 94
6.1 A relational table . . . 104
6.2 A decision table . . . 104
LIST OF TABLES
6.4 Not Cover All Patterns . . . 109
6.5 Errors Distributions . . . 109
7.1 Description of Real and Synthetic Data Sets . . . 118
7.2 Breast Cancer Wisconsin dataset . . . 130
7.3 Post-operative dataset . . . 130
7.4 5K Synthetic Dataset . . . 132
7.5 10K Synthetic Dataset . . . 132
7.6 The Proposed Algorithms Results for synthetic dataset-5000 . . . 142
7.7 Decision Rules for D1 and D2 . . . 148
7.8 Rate of Match and Unmatched Rules for D1 and D2 . . . 150
7.9 Compare the Rate of Matched rules with P-value . . . 151
7.10 Distinguish between Systematic and Randomness Distribution . . 154
7.11 Condition Table . . . 154
Chapter 1
Introduction
1.1
Motivation
Organisations increasingly rely on data storage technologies, and therefore data quality is becoming a critical concern of organisations. The rapid growth in the technological storage of data has brought significant advantages in terms of the capability to store massive amounts of data, the ability to retrieve relative information, and also to access heterogeneous resources. These benefits facilitate the growth of organisational locations, strategies and customers. Decision makers can utilise the more readily available data to maximise customer satisfaction and profits, and predict potential opportunities and risks. Unfortunately, this improvement in storage technologies has been at the cost of maintaining high data quality. Large quantities of poor data are saved in information systems; causing serious moral and financial implications for organisational performance.
The majority of organisational databases and data warehouses are pervaded with poor quality data Li and Joshi [2012]; Wang et al. [1995]. The appearance
of such poor quality data and the presence of various errors across databases and data warehouses significantly reduce the usability and creditability of the information systems and can have a moral and financial impact on the members of the organisation its associated stakeholders. For example, managers are unable to rely on their information systems to execute the organisational strategies they have designed; and, in some cases, conflict between employees and customers may emerge due to poor data quality. This failure is most noticeable in high rate amongst customers who choose to turn to superior service providers. These moral impacts lead to an increase in operational costs and a decrease in revenues. Studies show that the estimated immediate cost stemming from a 1-5% error rate is approximately 10% of revenue Redman[1998]. In the US, a survey conducted by The Data Warehouse Institute revealed that data quality problems cost US businesses 611 billion dollar a year Eckerson [2002].
Generally, data quality is defined as data that is fit for its intended use by consumers Ballou and Pazer[1985]. This means that, the quality of the data in a database must reflect the actual entity in the real world that is being described. When this is the case, it can be asserted that there is no poor data quality stored in the database. In the literature, there are a number of the data quality dimensions that relate to specific problems that affect data Ballou and Pazer [1985]; Lee et al. [2002]; Redman [1996]; Strong et al. [1997]; Wand and Wang [1996]; Wang and Strong[1996]. The following are the most regularly mentioned and the most critical dimensions of data quality:
• Consistency means that there is no conflict in data values. Conversely, inconsistency (or outliers in the data mining context) presents values that are out of range for the remainder of the collection.
• Accuracy refers to the value that is nearest to the value in the standard domain. Any new datum is compared against standard domain datum, which is considered to be accurate (or correct), so as to determine the accuracy of the new datum.
• Currency (of which timeliness and freshness are aspects) confirms the status of the data value as up-to-date. This dimension can have some influence on the accuracy of a decision that is being taken. For instance, when this dimension is neglected in information systems, a resident might receive post from commercial and governmental organisations intended for previous residents.
• Completeness refers to the extent to which absent or missing (or unknown) values are present in a data collection.
The above four data quality dimensions are essential factors in determining the success of many applications; including business process management, database and data warehouses, statistics, and data mining. Each of the applications devel-oped to handle data proposes a number of interesting and promising solutions to address each of the above data quality dimensions. Based on the techniques used when approaching data quality dimensions, the literature calcifies data quality solutions into two fundamental areas: process-oriented and data-oriented tech-niques Batini et al. [2009]; Besiki et al. [2007]; Lee et al. [2002]; Madnick et al. [2009].
The process-oriented methods allows for the identification of the causes of data errors through observation of the whole process, since data gathering and acqui-sition continues until the final stage of the organisational processes. It is widely
accepted that the assessment of, and improvements in, organisational informa-tion systems cannot be achieved independently of the users perspective. Indeed, data consumers play significant roles in providing comprehensive and contiguous quality assessment and improvement. If we take the example of an organisation engaged in manufacturing fabric; if the bolt produced is expected to be one inch wide by two inches long, then, that bolt and every other bolt in the manufactur-ing process must also be one inch wide by two inches long to meet the product specifications Silvers [2008]. If this were not the case, the products would be different sizes and would not meet the customers’ needs. The authors Dasu and Johnson [2003]; Silvers [2008] emphasise the value of improving those processes that are implicated in data quality problems, rather than aiming to fix problems inside the database when they manifest at a later stage. This also ensures that the manufacturing process is under control and will incorporate savings of both time and cost.
However, it is inefficient to rely solely on process-oriented methods to handle data quality problems for numerous reasons. The first one is that implementing a process-oriented method is a difficult and time consuming task, requiring frequent process checking of all organisational processes and sub-processes. Hence, massive losses in time are associated with pursuing process-oriented approaches to deliver data quality. Additionally, process-oriented methods are subjective, and largely relate to the user’s decision. Reaching a consensus can be difficult in such cases, particularly when dealing with data quality dimensions such as inconsistency (or outlier data). More importantly, the ultimate decision as to whether or not process-oriented methods ensure data quality in a database or a data warehouse is determined by data-oriented solutions.
Therefore, the techniques invoked for the purpose of data-oriented solutions play an essential role in insuring data quality. There are significant contribu-tions discussed in the literature reviewed in this work, that involve data quality problems and dimensions from a data-oriented perspective. Several approaches that adopt data-oriented methods address different data quality issues, such as records duplication, incomplete, inaccurate, and inconsistent data. Thus, it is apparent that users can utilise data-oriented techniques to objectively assess, im-prove, and maintain the quality of the data held in their databases and data warehouses. The data-oriented view also enhances the process-oriented view, as it enables data quality experts to benchmark quality change, allocate process locations that generate quality problems for processes re-engineering, and also reduce the time frames and resources needed to conduct a complete object data quality study to assess data quality dimensions.
Due to the breadth and the dimensionalities of data quality research, this research expands exploration of the problem to the dimension of outlier (or in-consistent) data from the perspective of the data view. The outlier problem is a critical one toward many applications including fraud detection, network in-trusion, and the monitoring of terrorist activities and healthcare. The data in these applications can either be stored in a single database, multiple databases or a data warehouse. Hence, mining outlier data from each of these three types is difficult and becomes increasingly challenging in cases where there are multiple databases and data warehouses.
In the case of the database, there are two types of the databases in most organisations: a single data source and multiple data sources. This will depend on the size of the organisation and the services it provides. In a single data source
the complete solution for outlier data must be considered at both the schema and data levels; thus, users need to clearly and correctly define, analyse, assess and improve the outlier data at both levels. This can be difficult because of the massive data throughput that experts need to deal with.
In cases with multiple databases, outlier detection becomes even more te-dious, expensive and time consuming. The reasons for this are associated with multiple schemas and data levels. Data quality experts need to individually as-sign specific quality conditions and constraints for each of these multiple data sources in such a way as to avoid conflict. This can be difficult to establish and generalise because some rules differ at the schema level or/and the in data level when considering outliers in a databases, as compared to normal data. Having single or/and multiples databases pervaded with outlier data can cause a great challenge when building a historical reliable decision support system in a data warehouse.
A data warehouse is a historical repository consolidating multiple databases from different periods of time. There are three steps that must be undertaken when designing a data warehouse. These steps are extract, transfer and load; commonly referred to as the ETL process. The successful construction of a data warehouse is highly reliant on the quality of the databases whose data will be extracted and transformed and loaded into the data warehouse. Although, some ETL tools provide quality capabilities for transforming steps to include some business rules, clean constraints and integrity, these quality capabilities cannot guarantee highly consistent data quality in a data warehouse if the quality of the data in the original databases contains outlier values.
growing attention being paid to Knowledge discovery in database (KDD); some-thing which is commonly referred to as Data mining (DM). DM is useful when dealing with very large data sources. DM provides various techniques that enables users to extract interesting patterns, find associations and retrieve valuable infor-mation. Given the benefits of Data Mining techniques, they are used widely for information retrieval, fraud detection, medicine and healthcare, network security and data quality.
KDD or DM consists of several components. The first and foremost compo-nent in any data mining project is that the data quality of the dataset should be high. The quality of the dataset can potentially impact on the remainder of the phases in the data mining process. It is estimated that up to 60% of the time allocated to a data mining project is consumed in the preprocessing stage, which includes data cleaning, normalisation, transformation, feature extraction and se-lection. Data cleaning tasks are at once the most tedious and the most critical task for two reasons. Failure to provide high data quality in the preprocessing stage will significantly reduce the accuracy of any data mining project. Hence, the phrase ”garbage in garbage out ” becomes true in the case of a data mining project.
DM literature provides various techniques and algorithms with which improve data quality in the preprocessing stage. These algorithms utilise different data mining techniques to capture and improve different quality problems that might be associated with the data. However, the main limitation of these studies is that data quality issues are investigated for the purpose of improving the accuracy of the post-processing for the purposes of clustering, classification and association rules algorithms. This somewhat narrow view of the problem disregards the
necessity for continuous data cleaning and the maintaining of high data quality in databases and data warehouses and can lead to outlier values occurring in the system. Hence, users cannot rely on these approaches to provide an ultimate solution to guarantee data quality.
Over the years, there has been growing understanding of the necessity to re-flect on data mining techniques to support the automation of data quality in source systems: database and data warehouse. A plethora of data mining tech-niques and algorithms have been developed, but their remains a gap, particularly in reference to the dimension of outlier data and the assessment of quality change transformation in reference to outlier behaviour from time to time. It is intended that the contribution made by this study will go some way to filling this gap.
This thesis will detail the extensive investigation which was undertaken to overcome the challenges of providing a complete automated solution for outlier data. The main role of this study has been to propose new and promising al-gorithms for detecting outlier data. Additionally, this study acknowledges that poor data, such as outlier data, can systematically or randomly appear across columns and rows with variance in degrees. Hence, the work described in this study enhances the proposed outlier algorithms with new quality assessment mea-surement that will enable users to assess the quality change in outlier behaviour periodically. The substantial experiments in this study demonstrate the promis-ing contributions of the proposed outlier algorithms and new quality assessment measurements.
1.2
Problem Statement
The significant improvement in the size and technology of information systems has increased the necessity for data mining techniques and algorithms in many ap-plications; in particular to ensure data quality. The reasons for this are associated with the capability of data mining techniques and algorithms to efficiently and ef-fectively scale well with large datasets, extract frequent patterns, find association rules, classify information and predict future opportunities and risks. These ad-vantages enable researchers to design semi and fully automated approaches that can handle different data quality problems including: records duplication, record linkage and various data quality dimensions.
However, there are some problems present in the traditional data mining tech-niques utilised for mining outlier data, because outlier data appears infrequently in the system. It is formally defined as ”an observation that deviates so much from other observations as to arouse suspicion that it was generated by a dif-ferent mechanism ” Hawkins [1980]. Other domains of knowledge define outliers as sets of examples that are a far distant from their neighbours Knorr and Ng [1999];Ramaswamy et al.[2000]. Another assumption held in reference to outlier data is derived from Frequent Itemsets FIs where outliers are the points which have infrequent common patterns. The above definitions of outlier data lead us to highlight the probability of the following problems arising in the current research, when seeking to provide a complete solution for outlier data:
• Most traditional data mining techniques such as classification, clustering, frequent itemsets and association rules are designed for dealing with fre-quent data. Hence, utilising these techniques for mining massive data for
outlier detection is difficult and computationally expensive, as the outlier data infrequently appears in databases and data warehouses. Although, the literature provides a wide range of data mining methods that deals with in-frequent and exposed outlier examples, these methods to some extent are computationally expensive and inapplicable when considered in reference to increasing data volumes and dimensionalities, or when restricted to a numeric data type.
• Existing outlier detection methods are only focused on one aspect of the data quality problem which is detecting outlier data. Other essential as-pects of data quality such as quality assessment and improvement are not well defined in either data mining or outlier literature. Considering these aspects: outlier detection and outlier assessment are essential to provide a semi and fully automated data quality solution to classify outlier data in a database and data warehouse.
• Literature provides various outlier detection methods which can be classi-fied into two approaches: parametric and non-parametric. The statistical method, also called the parametric method assumes that data is paramet-ric or normally distributed. The key problem when adopting statistical approaches is that most KDD applications are multidimensional with un-known underlying data distribution.
• The non-parametric category overcomes the limitations of parametric meth-ods and is more promising for effective outlier detection. The non paramet-ric method was first introduced in papers Knorr and Ng [1998, 1999]. The studies Knorr and Ng [1998, 1999] introduced a non-parametric method
called the distance-based approach. The outlier in a distance-based is de-fined based on its distance to other examples. The main advantage of distance-based approach is such that the user does not require any prior knowledge of the data distribution. Other popular non parametric methods for outlier detection are density-based and Frequent Itemsets FIs. However, the distance-based and density-based methods require quadratic computa-tional complexity with respect to data size and dimensionalities.
• Frequent itemsets for outlier detection scales work well with increasing data size and dimensionalities. Yet, it is difficult to specify a minimum support threshold which separates frequent items from infrequent ones. The reason for this is that if the specified threshold is large, then we are likely to have a large number of outlier candidates. Vice versa, if the specified threshold is small, then we may miss some outliers. Additionally, the accuracy of the frequent items might fluctuate when changing the minimum support as the size of the items would change.
• Another significant problem, besides detection of outlier data that has not received much attention, is how best to assess the data quality of outlier data periodically. Most data quality research is often compromised by the presence of poor data dimensions such as outlier data. Detecting outlier data is undoubtedly an essential step for data mining as it could influence the accuracy of mining tasks such as classification or clustering. Yet, this limited view of the problem does not guarantee a complete outlier solution. Outlier data is likely to continuously occur in a database and a data ware-house. The existing solutions for quality assessment do not support users
to clearly and accurately assess the change in outlier behaviour periodi-cally, or enable them to improve the database by eliminating any malicious behaviour caused by access to the information systems.
• The current approaches to quality assessment are primarily dependent on manual inspection with little support for automated techniques. Most qual-ity assessment methods rely on the error rate or accuracy rate to expose the ratio of outlier data in the database or data warehouse. These meth-ods are likely to provide misleading results when users want to compare outliers between databases across different time periods; this is because as distribution of outlier data might differ between these databases.
• Quality assessment methods omit mention of the fact that outlier data can be systematically and randomly distributed across columns and rows. Hence, users are unable to learn from old systems so as to allocate the ap-propriate time and technological resources to improve the quality of their systems when capturing suspicious outlier data prior to accessing their sys-tems.
To address these limitations in both outlier detection and quality assessment, it is important to solve the challenge associated with both outlier detection and assessment methods and also to incorporate quality assessment into outlier data so that newly generated outliers are efficiently and effectively captured prior to accessing the information systems. Additionally, decision makers can clearly al-locate the most severely affected data, determine patterns and estimate the time and complexity required to conduct quality improvement tasks. All this can un-doubtedly make a breakthrough towards the automation of quality improvement
in outlier data.
1.3
Contributions
The majority of existing methods in data quality research are focused on one as-pect of data quality which is detecting poor data quality. Due to this limited view of data quality problems, there are no efficient and effective solutions that can be said to represent a breakthrough towards an automated data quality solution. This thesis thoroughly investigates and discusses these limitations in Section 6.2; particularly in the dimension of outlier data and significant contributions toward proposing a complete automated data quality solution. It also considers two es-sential aspects of data quality: Outlier detection for exposing outlier data and quality assessment for assessing any quality change in outlier behaviour period-ically. As a consequence its significant contributions are anticipated to be the following:
• It will draw attention to aspects of data quality in order to facilitate a complete automated data quality solution. Particularly, the thesis will in-vestigate the limitations of existing outlier data capture with regards to large datasets. The thesis will also study the limitations of existing data quality and outlier methods by providing complete automated solutions for outlier data.
• Practically, the thesis will propose several algorithms for mining outlier data: categorical and mixed attributes datasets, by utilising the concept of rough set theory. Initially, the thesis will introduce two approximation
al-gorithms: the Decision table DT and the Weighted decision table WDT for finding and approximating the location of possible outlier patterns. These DT and WDT algorithms have great advantages for mining outlier data, as the number of patterns found by DT and WDT is significantly smaller than that of other methods that rely on frequent items sets found by an Apriori algorithm.
• This research will contribute by suggesting three outlier algorithms for min-ing outlier data. The proposed algorithms will be effective for minmin-ing outlier data because of the mining space found in the approximating algorithms: DT and WDT, is very small. The first outlier algorithm; the GBOD, is based on an approximation of the DT. The remaining algorithms are a ranking weighted decision table RWDT and centroid granules CG are de-rived from an approximation of the WDT algorithm.
• Additionally, the study understands the limitations of existing data quality with regards to quality assessment. Hence, the thesis will contribute by assessing outlier data using two algorithms. The first algorithm for quality assessment measures the quality change of outlier data from different time periods. The second algorithm for quality assessment captures the root cause of outlier data and determines the location of the most severe outlier data by measuring the systematic and random degree of outlier data. • Substantial experiments and analysis of all the techniques and algorithms
proposed in this thesis are undertaken so as to clearly validate their effec-tiveness; not only for exposing outlier data but also for assessing quality transformations in the outlier behaviour periodically.
1.4
Dissertation structure
To ensure a comprehensive coverage of the research problems, existing methods and the proposed goals, this thesis is organised sequentially as follows:
• Chapter 2: provides comprehensive coverage of related data quality liter-ature. The critical review of the literature in this chapter clearly exposes a gap in the existing data quality research.
• Chapter 3: details the framework for automated data quality in this the-sis. The framework can be considered as a roadmap for the thesis’s con-tributions. It shows the flow, the contributions of the work and associated chapters.
• Chapter 4: is mainly focused on extracting useful patterns. Particularly, the chapter introduces two useful methods. The first one is based on rough set theory. The second one is a novel approach based on using weighted de-cision table WDT. The advantages associated with these two methods lend critical success factors to the remaining contributions with regard outlier detection and outlier assessment.
• Chapter 5: addresses the limitations of existing outlier algorithms. It in-troduces three outlier algorithms to address different outlier problem. The first algorithm is the GBOD, which demonstrates how use of the Discerni-bility Matrix can provide accurate outlier information in the form of tradi-tional Euclidean distance. The RWDT algorithm provides efficient ranking outlier data. The third outlier algorithm (Centroid granule) uses centroid granules. The centroid granules algorithm measures the distance between a
pattern and a centroid pattern rather than between a pattern and a num-ber of nearest neighbour patterns, to determine its outlier degree. The proposed WDT and RWDT for outlier detection are accepted as journal paper by International Journal of Intelligence Science(IJIS) .
– Nawaf Alkharboush , Yuefeng Li and Richi Nayak. 2012. Outlier Detection with Weighted Granule Mining.
• Chapter 6: assess the outlier data and measures its severity. The algo-rithms proposed in this chapter represent a major breakthrough towards the automation of data quality assessment. The first algorithms enable users to measure the quality of change with regards to outlier data. The second contribution in this chapter investigates the systematic and random distributions of outlier data in database. The relevant publications of the proposed quality assessment are as below:
– Nawaf Alkharboush and Yuefeng Li. 2010. A Decision Rule Method for Assessing the Completeness and Consistency of a Data Warehouse. In Proceedings of the 2010 IEEE/WIC/ACM International Conference on Web Intelligence and Intelligent Agent.
– Nawaf Alkharboush and Yuefeng Li. 2010. A Decision Rule Method for Data Quality Assessment. In Proceedings of the 2010 ICIQ/ACM International Conference on Information Quality.
– Nawaf Alkharboush and Yuefeng Li. 2011.A Decision Table Method for Randomness Measurement. In Proceedings of the 4th International Conference on Intelligent Decision Technologies.
• Chapter 7: includes substantial experiments, analysis of the proposed techniques and algorithms in this thesis. For the purpose of fair validations, this thesis conducts extensive experimental studies and compares their re-sults to several state-of-the-art algorithms, to determine the effectiveness of the proposed algorithms to address research problems.
• Chapter 8: is the conclusion to the thesis. It also suggests possible future research directions.
Chapter 2
Literature Review
2.1
The Concept Map of Literature
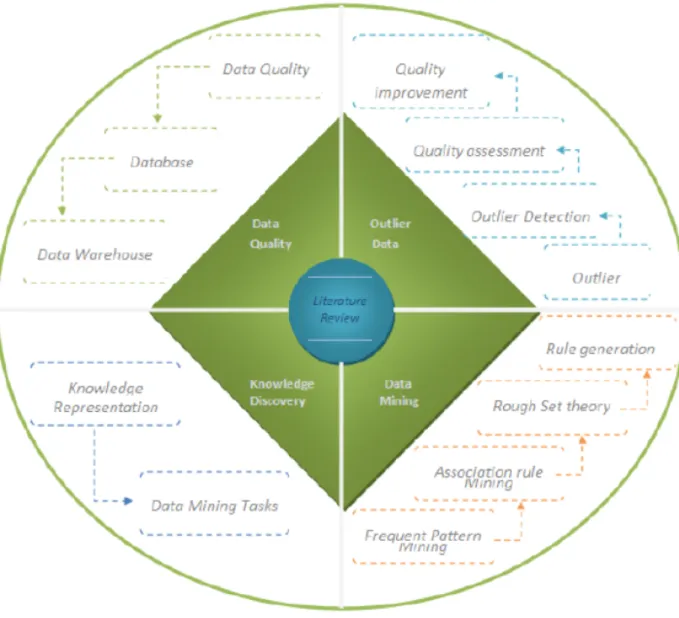
This chapter presents a review of the current literature that discusses data min-ing for data quality, particularly that which focuses on the dimension of outlier data. To ensure complete coverage of relevant literature, the literature review has been constructed around four major topic areas as in Figure 2.1. The first section covers the issues associated with data quality and discusses the quality issues that arise as a consequence of existing methods used for databases and data warehouses. The second section of the literature reviews the knowledge dis-covery process for database and data mining tasks. Section three of the literature review concerns data mining; particularly emphasising identification of frequent patterns and the extraction of knowledge using association rule mining. This section covers the decision table and rule generation based on a rough set theory. The final part of the chapter thoroughly discusses the quality problems that re-late to the dimension of outlier data, since the principal goal of the thesis is to
provide a complete automated solution to guarantee data quality with regards to outlier data. It will cover practices associated with quality programming, so as to describe related outlier literature. Specifically, this section includes a definition of outlier data, reflects on existing outlier detection methods, and assessment approaches to outlier data.
The research and studies presented throughout this chapter suggest that there is a significant gap in existing conceptions, algorithms and methods in relation to providing automated data quality solutions with regards to outlier data. It is this gap that the this study seeks to fill.
2.2
Data Quality
Data quality is a critical factor associated with technological solutions to manage data in support of organisational performance. It can be defined as fit for use by data consumers Ballou and Pazer [1985]. In other words, data must be stored at a high quality to reflect consumers’ needs. However, in a real world setting, organisational information systems are pervaded with poor data quality. A survey of 500 medium-size firms with annual sales of more than $20 million confirms that 60% of participating firms experience data quality problems Wand and Wang [1996]. The emergence of poor data can have a severe impact on decision making processes and customers’ and employees’ satisfaction levels, as well as on making and executing strategies and increasing operational costs Redman[1998].
Data quality research involves a series of steps, including Defining, Measuring, Analysing, and Improving data quality. The procedure followed to test quality is advocated by leading quality programmers such as MIT Total Data Quality
Management (TDQM) and the Department of Defence (DoD) Lee et al. [2002]; Redman[1996]. These four components are gradually and seamlessly interrelated with one another. To meet the aim of achieving a suitable and comprehensive data quality testing method the users need to incorporate these four phases into any data quality framework. For instance, management cannot improve systems if they are unable to define or measure defective values. Neglecting any single phase can have a potentially severe impact on data quality evaluation.
Researchers and practitioners investigating the four data quality components stated above have produced studies that make outstanding theoretical and prac-tical contributions to this field. These studies have resulted in the division of data quality research according two fundamental viewpoints:
• Process-oriented • Data-oriented
Both perspectives have been conceptualised as a data manufacturing system wherein data is interpreted in the same way as manufactured product Ballou et al. [1998]; Wang and Kon [1993]; Wang et al. [1995]. Both can incorporate a subjective (User perspective) or/and an objective (data-oriented perspective) assessment of each item of data in all quality analysis phases: Defining, Measur-ing, AnalysMeasur-ing, and Improving. Process and data views are intrinsic benchmarks against which quality can be improvedRedman[1996]. A proper implementation of these views is intended to ensure continuous quality improvement for both organisational processes and data sources.
Significant contributions made in data quality research proceed from the process-oriented viewpoint. There are three main roles in the data production process: data producers who are in charge of the process in which data is gener-ated; data custodians who take responsibility for providing, managing and main-taining data storage; and data consumers (people or groups who use data)Strong et al. [1997]. Authors support the process view, arguing that conducting data quality research by defining, measuring, assessing and improving data quality dimensions directly from a database and/or a data warehouse are insufficient solutions when it comes to ensuring uniformly high data qualityDasu and John-son [2003]; Redman [1996]; Silvers [2008]. Their main argument is that errors are likely to arise and so be stored again in data source systems. Therefore, the adoption of a process view enables manages and decision makers to identify and understand the root causes of quality problems Dasu and Johnson [2003]; Redman[1996];Silvers[2008] and therefore ensure a continuously high quality of data. Data quality literature includes several approaches that address different quality dimensions based on a production process view Lee et al. [2002]; Strong et al. [1997]; Wang and Strong[1996].
However, it is crucial to note the several drawbacks that are associated with a process-oriented view. The major drawback being that decisions made regarding quality issues are subject to data custodians’ opinions. This could cause conflict to arise between custodians when determining whether or not a nominated case is experiencing a quality problem. The level of conflict among custodians is dramat-ically increased, and can also become out of control, in response to the complexity and dimensionalities of data quality problems. Moreover, the ultimate decision as to the quality of a process view is highly dependent on measuring and checking
quality in systems sources: i.e. the database and the data warehouse. Users who are using a process view need to measure different data quality dimensions in-cluding: outliers, completeness, currency and accuracy. An additional drawback is the complexity and time consuming nature of applying a process view, because data quality measurement is a continuous procedure involving several continuum phases. Thus, restrictions apply when solving quality issues using a process view only, as it is not possible to guarantee continuous and sufficiently regular quality monitoring and maintenance for large database and data warehouses. Finally, the process view relies on human involvement to deliver data quality solutions; again this increases costs incurred in terms of both time money and makes quality control a tedious procedure.
There are various statistical and data mining approaches to objectively deliver data quality solutions. These methods can potentially benefit the process view by examining quality problems, identifying common patterns among defective data, benchmarking of organisational processes and recommending appropriate solu-tions. To this end, the literature reveals that increased attention has been paid towards data quality research from the perspective of a data-oriented view. The main motivation to utilise a data-oriented view to develop data quality solutions is that the most severe quality issues are pertinent to the values of the data. Thus, a proper method of data quality measurement from a data-oriented perspective is required. Also, a data-oriented view offers solutions to reduce and illuminate the involvement of manual inspection over poor data, as data-oriented methods utilise semi and fully automated techniques to deal with different data quality problems. Hence, a data-oriented view has great advantages compared with the process-oriented view, especially with time and cost efficiency, but also in terms
of the possibility for continuous monitoring and for controlling the quality in a database and data warehouse.
Despite the advantages of employing a data-oriented view, the literature to date is limited, in that it mainly focuses on the detection and correction of poor data. A comprehensive classification of dirty data based on data view presents in Kim et al. [2003]. Study in Kim et al. [2003] investigates the appearance and manifestation of different dirty data in a database and data warehouse. The authors present a taxonomy structure to describe different types of dirty data and identify the causes of these data. The authors also present another taxonomy that describes possible solutions for each item or set of dirty data. However, to the ability to detect and correct dirty data is not a solution to the requirement to provide automated data quality solutions. Users cannot rely on these methods to capture the root causes of problems, nor can they apply them to measure the quality of changes in the database.
2.2.1
Data Quality in a Database
There are many sources that increase the data quality problems that occur in a relational database. Paper Kim et al. [2003] illustrates different categories of dirty data and describes the reasons that cause them to arise. These causes can be grouped into two fundamental elements. The first element is associated with human activities: Users generate different types of errors by deliberately or mistakenly entering incorrect, outlier or incomplete data. The second element is associated with a poor and improperly designed original database. The design of a database can positively or negativity impact on the quality of the database
Figure 2.2: Quality Problems in a Database
as it evolves. Specifying constraints in the schema level of the database plays a major role in addressing quality issues such as incomplete or outlier data.
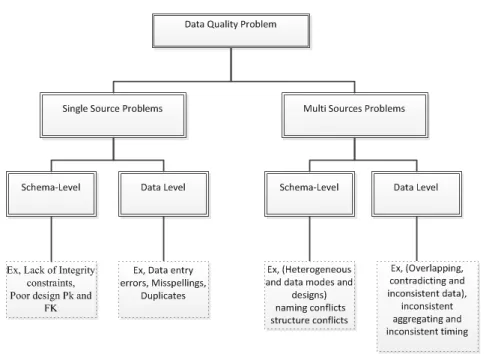
A Study in Rahm and Do [2000] classifies quality problems in a relational database into two areas: Single source problems and Multi source problems. Within each area, quality problems appear in both schema and instance levels. Figure 2.2 illustrates quality issues in the relational databases from single and multi sources.
Paper Rahm and Do [2000] goes on to define the quality problems in single and multiple databases as follows:
Single-Source Problems
• Schema Level problems: occur because of a lack of appropriate model spe-cific or application spespe-cific integrity constraints.
• Instance Level problems: relate to errors and inconsistencies, such as mis-spellings, that cannot be avoided at the schema level.
Multi-Source Problems
• Schema Level problems: are caused by naming conflicts; involving either using the same name for different objects, or using different names for the same objects. In addition, structural conflicts can occur with many varia-tions, referring to different representations of the same object in different sources, for instance, attribute vs. table representation, different compo-nent structure, different data types, different integrity constraints, etc. • Instance Level problems: reflect data conflicts, which means that data is
represented differently in different sources. Moreover, even when data has the same attribute name or data type, there may be value differences.
It becomes more difficult to address quality at the instance or schema levels, particularly when the user is dealing with dimensions of outlier data. At the instance level, users either need to rely on domain experts or automated outlier detection methods to detect outlying values. Detecting outlier values by relying on domain experts is not an efficient solution due to the vast volume of data. However, automated outlier detection methods also encounter some difficulties with correctly flagging outlier records and outlier values, in such a way as to efficiently scale with large dimensional databases; as discussed in Section 2.5.
The quality of a schema mostly relies on setting different constraints. The use of constraints enforces users to follow rules associated with these constraints, and therefore guarantees that no data breaches the constraints stored in the database.
For example, in the incomplete data quality dimension, a database designer can set a constraint that enforces users to not leave missing fields. This ensures that no missing values appear in the database. However, specifying constraints for outlier data is difficult to incorporate into a design. The reason being that the database designer typically has no foreknowledge of what outlier values might emerge or be expected.
The only possible way to guarantee prevention of outlier data is through the use of triggers. Triggers are sets of rules that are generated from the outlier data itself. Hence, experts can initially mine a database to detect outlying values from the instance level. After outlier values are exposed, experts investigate the association between these and existing attributes in order to generate rules that prevent new throughput outliers; this reduces the efficiency of the cleaning system because the system needs to verify every new item of data with a set of trigger rules. Although, the trigger is essential to prevent outlier values, users need to find an innovative approach to detect and find the association(s) among outlier records.
2.2.2
Data Quality in a Data Warehouse
Data warehousing is one of the most promising technologies used to assist mid-dle and senior management teams. It provides details of historical information for business needs to enhance the decision making process Elmasri and Navathe [2007]. There is no unifying definition of a data warehouse as it is normally some-thing developed by numerous organisations to meet their business requirements. However, generally a data warehouse can be defined as a ”store of integrated data
from multiple sources, processed for storage in multidimensional model ”Elmasri and Navathe [2007].
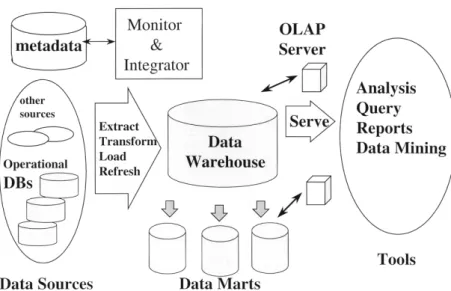
When designing a data warehouse the developer is heavily depend on the ETL (extraction, transformation and loading) processes. ETL processes are re-sponsible for performing essential steps that include: extraction data from het-erogeneous sources, cleansing tasks, customisation and loading data into a data warehouseVassiliadis et al.[2001]. These activities involve significant operational challenges and complexities. Figure 2.3Chaudhuri and Dayal [1997] describes the processes of designing a data warehouse and the task of implementing the ETL processes. The literature provides various models to deal with complex-ity, usability and the price of ETL tools. Papers Vassiliadis et al. [2000, 2001] present a uniform meta model for ETL processes, activity modelling, contingency treatment and quality management. In their studies the authors of Vassiliadis et al.[2000], propose a methodological approach, describing how semantically rich meta-information in a data warehouse can be stored in a meta data repository.
However, due to the many data quality problems that have been seen to af-fect data warehouse projects, implementation of the ETL process is exceptionally challenging. Even though, the ETL process incorporates some data quality de-tection and assessment capabilities, the numbers of the constraints and specified triggers that would be required in ETL processes to control dirty data are pro-hibitively large. This undoubtedly increases the operational process elements of ETL systems. Additionally, the ETL process does not in any way guarantee that clean and reliable data is present in a data warehouse. Moreover, users cannot determine if the data being loaded into a data warehouse reflects the same data as that present on relational databases Silvers[2008].
Figure 2.3: Data Warehousing Architecture
Since data warehouses typically contain large volumes of data gathered from heterogeneous sources, it is essential that they ”support highly efficient cube computation techniques, access methods, and query processing techniques ” Han and Kamber [2001]. The support of OLAP cube (on-line analytical processing) computation of data in the data warehouse allows users to analyse data to search for business intelligence. The OLAP cube includes operations such as slice and dice, drill down, roll up, and pivot, which support the heretical structure view of the data warehouse. Figure 2.4 illustrates a data cube consisting of three dimensions: Date, Products, City. By employing OLAP operations, executives and analysts can view information in the data cube from several details on the top level to more details when drilling down to the lowest level of the cubeChaudhuri and Dayal [1997]; Ge et al. [2003] as shown in Figure 2.4Chaudhuri and Dayal [1997].
Figure 2.4: Multidimensional Data CubeMessaoud et al. [2006]
information based on multiple levels of granularity, the OLAP cube does not have the capabilities to automatically explain associations amongst data Messaoud et al. [2006]. Therefore, several data mining techniques, in conjunction with OLAP cube capability can be useful in acquiring interesting knowledge from the data warehouse Messaoud et al.[2006]. Particularly in reference to data quality, the OLAP cube and data mining techniques have brought significant advantages when seeking to automatically define, detect and improve on different data quality problems that emerge in a data warehouse Berti-Equille [2007].
Despite the contributions of these methods, particularly for dealing with out-lier problems, they mainly focus on detecting outlying values for the purpose of enhancing the accuracy of the data mining algorithms, such as for classification and clustering. Because of this, users cannot rely on these studies to provide a complete automated outlier solution. To move towards automated data quality for the dimension of outlier data, experts need to take a broad view, to ensure that their systems detect outlier values, provide complete assessment of outlier behaviour and trigger outlier values. Moreover, existing outlier algorithms to some extent, creating efficacy and effectiveness problems when dealing with a
Figure 2.5: Knowledge Discovery Process Fayyad et al.[1996] large dimensional database or data warehouse.
2.3
Knowledge Discovery in Database
The Knowledge discovery in database (KDD) is a continuum with steps that interactively and iteratively depend on each other. In real life applications, ex-tracting useful knowledge to support business needs is a difficult task. The rapid growth in data size and technologies, as well as the availability of storing and ac-cessing different data types includes: structured data, text data in web, images, videos increase the necessity of adopting the KDD process in Figure 2.5 from paper Fayyad et al.[1996].
2.3.1
Knowledge Discovery Processes
The Knowledge discovery process is generally classified into two areas: Pre-processing steps and Post-Pre-processing steps. The pre-Pre-processing stage includes: data cleaning, data selection and data transforming, whereas post-processing
consists of data mining, pattern evaluation and knowledge representation. These steps that occur in both pre-processing and post-processing are seamlessly related to each other. Figure 2.5 shows the phases of the knowledge discovery process, as briefly described in the following points:
• Data Cleaning: This step concerns data quality in the database and the data warehouse. Data must be checked and cleaned prior to moving it forward in the KDD process. Many quality problems are handled at this stage including: outlier or noisy data, missing fields and inaccurate data Fayyad et al. [1996].
• Data Selection: This phase is very useful for reducing the dimensionalities of the dataset. In the data selection stage, users need to select useful features to represent the data. The selection of such features varies and depends on the goal of the data mining task.
• Data Transformation: In this stage, the data is transformed and consoli-dated based on the specified data mining tasks. Transformation methods include: normalisation, aggregation, generational and attribute redesign, which can be used in transforming data.
• Data Mining: This stage refers to the data mining tasks that users tend to adopt in a nominated KDD project. There involve the number of data mining tasks: pattern summarisation, classification, clustering and associ-ation rule mining. Based on the data mining tasks, there are a numbers of techniques and algorithms that can be used to identify the patterns from the data. This usually results in huge and meaningless numbers of patterns.
• Pattern Evaluation (interpretation): Data mining tasks often produce an overwhelming number of meaningless patterns. Users need to evaluate and interpret these patterns to identify those interesting patterns that are rele-vant to the targeted application.
• Knowledge Representation: After locating interesting patterns, users need to encapsulate these patterns in knowledge. This knowledge can be in-corporated and represented by users or the system in order to apply this knowledge to unseen data.
2.3.2
Data Mining Tasks
Data mining is defined as a process involving the extraction of useful and inter-esting information from the underlying data Han and Kamber [2001]. Based on the specific application, users can deploy a single data mining task or can com-bine more than one data mining tasks in order to extract useful and interesting information. Data mining tasks can be described as follows:
• Pattern summarisation: The main problem in data mining is that the total number of patterns is considerably large. Even after filtering out some of the more frequent patterns that fall over the specified minimum threshold, the number of patterns remains huge. Thus, manual examination by domain experts over the patterns is undoubtedly difficult to achieve. Therefore, it is essential to adopt pattern summarisation methods, such as the profile-based approach presented in Yan et al.[2005] to allow for significant reduction in the number of patterns.
• Classification: is a supervised data mining technique. It aims to correctly classify a set of features related to set classes. The function or the model that emerges between set features and classes in the training data can then be used to predict the classes for new data in the testing set. The accuracy of the model depends on accuracy when assigning a set of features or objects as belonging to classes Han and Kamber [2001].
• Clustering: is an unsupervised data mining technique. In clustering, in-stances are divided and grouped into a number of clusters based on the resemblance between instances. Those instances belonging to the same cluster share many characteristics. A classic clustering technique, which is based on K-means, involves the user initially specifying the number of desir-able clusters, as K. Then, based on the ordinary Euclidean distance metric, instances are assigned to the closest clusters Han and Kamber [2001]. • Association rules mining: is one of the most powerful data mining
tech-niques. Association rule mining was first presented inAgrawal et al. [1993] for use when mining frequent itemsets in transaction databases, and has since then been developed for the purpose of mining frequent itemsets at multiple levelsHan and Fu[1995,1999] and intertransactional itemsetsFeng et al. [2002]; Tung et al. [2003]and correlations between itemsets Shichao et al. [2006];Tsumoto and Hirano[2003] . Association rule mining includes two phases. The first phase is called pattern mining; that involves the discovery of frequent patterns. The second phase is called rule generation and involves the discovery of interesting and useful associations rules in discovered patterns. The association rule is somewhat useful for measuring
associations between itemsets.
2.4
Data Mining Techniques
2.4.1
Frequent Pattern Mining
All data mining tasks including association rule mining, classification and clus-tering are designed for use with frequent patterns. Frequent Patterns Mining involves:
• Frequent Item Set Mining • Frequent Sequence Mining: • Frequent Tree Mining: • Frequent Graph Mining:
This literature review section of the thesis mainly focuses on frequent pattern mining as this is the type that is most related to the method proposed in this thesis. Frequent pattern mining was introduced in Agrawal et al. [1993]. The Apriori algorithm from paperAgrawal et al.[1993] involves a bottom up searching approach, which initially begins with a single item, extending to long item sets at the lowest level. Apriori algorithms consist of two steps: candidate generation and rule finding. The procedure for an Apriori algorithm is summarised as follows:
• Specifies the minimum support to distinguish between frequent and infre-quent items.
• Scan over the database and compute the candidate C1 for one item and its support.
• Pruning all items in C1 that have less support than the specified threshold. threshold.
• Rescan the database to compute the candidate C2 for two frequent items and pruning all items with supports below the support threshold.
• Repeat the above step till no further candidate can be found.
However, the candidate generation process from the Apriori algorithm often takes a long time to find all frequent item sets. This step also includes additional noise Pei and Han [2002]. Studies by Han et al. [2000, 2004] focus on finding frequent items without including the step of candidate generation. Papers Han et al. [2000, 2004] propose a frequent pattern tree FP-tree structure; an FP tree based mining method and FP-growth for mining complete frequent patterns. These techniques have been shown to afford significant advantages with regards to compressing large data sets into much smaller data sets and when avoiding the cost of generating large number of candidate sets.
Yet the number of item sets and the quantity of rules generated is still large. Several studies attempt to reduce the size of frequent items by constructing con-densed representations of frequent item sets. Paper Bayardo Jr [1998] presents a MaxMiner algorithm for mining maximal frequent patterns. The Max-Miner algorithm extracts the maximal frequent item sets, wherein the item set is con-sidered as a maximal frequent if there is no frequent superset. A study fromZaki et al. [1999] introduces the CHARM algorithm for mining closed item sets. The
CHARM algorithm explores both item set spaces and also creates a set space which enables the algorithm to utilise a fast search method to identify the closed frequent item sets, rather than the many non closed subsets Zaki et al. [1999]. Other contributions on condense representation of frequent item sets proposes in Calders and Goethals [2002, 2007].
2.4.2
Association Rule Mining
Association rule mining was first introduced by Agrawal et al. [1993] in order to identify interesting relationships between items in a data set. The authors devel-oped two algorithms, Apriori and AprioriTid, to discover all significant associa-tion rules between items Agrawal and Srikant [1994]. Association rule mining is useful because it provides the user with objective measures based on the structure of patterns and statistics. An association rule is an implication X → Y, where X and Y are sets of items of transactions from a single table, relational tables, or several rows and tables in a given database. Thus, whenever a transaction contains all itemsx∈X then this transaction is likely also to contain all y y∈Y with probability Hipp et al. [2001]. The following section show the formula for computing support and confidence:
• Support is the probability of transactions that contain X∪Y. This can be measured by using the following formula:
Support(x→y) = P(XT∪Y)
,where Σ(X∪Y) is the total number of transactions that contain bothX∪Y and T is the total number of transactions.
• Confidence is the conditional probability which can be computed using the following formula:
Conf idence(x→y) = P(XX∪Y)
where Σ(X∪Y) is the total number of transactions that contain bothX∪Y and X is the number of transactions X.
However, generating all association rules from frequent item sets is a time consuming activity Han and Kamber [2001] and can generate many redundant rules Xu and Li [2007]; Zaki [2004]. A number of studies have endeavoured to reduce the number of rules by finding close rules Zaki et al.[1999] and deduction rules Calders and Goethals [2002, 2007]. Papers Chen et al. [2005]; Messaoud et al. [2006] expand association rule mining from market basket data into a more multi-level data cube structure Chen et al. [2005]; Messaoud et al.[2006].
2.4.3
Rough Set Theory
Rough set theory was introduced by Pawlak [1991]. It is a mathematical ap-proach that deals with the discernibility of objects and Boolean reasoning in information systems. Rough set theory (RST) or granule mining has the ability to discern differences and similarities between objects in most efficient way which can be useful for many KDD applications. RST has become one of the ten most popular theories applied by the data mining community. The successful contri-bution of RST in different applications including classification, association rules, dimensional reduction, patterns extraction and others, has demonstrated its im-portance and versatility. The fundamental concept of RST is described inPawlak
[1991, 2002]. Paper Pawlak and Skowron [2007a] provides a survey analysis of all well known literature on data mining machine leaning and other knowledge communities that adopt RST.
The philosophy of RST depends on the assumption that with every object in the universe there is a certain level of indiscernibility among some information (data, knowledge). Using RST, users can describe the knowledge in the informa-tion tables Pawlak and Skowron [2007b]or multi-tier structures Li[2007]; Li and Zhong[2003];Yang et al.[2008]. Additionally, users can represent the association among the data.
A transaction database can be formally described as an information table (T, VT), where T is the set of transactions, and VT = {a
1, a2, . . . , an} is the
set of items (or called attributes) for all transactions in T. For example, the following transactions: t1 =a1a2;t2 =a3a4a6;t3 =a3a4a5a6; t4 =a3a4a5a6;t5 =
a1a2a6a7; and t6 =a1a2a6a7 can be read as an information table (T, VT), where
T ={t1, t2, . . . , t6} and VT ={a1, a2, . . . , a7}.
LetX be anitemset, a subset ofVT. Itscoverset is the set of all transactions (or objects) t∈T such thatX ⊆t, and its support is |coverset|T|(X)|. An itemset X is called frequent pattern if its support ≥min sup, a minimum support. Given a set of transactions (objects) Y, its itemset denotes the set of items (attributes) that appear in all the objects of Y. Given a patternX, its closure closure(X) = itemset(coverset(X)).
Definition 1 A pattern X is closed if and only if X =closure(X). X is called a max closed pattern if its all super patterns are non-closed, where pattern Y is called a super pattern of X if Y ⊃X.
Table 2.1: A relational table Object (Transaction) a1 a2 a3 a4 a5 a6 a7 t1 1 1 0 0 0 0 0 t2 0 0 1 1 0 1 0 t3 0 1 0 1 0 1 1 t4 0 1 0 1 0 1 1 t5 1 1 0 0 0 1 1 t6 1 1 0 0 0 1 1 t7 0 1 0 1 0 1 1 t8 1 1 0 0 0 1 1 t9 0 0 1 1 0 1 0 t10 0 0 1 1 1 1 0 t11 1 2 2 0 1 0 2 t12 2 1 1 2 2 2 0 t13 0 2 1 2 2 2 2
the meaning of granules, we use the ”Group By ” operation with an example. We firstly represent the example information table (T, VT) as a relational table
(Table 2.1). We then use the following SQL statement: select*, count(*) assup group by a1, a2, a3, a4, a5, a6, a7
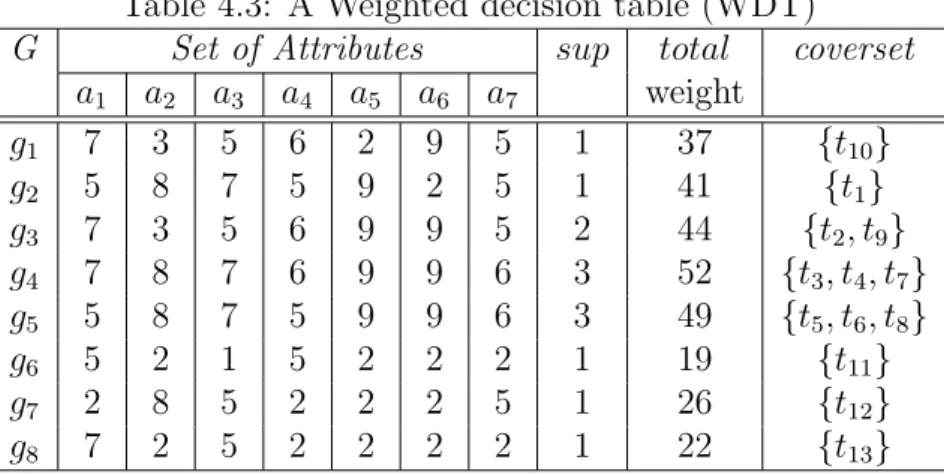
to group the relational table into a decision table (Table 2.2) which classifies the seven attributes into condition attributes, C ={a1, a2, a3, a4, a5}, including high
spares attributes where the the number of granules in decision table is almost as the same on number of records in transaction table; and vice versa in decision attributes, D={a6, a7}, which include less spares attributes.
Definition 2 Formally, we call the tupleDT = (T, VT, C, D) a decision table of (T, VT) if C∩D=∅ and C∪D⊆VT.
Each row in the decision table is a granule, which can be viewed as a pred-icate that describes common features of a set of objects (transactions) for a se-lected set of attributes (or items). For example, in Table 2.2, the set of granules U ={g1, g2, g3, g4, g5, g6, g7, g8}, where sup is the number of objects (or
![Figure 2.5: Knowledge Discovery Process Fayyad et al. [1996]](https://thumb-us.123doks.com/thumbv2/123dok_us/10220083.2925864/47.892.198.727.189.400/figure-knowledge-discovery-process-fayyad-et-al.webp)
![Figure 2.6: The main phases of the assessment methodology Batini and Scanna- Scanna-pieco [2006]](https://thumb-us.123doks.com/thumbv2/123dok_us/10220083.2925864/67.892.168.816.179.466/figure-phases-assessment-methodology-batini-scanna-scanna-pieco.webp)

![Figure 6.1: Error Distributions Fisher et al. [2009]](https://thumb-us.123doks.com/thumbv2/123dok_us/10220083.2925864/118.892.223.710.178.386/figure-error-distributions-fisher-et-al.webp)

