Mobile Money in Pakistan
Use,
barriers and
ExEcutivE Summary . . . .3
GloSSary . . . .6
mEthodoloGy . . . .7
PakiStan country ProfilE . . . .8
mobilE monEy adoPtion . . . .9
Mobile money adoption at the household level . . . .9
Mobile money adoption at the individual level . . . .10
The Pakistani m-money services market . . . .10
M-money use patterns . . . .12
Barriers to and motivators for m-money adoption and registration . . . .12
houSEholdS’ financial routinES and thE rolE of mobilE monEy . . . .14
Remittances: Sending and receiving patterns . . . .14
Non-remittance payments: Sending and receiving patterns . . . .18
Mechanisms for household savings . . . .19
Insurance and loans . . . .19
Economic ShockS and hoW houSEholdS rESPond to thEm . . . .22
Negative economic shocks . . . .22
Positive economic shocks . . . .23
concluSionS . . . .24
EndnotES . . . .25
table of Contents
eXeCUtiVe sUMMary
In 2011, the Bill & Melinda Gates Foundation’s Financial Services for the Poor (FSP) program commissioned InterMedia to design and implement a project to track the uptake, use and market potential of mobile money (m-money) services in Pakistan, Uganda and Tanzania.
The findings from the Financial Inclusion Tracker Surveys Project (FITS), which includes annual panel-based surveys conducted on a national scale, are intended to support the m-money activities of the Bill & Melinda Gates Foundation, development organizations, mobile operators, regulators and others who play active roles in m-money ecosystems. The surveys also are designed to facilitate analyses of m-money’s relationship to household financial behaviors, particularly a household’s ability to manage economic shocks.
This summary presents the key findings from the first annual FITS survey of 4,940 households in Pakistan conducted in May through September 2012. The first annual FITS Uganda and Tanzania survey reports, as well as the Pakistan survey report, are available on AudienceScapes, InterMedia’s online research knowledge base, at www.audiencescapes.org/FITS.
PakiStan and mobilE monEy
Based on the survey findings, nine in 10 Pakistani households—including poor, rural and unbanked
households—have access to a mobile phone and a SIM card. However, the rates of m-money registration and use are low.
The survey results suggest that barriers to m-money registration and/or use differ for those using m-money through an agent/over-the-counter (OTC) service and nonusers. OTC users feel they have no need to register because they can access all necessary services through the agent. An insufficient understanding of the services and the limited number of m-money users within respondents’ social networks (friends and family members) appear to be additional barriers to m-money registration among OTC users.
Among nonusers of m-money, insufficient awareness (60 percent of nonusers know about the services) seems to be the most common reason for not using mobile money.
Survey data point to several financial service areas with potential for market growth. Non-remittance payments provide the largest opportunities for m-money expansion. Ninety-four percent of surveyed households reported sending at least one payment in the past six months, with the government (69
percent of payments) and utility companies (24 percent of payments) receiving the largest number of those cash payments. Ten percent of households reported receiving payments in the past six months, with the government serving as the sender of two-thirds (72 percent) of those payments in the form of salaries and/ or benefits. Currently, only about 1 percent of incoming and outgoing payments reported by the surveyed households are serviced through m-money; the majority of these payments are delivered by hand.
Another area for potential m-money growth is savings. Two in five households report saving money in one way or another, including one in five households that save with formal financial institutions. However, even among households that use m-money, saving on an m-money account is rare (0.4 percent). Since a large group of households already use traditional bank and microfinance institution accounts for their savings, these households may be the primary target audience for switching over to m-money as their savings method. Village-level saving groups and cooperatives might offer additional potential for m-money expansion if
Currently, markets for remittances, insurance and loans are very small. Among surveyed households, in the past six months, only 4 percent sent or received money (as opposed to food or other goods), 5 percent borrowed money and 2 percent owned insurance. However, the m-money experience in Kenya, the pioneer in m-money development in Africa, serves as a good example of how use can change with mobile money expansion. Within two years of m-money’s introduction to the Kenyan market (by 2009), Vodacom M-PESA was able to displace formal and informal remittance-delivery channels previously available to the poor
populations and stimulate uptake in remittance frequency and volume.1,2,3 Moreover, the two leading m-money providers in Pakistan, Telenor and UBL Omni, are seeing a healthy increase in remittance payments each month, which confirms that, while currently small, the remittances offer an opportunity for m-money market expansion in the near future.
Only 5 percent of Pakistani households use m-money.
Themost common way
to access m-money services is through anover-the-counter
(OTC) option in which all transactions are conducted by an m-money agent on an m-money user’s phone (83 percent of m-money transactions).At the
household level, m-money use does not seem to be closely
correlated
to
either thehousehold’s socio-economic status
(banked or unbanked, poor or well-off) orwhere they are located
(urban or rural). keyfindings
Despite a relatively slow pace of uptake,
98 percent of OTC users
said they are eithervery likely
orsomewhat likely to recommend mobile money to others
. The same percentage is very or somewhat likely to continue using m-money services in the future.At the individual m-money-user level, gender is the strongest predictor of m-money use.
Ninety-five percent of m-money users are males and only 5 percent are
females
. Aside from females, individuals aged 55+ and those with less than a secondary education are the least likely to be using m-money.Telenor Easypaisa has 92 percent of the household m-money market
; the other three m-money products share the rest of the market.AGENT
Very few households have registered accounts (0.3 percent). The use of m-money via accounts of relatives, friends and other acquaintances is also infrequent.
Subsequent FITS survey reports will monitor market growth and measure whether challenges to greater adoption of m-money have been overcome, particularly among the unbanked and those living at the bottom of the pyramid.
InterMedia FITS data, reports and related analyses are disseminated to stakeholders in the financial access community, both in the countries studied and globally, to help inform policies and practices in the field of financial inclusion. InterMedia also is making the data and analyses available on AudienceScapes (www.audiencescapes.org/FITS).
Remittances delivered using m-money tend to have different purposes
than remittances delivered by hand. M-money is mostly used for remittances related to eitherbusiness or informal loan payments, and accommodates long-distance
money-transfers
(50km and farther) sent by friends and members of households living elsewhere.Households with m-money users
are more likely than households without users tosend or receive remittances, save money and own some type of insurance
. They also are more likely to send and receive monetary remittances and payments as opposed to sending or receiving food or other goods.Hand-delivery is generally used to bring remittances to family members
and friends living close by
(10km or closer). Theseremittances are part
of regular financial support
or are sent to help with economic shocks (e.g., marriage). Most non-remittance payments, insurance payments and loan repayments also are done in-person.Twenty-eight percent of surveyed households experienced economic shocks in the past six months.
Receiving remittances in response to
a negative economic shock was rare among households with and
without m-money users
. However whenremittances are sent in
response to a negative economic shock, they have one of the highest
median monetary values, at $10.90, among all possible financial help
reported by households affected by negative economic shocks.
Thirty-nine percent of Pakistani households save money
, but using an m-money account to do so is uncommon.Households with m-money users are more likely to save with
financial institutions
(banks or microfinance institutions) and other people. Households with no m-money users mostly save with community-level savings instruments or in hiding places.Banked households—Households that reported saving money in at least one bank account (including microfi-nance institutions) in the six months prior to the survey . Burial societies—A “society” of friends who voluntarily contribute funds used as life insurance . Funds are paid out to family members upon the death of a member of the society for funeral and other expenses .
“Cashbox” or “mattress method”—Saving methods . Savings are kept in a hiding place at home or on a person . Chingchi—A motorcycle rickshaw .
Committee system—A group of individuals who pool their savings . On a regular basis (daily, weekly or monthly) each individual puts the same amount of money “into the pot” and, on a revolving basis, one per-son takes the total amount of money .
Cooperative—Member-only association offering savings accounts; the accounts do not have an expiration date . Credit at a local store (e .g ., Udhaar per Sauda)—A delayed payment . A local shopkeeper gives a customer goods or services without an immediate payment but with the expectation the customer will pay the bill at the end of the month, or whenever the household has money . Economic shock—An unexpected event that has a major impact on a household’s finances, either posi-tive (e .g ., inheriting money) or negaposi-tive (e .g ., spending money on hospital care for a sick household member) . E-float—When accepting deposits of cash from custom-ers, a mobile money provider issues a commodity known as “e-float,” measured in the same units as the national currency and held in a registered account under a user’s name . When a person sends/receives money through an agent, the agent has to have e-float (money on the agent’s account) available to transfer to the recipient’s account . Otherwise, the transaction cannot be completed . Gifting circle—A group of individuals, who meet on a monthly basis and gift each other possessions (e .g ., domestic appliances or money) or services (e .g ., house construction or land cultivation) to help each other save money or boost each other’s incomes . Gifts, money and services are offered on a revolving basis .
glossary
M-money—mobile money .
Mobile money deposit—One of the transactions m-money users can perform using their own or an agent’s account to “cash-in” (i .e ., put money in the account) . Sometimes, when using an agent’s account, m-money customers are required to prepay an informal “deposit fee” in addition to the money they are sending via m-money and the fees they pay for using the service . Non-remittance payments—Formal payments sent to the government, educational institutions, financial insti-tutions (e .g ., banks) or private businesses . Non-remit-tances include payments of taxes, fines or fees, utility bills, goods, debt or insurance payments . Payments might include formal credit disbursements and repayments . Over-the-counter (OTC) transaction—A mobile money transaction method akin to a Western Union wire transfer where the customer does not have an account, but simply hands over cash to an agent . The agent then facilitates the transaction on the customer’s behalf using their own mobile money account .
Remittances—Money or its equivalent (food or goods) sent from one household to another . Remittances include any informal credit and debt repayments between family members or friends who live elsewhere, any repayment of debts, or payments for goods and services .
Rural households—Rural households are defined according to their location in rural enumeration areas as prescribed by the Federal Bureau of Statistics .
SIM card—A removable micro-card that contains a sub-scriber identity module that securely stores the electronic codes used to verify subscribers’ identities on mobile phones and computers .
Urban households—Urban households are defined according to their location in urban enumeration areas as prescribed by the Federal Bureau of Statistics . Village-level saving groups—Members deposit small amounts of money with an informal savings group for a year . At the end of the year, they share the money they paid into the account .
The InterMedia FITS household studies in Pakistan, Tanzania and Uganda are three-year panel studies consisting of annual waves of face-to-face household surveys (N=4,940 households in Pakistan), and three telephone mini-surveys per year with the same house-holds, conducted between each annual wave .
The core of the wave questionnaire covering house-holds’ financial behaviors is roughly the same in all three countries to allow for cross-market comparisons .
Methodology
Some sections and questions, however, are tailored to the local context to allow for a more accurate assess-ment of the developassess-ment of m-money in different financial, regulatory and socio-cultural environments . This report presents the findings of the first wave survey in Pakistan conducted May-September 2012 . Separate reports address the first wave surveys in Tanzania and Uganda .
a note on data analysis and reporting
The InterMedia FITS surveys are designed to collect trend data primarily about m-money use and overall financial behaviors at the household level - that is, the data represents collective usage patterns for entire households . The households for this panel were selected from a random sam-ple frame and thus their usage and behavior patterns are representative of usage and behavior pat-terns of Pakistani households in general .
In addition to the household-level data, the surveys gather data on behaviors and experiences with m-money services, based on interviews with individual over-the-counter (OTC) users among members of the selected households . According to the study design, one OTC user was selected for the interview in each household with OTC users . In households with more than one OTC user, the user with the most recent birthday was interviewed . The results of these individual interviews are not representative of individual m-money users throughout Pakistan because the interviewees were not chosen from a random sample frame .
This report contains no analysis of behaviors and experiences of registered users of any of the four m-money products because the number of registered users was not sufficient for valid analysis (n=17) .
Throughout the report, the amounts of transaction costs, total amounts sent or received, and var-ious other expenditures are based entirely on the head of household’s reporting about the activi-ties of every member of the household . These numbers, therefore, should be treated as estimates rather than exact numbers .
Pakistan CoUntry Profile
GEnEral EnvironmEnt
Pakistan is located in Southern Asia and borders the Arabian Sea and four countries: India, China, Iran and Afghanistan . The country is divided into four provinces: Baluchistan, the Khyber-Pakhtunkhwa (KPK), Punjab and Sindh . There are also the Federally Administered Tribal Areas (FATA), the Federally Administered North-ern Areas (FANA), and the Islamabad Capital Territory .4
The state of Pakistan emerged in 1947 as a result of the partition of the Indian subcontinent . In March 1971, the civil war led to a split between East and West Paki-stan and the establishment of two new states: Bangla-desh and Pakistan, respectively .5
Pakistan’s population is estimated to be about 190 mil-lion6 with approximately one-quarter of Pakistanis
liv-ing below the poverty line (i .e ., below $2 per day), and about one-half considered illiterate .7 Only 10 percent of
the population reports having a bank account .8
tElEcommunicationS EnvironmEnt
With the help of foreign and domestic investment, Pakistan continues to grow its mobile sector . In 2011 and 2012, the mobile subscriber base increased by an estimated 10 percent annually . Currently, the number of mobile subscribers is estimated at about 120 million . Ninety percent of the population lives within areas with mobile-network coverage and most have access to a mobile phone .9
The five leading Mobile Network Operators (MNOs) —Mobilink, Telenor, Ufone, Warid and Zong10—are
actively competing for a greater share of the subscriber base and revenue . Pakistan does not currently have a 3G network and growth in the country’s fixed-line (dial-up, DSL, broadband and cable) internet remains sluggish .11
The Pakistani mobile money (m-money) market offers four products: Telenor Easypaisa, United Bank Limited (UBL) Omni, Ufone Upayments and Muslim Com-mercial Bank Limited (MCB) Mobile . In addition, Mobilink offers SMS (text) banking to Citibank, MCB, Standard Chartered Bank (SCB), UBL and Emirates Global Islamic Bank (EGIB) account holders . Another
Mobilink financial service, Citibank Mobilink Genie, allows Citibank customers to pay mobile phone bills, buy airtime, and pay utility bills using their credit cards . Telenor Pakistan and Tameer Micro Finance Bank launched Easypaisa in October 2009 as a financial inclusion vehicle for underserved households in Paki-stan . With more than 20,000 m-money agents around Pakistan, Telenor Easypaisa is the mobile banking ser-vice with the broadest coverage . Through its m-money services, customers can pay utility bills, send/receive money internationally and domestically, donate to charities, top-up a prepaid mobile connection, pay for airline tickets, and receive their pension income . Tele-nor Easypaisa offers over-the-counter (OTC) services, which allow customers to use their own mobile hand-sets to make financial transactions through certified merchants .12
UBL Omni offers mobile financial services at distribu-tion centers at neighborhood markets in 600+ cities across Pakistan . As with Telenor, the services are pri-marily aimed at assisting the unbanked population by allowing them to use their mobile phone numbers as account identifiers . UBL Omni customers can with-draw and deposit cash, make utility bill payments, transfer money domestically and internationally, pay mobile phone and other bills, and purchase airtime . Recently, UBL also introduced an ATM card for its Omni customers .
Ufone Upayments is the mobile banking service offered by Ufone in collaboration with Habib Bank Limited (HBL) and Summit Bank . Customers can inquire about and pay utility bills, buy and pay for prepaid and post-paid airtime purchases, check HBL or Summit Bank account statements, and transfer money to any bank account in the Habib Bank and Summit Bank net-works .
MCB customers can check their bank-account bal-ances, receive mini-statements, transfer funds, purchase mobile top-ups, pay mobile phone and utility bills, make MCB Visa credit-card payments or charitable donations, or buy insurance .
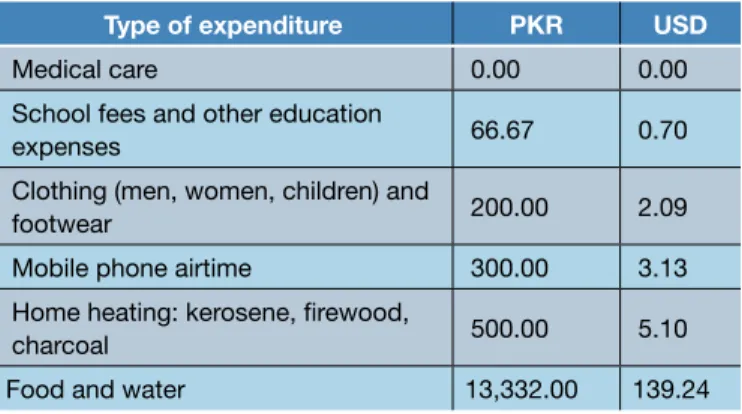
figure 1. median monthly spending on various essentials
mobilE monEy adoPtion at thE houSEhold lEvEl
Based solely on the reported rates of access to mobile technologies, Pakistan has great poten-tial for m-money uptake. Most Pakistani house-holds (89 percent) have access to a mobile phone and own a SIM card (88 percent). The rates are equally high among rural, unbanked and poor households.
However, the survey findings show that currently only 5 percent of households have at least one m-money user.
Based on the findings, an average family in Pakistan spends close to the same amount on mobile phone air-time per month as it does on clothing, but considerably less than what it spends on food and water (Figure 1) . Almost all households own a SIM card and either own or can borrow a mobile phone . While mobile phone access and SIM card ownership increase slightly with income level, 88 percent of poor households, living on less than $2 a day, can access a mobile phone and 86 percent own a SIM card (Figure 2) .
Of the 5 percent of households that have an m-money user, most use over-the-counter (OTC) services
with-Mobile Money adoPtion
Source: InterMedia FITS study of households in Pakistan, May-September 2012; N=4,940.
figure 2. access to mobile communications, by household demographics
Source: InterMedia FITS study of households in Pakistan, April-May 2012; N=2,980.
type of expenditure Pkr uSd Medical care 0.00 0.00 School fees and other education
expenses 66.67 0.70
Clothing (men, women, children) and
footwear 200.00 2.09
Mobile phone airtime 300.00 3.13 Home heating: kerosene, firewood,
charcoal 500.00 5.10
Food and water 13,332.00 139.24
out registering for an m-money account . Only 17 households (0 .3 percent) report at least one registered m-money user (Figure 3) .
Among households using m-money services, 85 percent have only one m-money user, 10 percent have two users and 5 percent have three to six m-money users .
Household m-money use does not differ by rural and urban status or level of household consumption, but banked households are slightly more likely to use m-money than unbanked households: 11 percent versus
Consumption, above $4 a day (n=129) Consumption, $2-$4 a day (n=679) Consumption, below $2 a day (n=4,120) Unbanked (n=4,477) Rural (n=3,369) All households (N=4,940) 88% 89% 86%85% 88% 88% 86%
■ Have or can borrow a mobile phone ■Have a SIM card
88%
98% 98% 96%
5 percent among unbanked households (Figure 3) . The fact that unbanked households are underrepresented among households using m-money is not necessarily an indication of their lack of willingness to adopt m-money in the future . A number of East African countries whose populations use m-money have shown that early m-money adopters are generally wealthier, more urban, and more likely to be banked than nonusers . Over time, however, the service spreads deeper into poor, unbanked, and rural segments of the population .13
mobilE monEy adoPtion at thE individual lEvEl
Access to mobile services and the use of m-money differ significantly by demographic character-istics of individual household members. Male Pakistanis, 35 to 54 years old, and people with a secondary education or higher, are most likely to have access to mobile technology and use m-money services.
The rates of access to, and ownership and use of, mobile phones and m-money are the lowest among females and older Pakistanis (age 55+). Males are three times as likely to have a mobile phone or a SIM card as females . Similarly, Pakistanis aged 35 to 54 are twice as likely to own a mobile phone or SIM card as those aged 55 and older . In addition, mobile phone and SIM-card ownership increase with education .
The rates of m-money use by individual household mem-bers follow the same demographic pattern as that shown in
Figure 4 . In particular, 95 percent of mobile money users are males . M-money adoption and use also varies consider-ably depending on age and educational attainment .
thE PakiStani m-monEy SErvicES markEt The current Pakistani m-money market is domi-nated by Telenor. Most m-money users (registered and unregistered) use Telenor Easypaisa, either exclusively or in combination with other provid-ers. UBL Omni is the second most frequently mentioned m-money product, used by 7 percent of households that use m-money. Ufone Upay-ment and MCB Mobile each has a marginal share of the market.
Telenor Easypaisa is the dominant product in the Paki-stani m-money market; 89 percent of households with m-money users use Telenor Easypaisa exclusively and an additional 3 percent use it in combination with other m-money products .
• The urban/rural breakdown and poverty status of Telenor Easypaisa users closely match the characteris-tics of all households in the sample . Sixty-five percent are located in an urban area and 80 percent live below the poverty line .
• Telenor Easypaisa users are somewhat more likely to have a bank account compared with all households in the sample: 16 percent versus 9 percent, respectively . • Three-quarters of households using Telenor Easypaisa
live in Punjab; one-quarter live in Sindh .
figure 3. m-money use by household demographics
Source: InterMedia FITS study of households in Pakistan, May-September 2012; N=4,940.
Consumption, above $4 a day (n=129) Consumption, above $2-$4 a day (n=679) Consumption, below $2 a day (n=4,120) Unbanked (n=4,477) Rural (n=3,369) All households (N=4,940) 4% 5% 0.3% 5% 4% 5% 0.3% 5% 4%
■ M-money user in a household ■OTC user in a household ■ Registered m-money user in the household 7% 0.3% 7% 6% 0.3% 4% 0.6% 5% 0%
figure 4. access to mobile technologies and use of m-money services among selected members of households, by demographic characteristics
Source: InterMedia FITS study of households in Pakistan, May-September 2012; N=4,940.
figure 5. market share of mobile money service providers among households with at least one m-money user (n=256)
Source: InterMedia FITS study of households in Pakistan, May-September 2012; N=4,940.
figure 6. Percentage of Pakistani households who use m-money (n=256), by region
Source: InterMedia FITS study of households in Pakistan, May-September 2012; N=4,940. Post-secondary education Secondary education Primary education No formal education Age 55+ Ages 35–54 Ages 15–34 Female Male Secondary education+ Primary education No formal education Age 55+ Ages 35–54 Ages 15–34 Female Male 50% 56% 41% 29% 52% 38% 37%
■ Have or can borrow a mobile phone ■Have a SIM card 67% 41% 19% 23% 32% 36%33% 58%55% 96%95% 95% 5% 52% 43% 14% 6% 17% 69% Despite having access to mobile technology and services, females and older Pakistanis (55+) are the least likely among demo-graphic groups to use m-money services. Ufone only, 1% UBL only, 7% 2+ providers, 3% MCB only, 0.4% Telenor only, 89% Sindh (n=1150) 5% Punjab (n=2860) 7% Baluchistan (n=250) 1% KPK (n=680) 0%
m-monEy uSE PattErnS
Most m-money users in Pakistan (83 percent) use the OTC option to conduct m-money transac-tions. OTC m-money transactions are conducted by an agent on an m-money user’s phone.
• OTC customers have no account and thus no mecha-nism to store, access or accumulate funds . Without an account, customers cannot be connected by direct deposit or automatic withdrawal to other institutions (e .g ., employers, insurance providers) who might wish to establish ongoing relationships with them . OTC is thus a “pure-play” payments tool which offers no vehicle to deliver savings, insurance, or other struc-tured financial products .
• Households with OTC users are more likely to be urban, banked and well-off than sampled households in general .
• Based on individual interviews with OTC users, most (85 percent) use mobile money once a month or less . However, more than one-half (55 percent) noticed their frequency of use had increased since they first started using mobile money .
figure 7. demographic profile of households with over-the-counter users
Source: InterMedia FITS study of households in Pakistan, May-September 2012; N=4,940.
barriErS to and motivatorS for m-monEy adoPtion and rEGiStration14
The study revealed that many OTC users feel no need to register an m-money account as they have access to the services they need to make transactions. Insufficient understanding of the services and a limited number of m-money users in respondents’ social networks appear to be additional barriers to m-money registration among OTC users and m-money adoption among nonusers.
• OTC services solve a key problem or “pain point,” in that they give customers the ability to transfer money instantaneously (the same solution that fueled ini-tial m-money uptake in East Africa) . For this reason, OTC services also have proven popular in Pakistan where other money transfer options are of limited utility . However, it appears that the use of OTC ser-vices makes it harder to launch a successful account-based service because the value proposition is less clear: Why sign up for a new product that will require learning how to use the services when people can already pay bills and transfer money by simply walk-ing up to an agent and givwalk-ing him/her the funds? Educating OTC users on the practical uses of reg-istered m-money accounts might stimulate viral adoption of m-money by creating advocates of the services, who are capable of educating and per-suading others within their respective social net-works to use m-money.
When asked why they did not register for an m-money account, most OTC users15 (59 percent) said they
did not see the need to do so as the services available through agents served their needs (Figure 9) .
Some OTC users said they did not know they could register, indicating insufficient knowledge/understand-ing of m-money services and m-money registration . Among nonusers of m-money, insufficient knowledge about the service was the most common reason for not using mobile money . Almost one-half of nonusers said they either were not aware of the services or did not understand them (Figure 10) .
All households (n=4,940)
Households with OTC users (n=234)
Urban Banked Consumption, more than $2 a day 22% 17% 21% 40% 9% 33%
OTC users are more likely to be urban and banked than those in surveyed households in general. They also are better off financially.
■ Households with OTC users (n=234)
The survey data suggest that a personal social network of OTC users plays an important role in m-money uptake both as a driving force and as a potential barrier to registration .
• One in five OTC users first learned about m-money through a recommendation from another person, although a larger percentage of OTC users were informed by the media, particularly TV . At the same time, the absence of registered m-money users within their personal social networks (friends or relatives of the respondents) was the second most frequently cited reason OTC users did not register for an m-money account . Ninety-eight percent of OTC users said they are either very likely or somewhat likely to recommend mobile money to others . The same percentage is very or somewhat likely to continue using m-money services in the future .
figure 8. the top five sources of information about
m-money among otc users (n=234) figure 9. the top five reasons otc users have not registered for an m-money account (n=234)
Source: InterMedia FITS study of households in Pakistan, May-September 2012; N=4,940.
OTC users’ perceptions of m-money underlined insufficient clarity about the practical applications of m-money services . Most OTC users (88 percent) described mobile money primarily as a way to send and receive money . A small portion viewed it as a way to make payments (10 percent), while very few described it as a way to store money (2 percent) .
• Among nonusers, most viewed m-money as primar-ily a way to send and receive monetary remittances . Smaller percentages described it as a way to save money, make non-remittance payments, or perform other financial operations . Thirteen percent of non-users thought m-money did not offer any of these financial operations .
figure 10. reason nonusers do not use m-money services (n=4,684)
Source: InterMedia FITS study of households in Pakistan, May-September 2012; N=4,940. Radio Billboard Newspaper Recommendation from another person Television
Do not feel it is secure Did not have necessary document Did not know it was possible Nobody among my friends and family is a registered user Do not need to register 59% 12% 6% 12% 5% 69% 20% 3% 7% 1%
Friends and family play an important role in raising awareness of m-money services and stimulating registration. Other reasons Too complicated No network available Do not own a mobile phone Do not understand it Do not need it
(do not send or receive money) Do not know about it 40% 7% 5% 34% 6% 5% 3%
When reporting on their financial activities in the past six months, households with m-money users were more likely to say they sent or received remittances, saved money and owned a type of insurance than households with no m-money users. They were also more likely to be banked (Figure 11).
Households with m-money users were three times more likely to report sending or receiving remittances in the past six months (30 percent) than households with no m-money users (11 percent) . Households that use m-money services also are more likely to own insurance and have savings .
Ninety-six percent of households with m-money users and 94 percent of households without users reported sending at least one non-remittance payment, such as a utility or tax payment, in the past six months, while only 10 percent in each group received any type of payment, including wages . Reports on money-lending practices were scarce and might not reveal the poten-tial difference between households with and without m-money users .
hoUseholds’ finanCial roUtines
and the role of Mobile Money
rEmittancES: SEndinG and rEcEivinG PattErnS
The current Pakistani remittance market is domi-nated by non-monetary/in-kind transactions. Twelve percent of all households16 sent or received
remittances of any type (including money, food or other goods) in the past six months; 4 percent sent or received money.17 The example of Kenya,
however, shows that the relatively small size of the market might not accurately reflect the demand for safe and affordable financial services that can accommodate remittances.18
Households that use m-money were more likely to send and receive monetary remittances (18 per-cent and 11 perper-cent, respectively) compared to households that don’t use m-money (1 percent, each).
figure 11. households’ financial activities in the past six months
Source: InterMedia FITS study of households in Pakistan, May-September 2012; N=4,940. Saved money Received non-remittance payments Sent non-remittance payments Received remittances Sent remittances 9% 21% 96% 8% 39% 13% 94%
■ Households with m-money users (n=256) ■Households with no m-money users (n=4,684) 46%
Regardless of their m-money status, very few Pakistani households engage in advanced financial activities.
10% 10%
Basic Financial Activities
Was owed money Owed money Owned insurance Banked 9% 20% 2% 0.4% 5% 3% 5% 1%
common methods of sending and receiving monetary remittances
A slim majority (53 percent) of households that sent or received monetary remittances in the past six months19 used hand-delivery by themselves or
by friends/family members. Two in five households used an m-money account to deliver remittances. Thirty-eight percent of all households that sent20 and
44 percent of households that received21 monetary
remittances in the past six months used an m-money account to deliver money .
The household account was mostly used for sending remittances (23 percent of sending households) and an agent’s account was utilized more frequently for receiv-ing remittances (29 percent of receivreceiv-ing households) . • When sending monetary remittances, 14 percent
of sending households also used an agent’s account and 1 percent used an account of a friend, relative or acquaintance .
• When receiving monetary remittances, 15 percent of receiving households used a household account, few households used an account of a friend, relative or acquaintance .
Hand-delivery was the most common remittance-deliv-ery method . Fifty-five percent of households that sent and 44 percent of households that received monetary remittances in the past six months had remittances delivered by a member of the household or a friend .
distances for monetary remittances sent or received
The distance between senders and recipients of remittances appeared to be related to the choice of remittance-delivery methods. Seventy-three per-cent of hand-delivered remittances were sent to or received from less than 10 km away. A similar percentage (78 percent) of remittances delivered via an m-money account were sent to or received from at least 50 km away (Figure 13).
All remittances reported by households in the past six months were to destinations within Pakistan. choice of different remittance methods
Most households that sent or received remittances in the past six months22 used a specific method
because it was easy to use (cited by 66 percent), safe (21 percent) or fast (8 percent).
While safety is one of the important concerns, only one household said their remittances were not delivered in full .
There were only five cases where both remittance- sending and remittance-receiving households had a registered m-money account . In all of these, an m-money account was used to deliver monetary remittances .
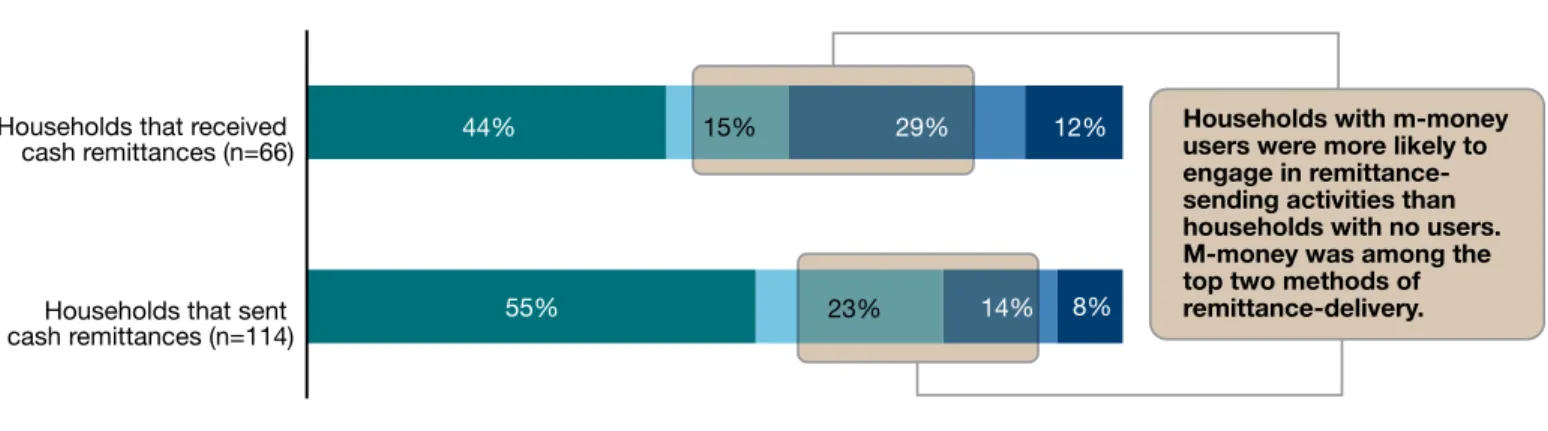
figure 12. top three methods of sending and receiving monetary remittances in the past six months
Source: InterMedia FITS study of households in Pakistan, May-September 2012; N=4,940. Households that sent
cash remittances (n=114) Households that received
cash remittances (n=66) 44% 15% 29% 12%
■ Hand-delivered (by self or by friend) ■M-money household account ■ M-money agent’s account ■Other 23%
55% 14% 8%
Households with m-money users were more likely to engage in remittance-sending activities than households with no users. M-money was among the top two methods of remittance-delivery.
Based on households’ reports of the most recent monetary remittances they sent or received, the median monetary amounts transferred via m-money, delivered in person, or using a bus ranged between $20 and $47 (Figure 15). The costs associated with m-money transfers might be considered a disadvantage since other common delivery methods (i.e., hand-delivery and delivery by bus) are reported to be free.
figure 13. distance travelled by remittances sent or received using hand-delivery and an m-money account
Source: InterMedia FITS study of households in Pakistan, May-September 2012; N=4,940.
figure 14. top three reasons for choosing a delivery method to send or receive monetary remittances
Source: InterMedia FITS study of households in Pakistan, May-September 2012; N=4,940.
delivery method
last three remittances (aggregate amounts) sent/received % of households
using this method
amount sent/received (median)
all-inclusive cost of delivery (median)23
Pkr $ Pkr $
Hand-delivery (by self or by friend) 53% 2,000 20.76 0 0 M-money delivery via household’s account
(any provider) 19% 3,125 32.44 240 2.49
M-money delivery via an agent’s account
(any provider) 19% 4,000 41.53 100 1.04
Bus delivery with a friend or a driver/courier 5% 4,500 46.72 0 0 Source: InterMedia FITS study of households in Pakistan, May-September 2012; N=4,940.
figure 15. cost of sending and receiving monetary remittances using selected delivery methods (n=171 households) Abroad 200+ km 50-199.9 km 10-49.9 km 2-9.9 km less than 2 km 3% 22% 47% 45% 26% 15%
■ M-money account (n=163) ■Hand-delivery by self or by friend (n=140)
33% 0% 5% 1% 6% Hand-delivery M-money
Households that received monetary remittances (n=166) Households that sent monetary remittances (n=114)
Fast Safe
Easy
■ Households that sent monetary remittances (n=114)
■Households that received monetary remittances (n=66) 62% 25% 71% 7% 15% 9%
common reasons for remittance-related activities
Remittances delivered using m-money tend to have somewhat different purposes than tances delivered by hand. In particular, remit-tances sent using an m-money account24 are more
likely to be for business reasons, while hand-deliv-ered remittances are likely to be a part of regular financial support.
Remittances also are used to help other households cope with financial hardships .
• For example, 26 percent of hand-delivered remit-tances were sent to help with marriage expenses . Eigh-teen percent of remittances sent via m-money services were intended as a help in paying health expenses . Aggregated responses of all households engaged in remittance-related activities, show that most monetary remittances were sent or received for no specific reason . • About one in eight remittances were sent or received
as a part of informal lending practices .
common groups of remittance senders and recipients25
The most common groups of senders and recipi-ents of hand-delivered remittances, and remit-tances sent/received using m-money are the same: friends, peers, acquaintances, or members of an extended family permanently living away from the household.
Seventy-two percent of money transfers among friends, peers and acquaintances26 were sent for no specific
rea-son . The second and third most common purposes were informal lending (6 percent) and business (3 percent) . Ten percent of friends, who exchanged remittances,27
used m-money accounts to deliver money .
figure 16. the top three reasons for the last three monetary remittances sent and received using an m-money account
figure 17. the top three reasons for the last three monetary remittances sent and received using hand-delivery Business No particular reason Regular support No particular reason To pay health expenses Business No Emergency particular reason Regular support No particular reason Help for marriage Regular support
■ Monetary remittances sent (n=102)
■Monetary remittances received (n=38) 28%
17%
26% 24%
32%
21%
■ Monetary remittances sent (n=95)
■Monetary remittances received (n=68) 39% 12% 18% 24% 34% 22%
Households tend to use m-money and hand-delivery for different types of remittances
non-rEmittancE PaymEntS: SEndinG and rEcEivinG PattErnS
Non-remittance payments appear to provide the best current opportunity for m-money expan-sion. Ninety-four percent of surveyed households reported sending at least one non-remittance pay-ment and 10 percent received paypay-ments in the past six months.
Most non-remittance payments were hand-deliv-ered. Other types of money-delivery, including m-money, were used by 1 percent (or fewer) of households.
All households that reported a payment in the past six months sent or received money .
More households with m-money users than households with no m-money users made or received non-remit-tance payments in the past six months .
• Households with m-money users were likely to send or receive fewer payments than households with no users . For example, 39 percent of households with m-money users sent more than six payments in the past six months compared with 56 percent of house-holds with no m-money users .
Generally, the senders and recipients of payments as well as the reasons for the most recent payments were similar for all households, regardless of their m-money status .
• Of all non-remittance payments sent by households in this survey,28 most were made in response to either
a fee-based bill (tax, fine or fee) or a non-fee bill (not tax, fine or fee) . School and government were the two most frequently named recipients of non-remittance payments .
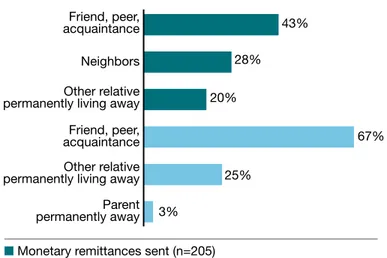
figure 18. the top three groups of monetary remittance recipients and senders
Source: InterMedia FITS study of households in Pakistan, May-September 2012; N=4,940.
Parent permanently away Other relative permanently living away Friend, peer, acquaintance Other relative permanently living away Neighbors Friend, peer, acquaintance
■ Monetary remittances sent (n=205)
■Monetary remittances received (n=121) 28% 20% 43% 67% 25% 3% School Utility company Government Government program Employer Government 4% 69% 5% 19% 72% 24% Government is the leading sender and recipient of payments, mostly as wages and payments for non-fee bills, respectively.
■ Payment received (n=1,429) ■Payments sent (n=13,980) The top three groups of
payment recipients and senders
Rent Pay a bill (tax, fine or fee) Pay a non-fee bill Payment for goods Benefits Wages 2% 91% 1% 3% 94% 8%
The top three reasons for payments made and received figure 19. top-three groups of payment recipients
and senders figure 20. the top three reasons for payments made and received in the past six months
• Seventy-two percent of non-remittance payments received by households in the past six months29 were
money transfers from the government (72 percent, including wages and benefits) or a government-sponsored program (4 percent) . Employers were the second most frequently named source of non-remit-tance payments (19 percent of all payments received by the households) . Almost all reported payments were wages (94 percent) with only a few households reporting receiving benefits or payments for goods . Based on the reports of the households engaged in payment-related activities in the past six months, there were negligible costs associated with sending/receiv-ing money regardless of which type of money-delivery they used (Figure 21) . In addition, all payment-delivery methods appear safe as not a single household reported their payments lost or stolen .
mEchaniSmS for houSEhold SavinGS Two in five Pakistani households save money; the majority uses only one or two savings instru-ments. Households that use mobile money are more likely to save; but using an m-money account for savings is not common (0.4 percent of households using m-money).
Aside from being more likely to report savings, house-holds with m-money users also use different approaches to saving compared with households that do not use
m-money . In particular, households with m-money users are more likely to save with financial institu-tions and with other people than households without m-money users (Figure 22) .
• Households with no m-money users are equally likely to save in a hiding place or with a community/neigh-borhood group; but the likelihood of them saving with a financial institution or another person is low . • For both groups, a hiding place is one of the two
most common savings instruments .
The safety of household savings does not appear to be a major concern . Of households that save money, only 2 percent had lost some money from their savings or had it stolen in the last 12 months . None of the savings instruments stood out as the most safe or most risky .
inSurancE and loanS
Among households that engage in lending-related activities (5 percent of all surveyed households), 45 percent use m-money for money transfers, mostly to make payments on the money they bor-row. Among the lenders who received payments via m-money, the top three were their immediate family (cited by 40 percent of borrowing house-holds that used m-money services in relation to their loans), employers (28 percent) and shop-keepers (16 percent).
figure 21. costs of sending non-remittance payments via selected delivery methods (n=4,686 households)
delivery method
last three non-remittance payments (aggregate amounts) sent % of households
using this method
total amount sent (median) all-inclusive cost of sending (median)30
Pkr $ Pkr $
Hand-delivery (by self or by friend) 92 700 7.3 0 0 M-money delivery via an agent’s account
(any provider) 1 1,000 10.4 0 0
Bus delivery with a friend or a driver/courier 1 800 8.4 0 0 Source: InterMedia FITS study of households in Pakistan, April-May 2012; N=4,940.
M-money does not play a large role in the ance sector. Of all households that owned insur-ance at the time of the survey,31 11 percent
delivered payments via an m-money account. Few households in Pakistan engage in loan and insur-ance activities . Currently, 2 percent of surveyed house-holds own any type of insurance and 5 percent of all surveyed households reported any credit-related activ-ity . Significantly more households borrow (5 percent) money than lend (1 percent) money .
• Households that owned insurance at the time of the survey were more urban and financially better off than the average household in the sample, while house-holds that had an unpaid (or recently paid) debt were more likely to be disadvantaged—rural, poor and unbanked—than the average household (Figure 23) . • Households with m-money users were more likely to
report having insurance . Loan activity did not differ by households’ m-money status .
figure 22. Savings instrument used by households, by type of m-money user in the household
Source: InterMedia FITS study of households in Pakistan, May-September 2012; N=4,940.
General patterns of borrowing behaviors of surveyed households show that most borrowing happens at a local level with loans coming from either employers or immediate family (Figure 24) .
Among the households that borrowed or lent money in the six months prior to the survey,32 45 percent used
m-money to transfer loans and/or payments: 2 percent used m-money to lend money/receive payments and 43 percent to borrow money/make payments .
• Almost all households that reported an unpaid debt received their loans in person (93 percent) . However, almost one-half (46 percent) used m-money to send payments to the lender—the same percentage as those who delivered payments in person .
• The frequency of loan payments was similar for both households that hand-deliver their payments and those who use m-money for loan payments (Figure 25) . M-money account With another person Community level savings With a financial institution Hiding place
Any type of savings instrument 39% 46% 22% 18% 17% 22% 9%
■ Households with m-money users (n=256) ■Households with no m-money users (n=4,684) 14%
0.4% 0.1% 6%
14%
Households with m-money users were equally likely to save in a hiding place or with a financial institution.
Few households used an m-money account for savings because the number of registered accounts was small.
figure 23. demographic characteristics of households that owned insurance or had an unpaid loan at the time of the survey
Source: InterMedia FITS study of households in Pakistan, May-September 2012; N=4,940.
Households with insurance (n=119) Households with an unpaid loan (n=237)
All households (n=4,940) 67% 83% 95% 95% 91% 79%
■ Rural ■Poor ( living on less than $2 a day) ■Unbanked ■No m-money users
46% 89% 60% 48% 98% 89%
Households with insurance were less likely and households with an unpaid debt were more likely to be rural, poor, unbanked and have no m-money users.
figure 24. the patterns of activities related to loans received/extended in the past six months (n=237 households that borrowed money)
Source: InterMedia FITS study of households in Pakistan, May-September 2012; N=4,940. toP thrEE lEndErS
Employer, 39% Immediate family, 33%
Hire purchase, 10%
Proximity of thE toP thrEE lEndEr
locationS
This village/town, 80% This district, 10%
This region, 4%
toP thrEE mEthodS for rEcEivinG loanS
In person, 93% M-money (any account), 6%
Bank transfer, 2%
toP thrEE mEthodS for SEndinG PaymEntS
In person, 46% M-money (any account), 46%
Bank transfer, 0.4%
figure 25. how often do you make a payment [on your loan]?
Source: InterMedia FITS study of households in Pakistan, May-September 2012; N=4,940.
Other One single payment
Annually Monthly Weekly Daily 1% 30% 19% 59% 1% 20%
■ Households that hand-deliver loan payments (n=110) ■Households that use m-money to deliver loan payments (n=108) 61%
0% 4%
1% 3% 2%
Most households repay a loan in one single payment regardless of whether they pay in-person or via an m-money account.
Twenty-eight percent of all surveyed households reported at least one economic shock in the six months prior to the survey. Receiving or sending remittances in response to an economic shock, however, was equally rare among households with and without m-money users.
Among households that experienced economic shocks,33 91 percent experienced one shock, 8 percent
experienced two, and 1 percent reported experiencing three or more economic shocks .
The unspecified illness of a household member was the most frequently cited economic shock . The percentages of households that reported any other economic shock were negligible at 2 percent or lower (Figure 26) . Of households that experienced an economic shock, 2 percent gained money as a result of a positive shock, and 41 percent needed money to respond to a negative shock . Fifty-eight percent of households that experi-enced an economic shock responded by saying they were not sure of the effect the shock had on their budgets .
nEGativE Economic ShockS
Receiving remittances in response to a negative economic shock is very rare. Only one household with m-money users (3 percent) and nine house-holds without m-money users (2 percent) received remittances to help them cope with the loss of money. Remittances, however, had the third high-est median response value at 1,050 PKR ($10.90) among all possible responses to negative economic shocks.
Depleting the household’s savings was the most fre-quently chosen response to a negative economic shock . More than one-third of households affected by negative economic shocks were forced to reduce their expendi-tures, including spending on various necessities (28 per-cent) and food expenditures (11 perper-cent) .
eConoMiC shoCks and hoW
hoUseholds resPond to theM
• Fourteen percent of households that reported negative economic shocks borrowed money from other people, including relatives and friends, to cope with negative shocks; about one in 10 households prayed .
The three responses with the highest reported median monetary value were the removal of children from school (saved 5,000 PKR/$51 .30 in tuition costs), the employment of a previously non-working member of a household (a one-time gain of 2,750 PKR/$28 .21), and remittances from other people (a one-time gain of 1,050 PKR/$10 .90) .
Limited use of m-money during times of financial hard-ships signals a missed opportunity for m-money pro-viders to help poor households mitigate the ill effects of negative financial shocks . As an example, a national survey in Kenya showed that access to a digital pay-ment system allowed households to gain financial sup-port from larger informal networks .34 The survey found
M-PESA users were able to fully absorb major negative
figure 26. most frequent economic shocks (% of all surveyed households)
Source: InterMedia FITS study of households in Pakistan, May-September 2012; N=4,940. Accidental injury Death of a household member Livestock died Birth in the household Illness of a household member 23% 2% 1% 1% 1%
shocks to their income (e .g ., severe illness, job loss or harvest failure) without any reduction in household consumption . In contrast, statistically comparable households that weren’t connected to M-PESA experi-enced, on average, a 6 to 10 percent reduction in con-sumption in response to similar shocks .35
In addition, households with access to M-PESA were more likely to: receive a remittance; receive a larger total amount of remittances; receive funds from a larger network of senders; and receive funds from senders who are located further away . Digital payments thus appeared to improve risk-sharing across households .36
figure 27. the top five responses to negative economic shocks (n=569 households that reported a negative shock)
PoSitivE Economic ShockS
Among households that gained money as a result of a positive economic shock, no household sent gifts or remittances to other people or house-holds. About one-third each increased savings or increased expenditures on various essentials. Among all possible ways to spend extra money gained as a result of positive economic shocks, working less required the highest median investment at 5,000 PKR ($51 .30) . Increased spending on food and medications were the second and third highest investments at 625 PKR ($6 .41) and 250 PKR ($2 .56), respectively .
Source: InterMedia FITS study of households in Pakistan, May-September 2012; N=4,940.
Prayed Decreased
expenditure on food Borrowed money from family,
friend and other sources Decreased other
expenditures Spent cash savings
43%
11% 28%
14%
Although most households in Pakistan have access to mobile phones and SIM cards, only 5 percent use m-money . With most users choosing over-the-counter (OTC) services, m-money registration is low at 0 .3 per-cent . According to the survey findings, there are several reasons for the limited use of m-money .
Among nonusers these include low awareness and their lack of understanding of m-money’s practical applica-tions . OTC users do not see the advantage of a regis-tered account over using an agent’s services . They also demonstrate an insufficient understanding of m-money services .
• Currently, most OTC users and nonusers of
m-money perceive m-money as a service for sending or receiving informal cash transfers . Few OTC users and nonusers know that m-money can be used to save money, make non-remittance payments or perform other financial activities . Subsequently, few house-holds with m-money users take advantage of the full range of m-money services .
ConClUsions
• OTC users also seem to rely on members of their social networks to recommend the use of m-money services .
TV advertisements appear to have good reach for pro-viding initial information about m-money services . In addition, OTC users’ satisfaction with m-money ser-vices and their willingness to recommend them to other people contribute to the success of word-of-mouth promotion of m-money .
Households that use m-money are more likely than households with nonusers to engage in a large number of financial activities . However, their use of m-money is currently limited to money transfers within their net-work of friends and relatives, which might be a reflec-tion of the informal economy in Pakistan .
1 FinMark Trust (2009): FinAccess National Survey
2009: Dynamics of Kenya’s Changing Financial Land-scape .
2 FSD-Kenya (2007a and 2009a) http://www
.fsdke-nya .org/insights/10-10-13_FSD_Insights_M-PESA_ issue_01 .pdf . 3 Ibid . 4 https://www .cia .gov/library/publications/the-world-factbook/geos/pk .html . 5 https://www .cia .gov/library/publications/the-world-factbook/geos/pk .html#top . 6 https://www .cia .gov/library/publications/the-world-factbook/geos/pk .html#top .
7 http://www .fco .gov .uk/en/travel-and-living-abroad/
travel-advice-by-country/country-profile/asia-oceania/ pakistan/?profile=today .
8 Global Findex 2011, http://microdata .worldbank .org/
index .php/catalog/1226/datafile/F1 .
9 Ibid .
10 http://www .indexmundi
.com/pakistan/cell-phone-companies-in-pakistan .html .
11 http://www .budde .com
.au/Research/Pakistan-Tele-coms-Mobile-Broadband-and-Forecasts .html .
12 http://telenor .com/investor-relations/company-facts/
business-description/telenor-pakistan .
13 Suri and Jack (2011) . “Risk sharing and transaction
costs: Evidence from Kenya’s mobile money revolu-tion .” Working Paper .
14 The analysis in the section on motivators for and
bar-riers to the adoption of m-money services is based on the results of the interviews with individual OTC users, one per each household with OTC users . In households with more than one OTC user, one user was selected for an interview using a last-birthday method . The number of registered users (n=17) was not sufficient for a valid analysis .
15 n=234 randomly selected individual members of the
surveyed households . The findings are not representa-tive of the individual users in Pakistan .
endnotes
16 n=567 17 n=171
18 FSD-Kenya (2007a and 2009a) http://www
.fsdke-nya .org/insights/10-10-13_FSD_Insights_M-PESA_ issue_01 .pdf . 19 n=171 20 n=114 21 n=66 22 n=171
23 Cost of delivery includes fees for sending and
collect-ing the money as well as transportation costs for both sender and recipient of a remittance .
24 n=163
25 The “remittance recipients” question is asked of those
who sent remittances . The “remittance senders” ques-tion is asked of those who received remittances .
26 n=1,655 27 n=358 28 n=13,980 29 n=1,429
30 Cost of delivery includes only the fees for sending the
money for a non-remittance payment .
31 n=119 32 n=252 33 n=1,376
34 Suri and Jack (2011) . “Risk sharing and transaction
costs: Evidence from Kenya’s mobile money revolu-tion .” Working Paper .
35 Using regression techniques, the researchers perform
several tests to rule out alternative explanations (like higher income) which are correlated with M-PESA usage .
36 Suri and Jack (2011) . “Risk sharing and transaction
costs: Evidence from Kenya’s mobile money revolu-tion .” Working Paper .
about intErmEdia
InterMedia (www .intermedia .org) is a nonprofit consulting group with expertise in applied research and evaluation . We help clients understand, inform and engage people worldwide—especially in challenging environments . InterMedia’s offices are located in Washington, D .C ., London and Nairobi, and we work with a global network of research partners . Clients active in international development, global media and strategic communication come to us for insight on how people gather, interpret, share, and use information from all sources and on all platforms . We provide guidance and impact assessment for strategies focused on engagement, behavior change, content delivery and the use of com-munication technologies for social good .
InterMedia promotes knowledge-sharing through a range of online and offline resources, including AudienceScapes (www .audiencescapes .org)—a research dashboard providing data and analysis of media and communication environments in developing countries . We are also committed to strengthening research capacity in the countries where we work .
Contact us at: generalinfo@intermedia .org .
acknoWlEdGmEntS
About the author: Anastasia Mirzoyants, Ph .D ., is associate director of research at InterMedia and principal author of this report . She leads implementation of the Financial Inclusion Tracker Surveys (FITS) project in Uganda, Paki-stan and Tanzania . At InterMedia, Ms . Mirzoyants specializes in research focused on assessing financial services for the poor, and understanding the impact of traditional media and digital communications in developing markets . She received her doctoral degree from the University of Toledo, Ohio .
This report could not have been prepared without the contributions of a number of InterMedia staff who provided additional research and support for the project:
Tim Cooper, Director of Research
Peter Goldstein, Director of Foundation Relations Hugh Hopestone, Research Consultant
Max Richman, Research Analyst
Michelle Kaffenberger, Research Manager
rESEarch SuPPort tEam
Data quality control: SwissPeaks | Editor and Graphic Designer: Mary Ann Fitzgerald, Diane Buric A special note of thanks and gratitude goes to InterMedia’s data collection partner on this study: PIPO in Islamabad, without whom this project would not have been possible . InterMedia also would like to acknowledge Sonja Gloeckle, former senior research manager at InterMedia for all of her work during the initial stages of this project .
In addition, InterMedia would like to thank the Bill & Melinda Gates Foundation’s Financial Services for the Poor program, and personally thank Dr . Jake Kendall, Senior Program Officer, Innovation and Research, Financial Services for the Poor, as well as Dr . Tavneet Suri, Associate Professor, MIT Sloan School of Management, for the productive partnership on this project .
This study was carried out with funding from the Bill & Melinda Gates Foundation . All survey materials and data resulting from this study are the property of the Gates Foundation, but the findings and conclusions within are those of the authors and do not necessarily reflect the foundation’s positions or policies .
Headquarters Washington, D .C . Tel: +1 .202 .434 .9310 InterMedia Europe London, U .K . Tel: +44 .207 .831 .8724 InterMedia Africa Nairobi, Kenya Tel: +254 .720 .109183 For general inquiries